Jan 1, 2011 - This paper, focusing on metrics lifecycle, various software testing metrics, need ... been 'measurement of and metrics for' the software testing.
Premal B. Nirpal et al. / International Journal on Computer Science and Engineering (IJCSE)
A Brief Overview Of Software Testing Metrics Mr. Premal B. Nirpal
Dr. K. V. Kale,
Department of CS & IT, Dr. B. A. M. University, Aurangabad, India
Professor and Head, Department of CS & IT, Dr. B. A. M. University, Aurangabad, India(Author)
Abstract—Metrics are gaining importance and acceptance in corporate sectors as organizations grow, mature and strive to improve enterprise qualities. Measurement of a test process is a required competence for an effective software test manager for designing and evaluating a cost effective test strategy. Effective management of any process requires quantification, measurement and modeling. Software Metrics provide quantitative approach to the development and validation of the software process models. Metrics help organization to obtain the information it needs to continue to improve its productivity, reduce errors and improve acceptance of processes, products and services and achieve the desired Goal. This paper, focusing on metrics lifecycle, various software testing metrics, need for having metrics, evaluation process and arriving at ideal conclusion have also been discussed in the present paper. Keywords- Software Testing, Software Testing Metrics I.
INTRODUCTION
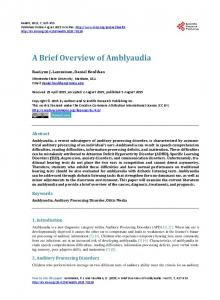
In recent years software testing technologies have emerged as a dominant software engineering practice which helps in effective cost control, quality improvements, time and risk reduction etc. The growth of testing practices has required software testers to find new ways for estimating their projects. A key research area in this field has been ‘measurement of and metrics for’ the software testing. Measurement since plays a critical role in effective and efficient software development, making measurements of the software development and test process is very complex [2]. A. Business need Increase in competition and leaps in technology have forced companies to adopt innovative approaches to assess themselves with respect to processes, products and services. This assessment helps them to improve their business so that they succeed and make more profits and acquire higher percentage of market. Metric is the cornerstone in assessment and also foundation for any business improvement. B. Software Metrics Metric is a standard unit of measurement that quantifies results. Metric used for evaluating the software processes, products and services is termed as Software Metrics. Definition of Software Metrics: Software Metrics is a Measurement Based Technique which is applied to processes, products and services to supply engineering and management information and working on the information supplied to improve processes, products and services, if required. Measurement Based Techniques
Applied To
Processes, Products & Services To Improve To Supply
Engineering & Management Information Fig. 1 Software Metrics
ISSN : 0975-3397
Vol. 3 No. 1 Jan 2011
204
Premal B. Nirpal et al. / International Journal on Computer Science and Engineering (IJCSE)
C. Importance of Metrics
Metrics is used to improve the quality and productivity of products and services thus achieving Customer Satisfaction. Easy for management to digest one number and drill down, if required. Different Metric(s) trend act as monitor when the process is going out-of-control. Metrics provides improvement for current process.
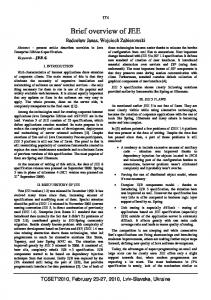
D. Metrics Lifecycle The process involved in setting up the metrics:
Analysis
Communique
-Identify Metric(s) to Use -Define Metric(s) Identified -Define Parameter(s) for identifying the Metric(s) Identified. -Explain the need of metric to stakeholder and testing team -Educate the testing team about the data points need to be captured for processing the metric.
-Capture the data. Evaluating
Reporting
-Verify the data. -Calculating the metric(s) value using the data captured.
-Develop the report with effective conclusion -Distribute report to the stakeholder and respective representative. -Take feedback from stakeholder.
Fig. 2 Software Metrics Lifecycle
II.
TYPE OF SOFTWARE TESTING METRICS
Based on the types of testing performed, following are the types of software testing metrics: 1.
Manual Testing Metrics
2.
Performance Testing Metrics
3.
Automation Testing Metrics
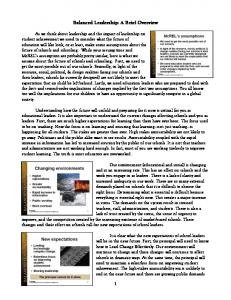
Following table shows different software testing metrics.
ISSN : 0975-3397
Vol. 3 No. 1 Jan 2011
205
Premal B. Nirpal et al. / International Journal on Computer Science and Engineering (IJCSE)
TABLE I.
Manual
Performance
Automation
Common Metrics
SOFTWARE TESTING METRICS
Test Case Productivity Test Execution Summary Defect Acceptance Defect Rejection Bad Fix Defect Test Execution Productivity Test Efficiency Defect Severity Index Performance Scripting Productivity Performance Execution Summary Performance Execution Data - Client Side Performance Execution Data - Server Side Performance Test Efficiency Performance Severity Index Automation Scripting Productivity Automation Test Execution Productivity Automation Coverage Cost Compression Effort variance Schedule Variance Scope change
o o o o o o o o o o o o o o o o o o o o o
A. Manual Testing Metrics 1) Test Case Productivity (TCP) This metric gives the test case writing productivity based on which one can have a conclusive remark.
TotalRawTe st Steps Step(s)/ho ur Efforts(ho urs)
Total Case Productivi ty
Example Test Case Name XYZ_1 XYZ_2 XYZ_3 XYZ_4 XYZ_5 Total Raw Steps
Raw Steps 30 32 40 36 45 183
Efforts took for writing 183 steps is 8 hours. TCP=183/8=22.8 Test case productivity = 23 steps/hour One can compare the Test case productivity value with the previous release(s) and draw the most effective conclusion from it. 2) Defect Acceptance (DA) This metric determine the number of valid defects that testing team has identified during execution.
Number of valid Defects Defect Acceptance * 100 % Total Number of Defects The value of this metric can be compared with previous release for getting better picture 3) Defect Rejection (DR) This metric determine the number of defects rejected during execution.
ISSN : 0975-3397
Vol. 3 No. 1 Jan 2011
206
Premal B. Nirpal et al. / International Journal on Computer Science and Engineering (IJCSE)
Number of Defects Rejected Total Number of Defects * 100 %
Defect Rejection
This metric gives the percentage of the invalid defect the testing team has opened and one can control, if required, in future. 4) Bad Fix Defect (B) Defect whose resolution give rise to new defect(s) are bad fix defect. This metric determine the effectiveness of defect resolution process.
Number of Bad Fix Defect(s) Total Number of Valid Defects
Bad Fix Defect
* 100 %
This metric gives the percentage of the bad defect resolution which needs to be controlled. 5) Test Execution Productivity (TEP) This metric gives the test cases execution productivity which on further analysis can give conclusive result.
Test Execution Productivi ty
Number of TCexecuted (Te) Execution Efforts (hours)
* 8 Execution( s)/Day
Where Te is calculated as, Where, Base Test Case = No. of TC executed at least once. T (1) = No. of TC Retested with 71% to 100% of Total TC steps T (0.66) = No. of TC Retested with 41% to 70% of Total TC steps T (0.33) = No. of TC Retested with 1% to 40% of Total TC steps 6) Test Efficiency (TE) This metric determine the efficiency of the testing team in identifying the defects. It also indicated the defects missed out during testing phase which migrated to the next phase. Test Efficiency
DT DT DU * 100 %
Where, DT = Number of valid defects identified during testing. DU = Number of valid defects identified by user after release of application. In other words, post-testing defect
7) Defect Severity Index (DSI) This metric determine the quality of the product under test and at the time of release, based on which one can take decision for releasing of the product i.e. it indicates the product quality.
Defect Severity Index
(Severity
Index * No. of Valid Defect(s) for this severity Total Number of Valid Defects
One can divide the Defect Severity Index in two parts:
a) DSI for All Status defect(s): This value gives the product quality under test. b) DSI for Open Status defect(s): This value gives the product quality at the time of release. For calculation of DSI for this, only open status defect(s) must be considered. DSI (Open)
(Severity
Index * No. of Open Valid Defect(s) Total Number
for this severity
of Valid Defects
B. Performance Testing Metrics 1) Performance Scripting Productivity (PSP) This metric gives the scripting productivity for performance test script and have trend over a period of time.
ISSN : 0975-3397
Vol. 3 No. 1 Jan 2011
207
Premal B. Nirpal et al. / International Journal on Computer Science and Engineering (IJCSE)
Performanc e Scripting Productivi ty
Operations Performed Efforts (hours)
Operation(
s)/hour
Where Operations performed
is: 1. No. of Click(s) i.e. click(s) on which data is refreshed. 2. No. of Input parameter 3. No. of Correlation parameter Above evaluation process does include logic embedded into the script which is rarely used. Example Operation Performed Total No. of clicks 10 No. of Input Parameter 5 No. of Correlation Parameter 5 Total Operation Performed 20 Efforts took for scripting = 10 hours. Performance scripting productivity =20/10=2 operations/hour. 2) Performance Execution Summary This metric gives classification with respect to number of test conducted along with status (Pass/Fail), for various types of performance testing. Some of the types of performance testing: 1. Peak Volume Test. 2. Endurance/Soak Test. 3. Breakpoint/Stress Test. 4. Failover Test 3) Performance Execution Data - Client Side This metric gives the detail information of Client side data for execution. Following are some of the data points of this metric 1. Running Users 2. Response Time 3. Hits per Second 4. Throughput 5. Total Transaction per second 6. Time to first byte 7. Error per second 4) Performance Execution Data - Server Side This metric gives the detail information of Server side date for execution. Following are some of the data points of this metric 1. CPU Utilization 2. Memory Utilization 3. HEAP Memory Utilization 4. Database connections per second 5) Performance Test Efficiency (PTE) This metric determine the quality of the Performance testing team in meeting the requirements which can be used as an input for further improvisation, if required. Performanc e Test Efficiency
(Requireme
Requiremen t during PT * 100 nt during PT)Require ment after Signoff of PT
% To
evaluate this one need to collect data point during the performance testing and after the signoff of the performance testing. Some of the requirements of Performance testing are: 1. Average response time. 2. Transaction per Second. 3. Application must be able to handle predefined max user load. 4. Server Stability Example Consider during the performance testing above mentioned requirements were met. In production, average response time is greater than expected, then Requirement met during PT = 4 Requirement not met after Signoff of PT = 1
ISSN : 0975-3397
Vol. 3 No. 1 Jan 2011
208
Premal B. Nirpal et al. / International Journal on Computer Science and Engineering (IJCSE)
PTE = (4 / (4+1)) * 100 = 80% Performance Testing Efficiency is 80% 6) Performance Severity Index (PSI) This metric determine the product quality based performance criteria on which one can take decision for releasing of the product to next phase i.e. it indicates quality of product under test with respect to performance.
(Severity
Performanc e Severity Index
Index * No. of Req. not met for this severity) * 100 Total No. of Requiremen t not met
If requirement is not
met, one can assign the severity for the requirement so that decision can be taken for the product release with respect to performance. Example Consider, Average response time is important requirement which has not met, then tester can open defect with Severity as Critical. Then Performance Severity Index = (4 * 1) / 1 = 4 (Critical)
C. Automation Testing Metrics 1) Automation Scripting Productivity (ASP) This metric gives the scripting productivity for automation test script based on which one can analyze and draw most effective conclusion from the same. Automation
Scripting Productivi ty
Operation Efforts
Performed (hours)
Operation(
Where
s)/hours
Operations
performed is: 1. No. of Click(s) i.e. click(s) on which data is refreshed. 2. No. of Input parameter 3. No. of Checkpoint added Above process does include logic embedded into the script which is rarely used. Example Automation scripting productivity = 2.5 operations/hour. 2) Automation Test Execution Productivity (AEP) This metric gives the automated test case execution productivity. Automation
Test Execution
Productivi ty
Total
No. of Automated
TCexecuted
(ATe) *8
Execution
Efforts (hours)
Execution(
s)/Day
Where Te is calculated as, ATe Base Test Case ((T(0.33) * 0.33) (T(0.66) * 0.66) (T(1) * 1))
Evaluation process is similar to Manual Test Execution Productivity.
3) Automation Coverage This metric gives the percentage of manual test cases automated. Automation
Coverage
Total No. of TC Automated Total No. of manual TC
* 100
%
Example If there are 100 Manual test cases and one has automated 60 test cases then Automation Coverage = 60%
4) Cost Comparison This metrics gives the cost comparison between manual testing and automation testing. This metrics is used to have conclusive ROI (return on investment). Manual Cost is evaluated as: Cost (M) =Execution Efforts (hours) * Billing Rate Automation cost is evaluated as: Cost (A) =Tool Purchased Cost (One time investment) + Maintenance Cost + Script Development Cost + (Execution Efforts (hrs) * Billing Rate) If Script is re-used the script development cost will be the script update cost. Using this metric one can have an effective conclusion with respect to the currency which plays a vital role in IT industry.
ISSN : 0975-3397
Vol. 3 No. 1 Jan 2011
209
Premal B. Nirpal et al. / International Journal on Computer Science and Engineering (IJCSE)
III.
COMMON METRICS FOR ALL TYPES OF TESTING
A. Effort Variance (EV) This metric gives the variance in the estimated effort. Operation Performed No. of clicks No. of Input Parameter No. of Checkpoint added Total Operation Performed
Total 10 5 10 25
Efforts took for scripting = 10 hours. ASP=25/10=2.5
Actual Effort - Estimated Effort * 100 % Estimated Efforts
Effort Varience
B. Schedule Variance (SV) This metric gives the variance in the estimated schedule i.e. number of days.
Actual No. of Days - Estimated No. of Days
Schedule Varience
*100 %
Estimated No. of Days
C. Scope Change (SC) This metric indicates how stable the scope of testing is.
Total Scope - Previous Scope
Scope Change
Previous Scope
* 100 %
Where, Total Scope = Previous Scope + New Scope, if Scope increases Total Scope = Previous Scope - New Scope, if Scope decreases IV.
CONCLUSION
Metric is the cornerstone in assessment and foundation for any business improvement. It is a Measurement Based Technique which is applied to processes, products and services to supply engineering and management information and working on the information supplied to improve processes, products and services, if required. It indicates level of Customer satisfaction, easy for management to digest number and drill down, whenever required and act as monitor when the process is going out-of-control. ACKNOWLEDGMENT The authors wish to acknowledge UGC for the award of Research Fellowship in Sciences to Meritorious Students (RFSMS) for carrying out this research. REFERENCES [1] [2] [3] [4] [5] [6] [7] [8] [9] [10] [11] [12] [13]
Roger S. Pressman: “Software Engineering”, A Practitioner’s Approach 5th Edition, McGraw Hill, 1997. Yanping Chen, Robert L. Probert, Kyle Robenson “Effective Test Metrics for Test Strategy Evolution” Proceedings of the 2004 Conference of the centre for Advanced Studies on Collaborative Research CASCON’04 Bellin, D., Manish Tyagi, Maurice Tyler: "Object-Oriented Metrics: An Overview", Computer Science Department, North Carolina A ,T state University, Greensboro, Nc 27411-0002. Booch, G: “Object-Oriented Analysis and Design with Applications”, 2nd ed., Benjamin Cummings, 1994 Khaled El Emam,: “A Primer on OO Measurement”, 1530-1435/05 IEEE, Proceeding of the Seventh International Software Metrics Symposium ( ETRICS’01) Jacobson, I., Christerson, M., Jonsson, P., and Overgaard G.: “Object- Oriented Software Engineering: A Use-Case Driven Approach”, Addison- Wesley, 1992 Fenton, N., S.L. Pfleeger: “Software Metrics: A Rigorous and Practical Approach”, PWS Publishing Co Rosenberg, H. Linda, Lawrence E. Hyatt: “Software Quality Metrics for Object-Oriented Environments”, Crosstalk Jounal,1997 Yanping Chen, Robert L. Probert, Kyle Robenson “Effective Test Metrics for Test Strategy Evolution” Proceedings of the 2004 Conference of the centre for Advanced Studies on Collaborative Research CASCON’04 B. Beizer, Software Testing Techniques 2nd Edition, International Thomson Computer Press, 1990. IEEE Standard for Software Unit Testing IEEE Std. 1008-1987 (R1993). P. C Jorgensen, Software Testing a Craftsman’s Approach. CRC Press, 1995. R.V. Binder Testing Object-Oriented Systems - Models, Patterns, and Tools, Addison-Wesley, 1999.
ISSN : 0975-3397
Vol. 3 No. 1 Jan 2011
210
Premal B. Nirpal et al. / International Journal on Computer Science and Engineering (IJCSE)
[14] M.R Lyu, eds., Handbook of Software Reliability Engineering, McGraw-Hill, 1996. [15] G. Rothermel. and M.J. Harrold, “Analyzing Regression Test Selection Techniques”, IEEE Transactions on Software Engineering, vol. 22, no. 8, pp. 529 – 551, 1996. [16] H. Zhu, P. A. V. Hall and J. H. R. May, "Software unit test coverage and adequacy," ACM Computing Surveys (CSUR), vol. 29, pp. 366-427, 1997 [17] W. Perry, Effective Methods for Software Testing, Wiley 1995. [18] T. Ball, “The concept of dynamic analysis”, Proc.of joint 7th ESEC/7th ACM FSE, Toulouse, France, vol.24, no. 6, October 1999, pp.: 216 – 234. [19] E.W. Dijkstra,“Notes on Structured Programming” T.H. Rep. 70WSK03 1970. http://www.cs.utexas.edu/users/EWD/ewd02xx/EWD249.PDF [20] N. Juristo, A.M. Moreno, and S. Vegas, “Reviewing 25 Years of Testing Technique Experiments”, Empirical Software. Engineering Journal, vol. 9, no. ½, March 2004, pp. 7-44. [21] A. Bertolino, “Knowledge Area Description of Software Testing”, Chapter 5 of SWEBOK: The Guide to the Software Engineering Body of Knowledge. Joint IEEE-ACM Software Engineering Coordination Committee. 2001. http://www.swebok.org/. [22] Srinivasan Desikan, Gopalaswamy Ramesh “Software Testing Principles & Practices” PEARSON Education, 2006. [23] Ron Patton “Software Testing” Techmedia. [24] Tao Feng, Kasturi Bidarkar, “A Survey of Software Testing Methodology”. [25] B. Jones, H. H. Sthamer and D. Eyres, "Automatic structural testing using genetic algorithms," Software Engineering Journal, vol. 11, pp. 299-306, 1996. [26] William E. Lewis, “Software Testing and Continuous Qualify Improvement” CRC Press LLC, 2000. [27] Hamlet, D.Taylor,R. , “Partition testing does not inspire confidence”,IEEE Trans Software Eng., vol 17,pp.1402-1411,1990. [28] W. Gutjahr, "Partition testing vs. random testing: The influence of uncertainty," IEEE Trans. Software Eng., vol. 25, pp. 661-674, 1999. [29] S.P. Ng, T. Murnane, K. Reed, D. Grant, T.Y. Chen “A Preliminary Survey on Software Testing Practices in Australia” Proceedings of the 2004 Australian Software Engineering Conference, IEEE, 2004. [30] Mark Last, Shay Eyal, and Abraham Kandel “Effective Black-Box Testing with Genetic Algorithms” 2005. [31] JoHo W. Cangussu “Modeling and Controlling the Software Test Process” IEEE, 2001
ISSN : 0975-3397
Vol. 3 No. 1 Jan 2011
211