IEEE JOURNAL ON SELECTED AREAS IN COMMUNICATIONS, VOL. 20, NO. ...
The authors are with Carnegie Mellon University, Pittsburgh, PA 15213. USA (e-
mail: ...... simulator. The simulator assumes shortest delay routing be- tween any
...
1456
IEEE JOURNAL ON SELECTED AREAS IN COMMUNICATIONS, VOL. 20, NO. 8, OCTOBER 2002
A Case for End System Multicast Yang-hua Chu, Sanjay G. Rao, Srinivasan Seshan, and Hui Zhang, Member, IEEE
Abstract—The conventional wisdom has been that Internet protocol (IP) is the natural protocol layer for implementing multicast related functionality. However, more than a decade after its initial proposal, IP multicast is still plagued with concerns pertaining to scalability, network management, deployment, and support for higher layer functionality such as error, flow, and congestion control. In this paper, we explore an alternative architecture that we term End System Multicast, where end systems implement all multicast related functionality including membership management and packet replication. This shifting of multicast support from routers to end systems has the potential to address most problems associated with IP multicast. However, the key concern is the performance penalty associated with such a model. In particular, End System Multicast introduces duplicate packets on physical links and incurs larger end-to-end delays than IP multicast. In this paper, we study these performance concerns in the context of the Narada protocol. In Narada, end systems self-organize into an overlay structure using a fully distributed protocol. Further, end systems attempt to optimize the efficiency of the overlay by adapting to network dynamics and by considering application level performance. We present details of Narada and evaluate it using both simulation and Internet experiments. Our results indicate that the performance penalties are low both from the application and the network perspectives. We believe the potential benefits of transferring multicast functionality from end systems to routers significantly outweigh the performance penalty incurred. Index Terms—Multicast, overlay network, self-organizing protocol.
I. INTRODUCTION
T
RADITIONAL network architectures distinguish between two types of entities: end systems (hosts) and the network (routers and switches). One of the most important architectural decisions is the division of functionality between end systems and networks. In the Internet architecture, the internetworking layer or IP implements a minimal functionality—a best-effort unicast datagram service, and end systems implement all other important functionality such as error, congestion, and flow control. Such a minimalist approach is one of the most important technical reasons for the Internet’s growth from a small research network into a global, commercial infrastructure with heteroge-
Manuscript received September 1, 2001; revised May 2002x. This work was supported in part by Defense Advanced Research Projects Agency (DARPA) under Contract F30602-99-1-0518, by the National Science Foundation (NSF) under Grant Career Award NCR-9624979 ANI-9730105, and by ITR Awards ANI-0085920 and ANI-9814929. Additional support was provided by Intel. Views and conclusions contained in this document are those of the authors and should not be interpreted as representing the official policies, either expressed or implied, of DARPA, NSF, Intel, or the U.S. Government. The authors are with Carnegie Mellon University, Pittsburgh, PA 15213 USA (e-mail:
[email protected];
[email protected];
[email protected];
[email protected]). Digital Object Identifier 10.1109/JSAC.2002.803066.
neous technologies, applications, and administrative authorities. The growth of this network has in turn unleashed the development of new applications, which require richer network functionality. The key architectural question is: what new features should be added to the IP layer? Multicast and quality-of-service (QoS) are the two most important features that have been or are being added to the IP layer. While QoS functionality cannot be provided by end systems alone and, thus, has to be supported at the IP layer, this is not the case for multicast. In particular, it is possible for end systems to implement multicast services on top of the IP unicast service. In deciding whether to implement multicast services at the IP layer or at end systems, there are two conflicting considerations that we need to reconcile. According to the end-to-end arguments [18], a functionality should be 1) pushed to higher layers if possible; unless 2) implementing it at the lower layer can achieve large performance benefits that outweigh the cost of additional complexity at the lower layer. In his seminal work in 1989 [5], Deering argues that this second consideration should prevail and multicast should be implemented at the IP layer. This view has been widely accepted so far. IP multicast is the first significant feature that has been added to the IP layer since its original design and most routers today implement IP multicast. Despite this, IP multicast has several drawbacks that have so far prevented the service from being widely deployed. First, IP multicast requires routers to maintain per group state, which not only violates the “stateless” architectural principle of the original design, but also introduces high complexity and serious scaling constraints at the IP layer. Second, IP multicast is a best effort service, and attempts to conform to the traditional separation of routing and transport that has worked well in the unicast context. However, providing higher level features such as reliability, congestion control, flow control, and security has been shown to be more difficult than in the unicast case. Finally, IP multicast calls for changes at the infrastructural level, and this slows down the pace of deployment. In this paper, we revisit the issue of whether multicast related functionality should be implemented at the IP layer or at the end systems. In particular, we consider a model in which multicast related features, such as group membership, multicast routing and packet duplication, are implemented at end systems, assuming only unicast IP service. We call the scheme End System Multicast. Here, end systems participating in the multicast group communicate via an overlay structure. The structure is an overlay in the sense that each of its edges corresponds to a unicast path between two end systems in the underlying Internet. We believe that End System Multicast has the potential to address most problems associated with IP multicast. Since all packets are transmitted as unicast packets, deployment may be
0733-8716/02$17.00 © 2002 IEEE
CHU et al.: CASE FOR END SYSTEM MULTICAST
1457
Fig. 1. Example to illustrate naive unicast, IP multicast, and End System Multicast.
accelerated. End System Multicast maintains the stateless nature of the network by requiring end systems, which subscribe only to a small number of groups, to perform additional complex processing for any given group. In addition, we believe that solutions for supporting higher layer features such as error, flow, and congestion control can be significantly simplified by leveraging well understood unicast solutions for these problems, and by exploiting application specific intelligence. While End System Multicast has many advantages, several issues need to be resolved before it become a practical alternative to IP multicast, In particular, an overlay approach to multicast, however efficient, cannot perform as well as IP multicast. It is impossible to completely prevent multiple overlay edges from traversing the same physical link and, thus, some redundant traffic on physical links is unavoidable. Further, communication between end systems involves traversing other end systems, potentially increasing latency. We present an example to illustrate these points in Section II. In this paper, we focus on two fundamental questions pertaining to the End System Multicast architecture: 1) what are the performance implications of using an overlay architecture for multicast? and 2) how do end systems with limited topological information cooperate to construct good overlay structures? In this paper, we seek to answer these questions in the context of a protocol that we have developed called Narada. Narada constructs an overlay structure among participating end systems in a self-organizing and fully distributed manner. Narada is robust to the failure of end systems and to dynamic changes in group membership. End systems gather information of network path characteristics using passive monitoring and active measurements. Narada continually refines the overlay structure as more network information is available. We present details of Narada’s design in Section III. We have conducted a detailed evaluation of the End System Multicast architecture in the context of the Narada protocol using simulation and Internet experiments. Our evaluation considers both application and network level metrics as discussed in Section IV. Our Internet experiments are conducted on a wide-area test-bed of about twenty hosts as described in Section V. The results indicate that End System Multicast can achieve bandwidth performance comparable to IP multicast, while at the same time achieving mean receiver latencies that are about 1.3–1.5 times latencies seen with IP multicast. Results from our simulation experiments, presented in Section VI are consistent with our Internet results and indicate that the promise of the End System Multicast architecture extends to medium sized groups of hundreds of members. For example, for groups
of 128 members, the average receiver delay with Narada is about 2.2–2.8 times the average receiver delay with IP multicast, while the network resources consumed by Narada is about twice that of IP multicast. Overall our results demonstrate that End System Multicast is a promising architecture for enabling small and medium sized group communication applications on the Internet. II. END SYSTEM MULTICAST We illustrate the differences between IP multicast, naive unicast, and End System Multicast using Fig. 1. Fig. 1(a) depicts an and are routers, while example physical topology, where , , , and are end systems. Link delays are as indicated. – represents a costly transcontinental link, while all other links are cheaper local links. Further, let us assume wishes to send data to all other nodes. Fig. 1(b) depicts naive unicast transmission. Naive unicast results in significant redundancy on links near the source (for carries three copies of a transmission by example, link – ), and results in duplicate copies on costly links (for example, – has two copies of a transmission by ). link Fig. 1(c) depicts the IP multicast tree constructed by DVMRP [5]. DVMRP is the classical IP multicast protocol, where data is delivered from the source to recipients using an IP multicast tree composed of the unicast paths from each recipient to the source. Redundant transmission is avoided, and exactly one copy of the packet traverses any given physical link. Each recipient receives data with the same delay as though were sending to it directly by unicast. Fig. 1(d) depicts an “intelligent” overlay tree that may be constructed using the End System Multicast architecture. The number of redundant copies of data near the source is reduced compared with naive unicast, and just one copy of the packet – . Yet, this goes across the costly transcontinental link efficiency over naive unicast based schemes has been obtained with absolutely no change to routers, and all intelligence is implemented at the end systems. However, while intelligently constructed overlay trees can result in much better performance than naive unicast solutions, they still cannot perform as well as solutions with native IP multicast support. For example, in Fig. 1(d), carries a redundant copy of data transmission, while link – the delay from source to receiver has increased. Given that End System Multicast tries to push functionality to the edges, there are two very different ways this can be achieved: peer-to-peer architectures and proxy-based architectures. In a peer-to-peer architecture, functionality is pushed to the end hosts actually participating in the multicast group.
1458
IEEE JOURNAL ON SELECTED AREAS IN COMMUNICATIONS, VOL. 20, NO. 8, OCTOBER 2002
Such architectures are thus completely distributed with each end host maintaining state only for those groups it is actually participating in. In a proxy-based architecture on the other hand, an organization that provides value added services deploys proxies at strategic locations on the Internet. End hosts attach themselves to proxies near them, and receive data using plain unicast, or any available multicast media. While these architectures have important differences, fundamental to both of them are concerns regarding the performance penalty involved in disseminating data using overlays as compared with solutions that have native multicast support. Thus, an end system in our paper refers to the entity that actually takes part in a self-organization protocol, and could be an end host or a proxy. Our evaluation of End System Multicast targets a wide range of group communication applications such as audio and video conferencing, virtual classroom and multiparty network games. Such applications typically involve small (tens of members) and medium sized (hundreds of members) groups. While End System Multicast may be relevant even for applications which involve much larger group sizes such as broadcasting and content distribution—particularly in the context of proxy-based architectures—such applications are outside the focus of this paper. We defer a detailed discussion to Section VII. III. NARADA DESIGN In this section, we present Narada, a protocol we designed that implements End System Multicast. In designing Narada, we had the following objectives in mind. Self-Organizing: The construction of the end system overlay must take place in a fully distributed fashion and must be robust to dynamic changes in group membership. Overlay Efficiency: The tree constructed must be efficient both from the network and the application perspective. From the network perspective, the constructed overlay must ensure that redundant transmission on physical links is kept minimal. However, different applications may require overlays with different notions of efficiency. While interactive applications like audio conferencing and group messaging require low latencies, applications like video conferencing simultaneously require high bandwidth and low latencies. Self-Improving: The overlay construction must include mechanisms by which end systems gather network information in a scalable fashion. The protocol must allow for the overlay to incrementally evolve into a better structure as more information becomes available. Adaptive to Network Dynamics: The overlay must adapt to long-term variations in Internet path characteristics (such as bandwidth and latency), while being resilient to inaccuracies inherent in the measurement of these quantities. The intuitive approach to constructing overlay spanning trees is to construct them directly—that is, members explicitly select their parents from among the members they know [10]. Narada, however, constructs trees in a two-step process. First, it constructs a richer connected graph that we term a mesh, and tries to ensure that the mesh has desirable performance properties that are discussed later. In the second step, Narada constructs spanning trees of the mesh, each tree rooted at the corresponding
Fig. 2. Example to illustrate the mesh-based approach in Narada.
source using well known routing algorithms. Fig. 2 presents an example mesh that Narada constructs for the physical topology shown in Fig. 1(a), along with a spanning tree rooted at . This mesh-based approach is motivated by the need to support multisource applications. Single shared trees are susceptible to a central point of failure, and are not optimized for an individual source. Explicitly constructing multiple overlay trees, one tree for each source is a possible design alternative but needs to deal with the overhead of maintaining and optimizing multiple overlays. In contrast, meshes allow us to construct trees optimized for the individual source, yet allow us to abstract out group management functions at the mesh level rather than replicating them across multiple trees. Further, we may leverage standard routing algorithms for construction of data delivery trees. In our approach, trees for data delivery are constructed entirely from the overlay links present in the mesh. Hence, it becomes important to construct a good mesh so that good quality trees may be produced. A good mesh has two properties. First, the quality of the path between any pair of members is comparable to the quality of the unicast path between that pair of members. Second, each member has a limited number of neighbors in the mesh. By path qualities, we refer to the metrics of interest for the application, such as delay and bandwidth. Limiting the number of neighbors in the mesh controls the overhead of running routing algorithms on the mesh. We explain the distributed algorithms that Narada uses to construct and maintain the mesh in Section III-A. We present mechanisms Narada uses to improve mesh quality in Section III-B. Narada runs a variant of standard distance vector algorithms on top of the mesh and uses well known algorithms to construct per-source (reverse) shortest path spanning trees for data delivery. We discuss this in Section III-C. While the Narada framework is generic and is applicable to a range of applications, it may be customized to meet the requirements of a specific application. We discuss this in Section III-D with the example of conferencing applications. A. Group Management In this subsection, we present distributed heuristics Narada uses to keep the mesh connected, to incorporate new members into the mesh and to repair possible partitions that may be caused by members leaving the group or by member failure. As we do not wish to rely on a single nonfailing entity to keep track of group membership, the burden of group maintenance is shared jointly by all members. To achieve a high degree of robustness, our approach is to have every member maintain a list of all other members in the group. Since Narada is targeted toward medium sized groups, maintaining the complete group membership list is not a major overhead. Every member’s list needs to be updated when a new member joins or an existing member leaves. The challenge is to disseminate changes
CHU et al.: CASE FOR END SYSTEM MULTICAST
1459
Fig. 4. A sample overlay topology. Fig. 3. Actions taken by a member member j .
i
on receiving a refresh message from
in group membership efficiently, especially in the absence of a multicast service provided by the lower layer. We tackle this by exploiting the mesh to propagate such information. However, this strategy is complicated by the fact that the mesh might itself become partitioned when a member leaves. To handle this, we require that each member periodically generate a refresh message with monotonically increasing sequence number, which is disseminated along the mesh. Each member keeps track of the following information for every other member in the group: that knows 1) member address ; 2) last sequence number has issued; and 3) local time at when first received information that issued . If member has not received an update time, then, assumes that is either dead from member for or potentially partitioned from . Member then initiates a set of actions to determine the existence of a partition and repair it if present as discussed in Section III-A3. Propagation of refresh messages from every member along the mesh could potentially be quite expensive. Instead, we require that each member periodically exchange its knowledge of group membership with its neighbors in the mesh. A message from member to a neighbor contains a list of entries, one entry for each member that knows is part of the group. Each entry has the following fields: 1) member address and 2) last that knows has issued. On receiving sequence number a message from a neighbor , member updates its table according to the pseudo code presented in Fig. 3. Finally, given that a distance vector routing algorithm is run on top of the mesh (Section III-C), routing update messages exchanged between neighbors can include member sequence number information with minimum extra overhead. 1) Member Join: When a member wishes to join a group, Narada assumes that the member is able to get a list of group members by an out-of-band bootstrap mechanism. The list needs neither be complete nor accurate, but must contain at least one currently active group member. In this paper, we do not address the issue of the bootstrap mechanism. We believe that such a mechanism is application specific and our protocol is able to accommodate different ways of obtaining the bootstrap information. The joining member randomly selects a few group members from the list available to it and sends them messages requesting to be added as a neighbor. It repeats the process until it gets a response from some member, when it has successfully joined the group. Having joined, the member then starts exchanging refresh messages with its neighbors. The mechanisms described earlier will ensure that the newly joined member and the rest of the group learn about each other quickly. 2) Member Leave and Failure: When a member leaves a group, it notifies its neighbors, and this information is propagated to the rest of the group members along the mesh. In Sec-
tion III-C, we will describe our enhancement to distance vector routing that requires a leaving member to continue forwarding packets for some time to minimize transient packet loss. We also need to consider the difficult case of abrupt failure. In such a case, failure should be detected locally and propagated to the rest of the group. In this paper, we assume a fail-stop failure model [20], which means that once a member dies, it remains in that state, and the fact that the member is dead is detectable by other members. We explain the actions taken on member death with respect to Fig. 4. This example depicts the mesh between group members at a given point in time. Assume that member dies. Its neighbors in the mesh, , , stop receiving refresh messages from . Each of them independently send redundant probe messages to , such that the probability every probe message (or its reply) is lost is very small. If does not respond to any probe message, then, and assume to be dead and propagate this information throughout the mesh. Every member needs to retain entries in its group membership table for dead members. Otherwise, it is impossible to distinguish between a refresh announcing a new member and a refresh announcing stale information regarding a dead member. However, dead member information can be flushed after sufficient amount of time. 3) Repairing Mesh Partitions: It is possible that member failure can cause the mesh to become partitioned. For example, in Fig. 4, if member dies, the mesh becomes partitioned. In such a case, members must first detect the existence of a partition, and then repair it by adding at least one overlay link to reconnect the mesh. Members on each side of the partition stop receiving sequence number updates from members on the other . side. This condition is detected by a timeout of duration Each member maintains a queue of members that it has stopped receiving sequence number updates from for at least time. It runs a scheduling algorithm that periodically and probabilistically deletes a member from the head of the queue. The deleted member is probed and it is either determined to be dead, or a link is added to it. The scheduling algorithm is adjusted so that no entry remains in the queue for more than a bounded period of time. Further, the probability value is chosen carefully so that in spite of several members simultaneously attempting to repair partition only a small number of new links are added. The algorithm is summarized in Fig. 5. B. Mesh Performance The constructed mesh can be quite suboptimal, because 1) initial neighbor selection by a member joining the group is random given limited availability of topology information at bootstrap; 2) partition repair might aggressively add edges that are essential for the moment but not useful in the long run; 3) group membership may change due to dynamic join and leave; and
1460
IEEE JOURNAL ON SELECTED AREAS IN COMMUNICATIONS, VOL. 20, NO. 8, OCTOBER 2002
Fig. 7. Algorithm that i uses to determine consensus cost to a neighbor j .
Fig. 5.
Scheduling algorithm used by member i to repair mesh partition.
Fig. 6. Example algorithm that i uses in determining utility of adding link to j , when latency is the main metric of interest.
4) underlying network conditions, routing and load may vary. Narada allows for incremental improvement of mesh quality by adding and dropping of overlay links. Members probe each other at random and new links may be added depending on the perceived gain in utility in doing so. Further, members continuously monitor the utility of existing links, and drop links perceived as not useful. This dynamic adding and dropping of links in the mesh distinguishes Narada from traditional routing protocols. The issue, then, is the design of a utility function that reflects mesh quality. A good-quality mesh must ensure that for any pair of members, there exists paths along the mesh which can provide performance comparable to the performance of the unicast path between the members. A member computes the utility gain if a link is added to member based on 1) the number of members to which improves the performance of and 2) how significant this improvement in performance is. The precise utility function depends on the performance metric (or metrics) that the overlay is being optimized for. Fig. 6 presents example pseudo code for a setting where latency is the primary metric of interest. The utility can take a maximum value of , where is the number of group members is aware of. Each member can contribute a maximum of one to the utility, the actual contribution being ’s relative decrease in delay to if the edge to were added. Narada adds and removes links from the mesh using the following heuristics.
Addition of Links: Every member periodically probes some random member that is not a neighbor, and evaluates the utility of adding a link to this member. When a member probes a member , returns to a copy of its routing table. uses this information to compute the expected gain in utility if a link to is added as described in Fig. 6. decides to add a link to if the expected utility gain exceeds a given threshold. The threshold is chosen to depend on the group size, and the number of neighbors and have in the mesh. Finally, there may be other metric-specific heuristics for link addition. For example, when the overlay is optimized for latency, may also add a link to if the physical delay between them is very low and the current overlay delay between them very high. Dropping of Links: Ideally, the loss in utility if a link were to be dropped must exactly equal the gain in utility if the same link were immediately readded. However, this requires estimating the relative degradation in performance to a member if a link were dropped and it is difficult to obtain such information. Instead, we overestimate the actual utility of a link by its cost. The cost of a link between and in ’s perception is the number of group members for which uses as next hop. Periodically, a member computes the consensus cost of its link to every neighbor using the algorithm shown in Fig. 7. It then picks the neighbor with lowest consensus cost and drops it if the consensus cost falls below a certain threshold. The threshold is again computed as a function of the member’s estimation of group size and its number of mesh neighbors. The consensus cost of a link represents the maximum of the cost of the link in each neighbor’s perception. Yet, it might be computed locally as the mesh runs a distance vector algorithm with path information. Our heuristics for link dropping have the following desirable properties. Stability: A link that Narada drops is unlikely to be added again immediately. This is ensured by several factors: 1) the threshold for dropping a link is less than or equal to the threshold for adding a link; 2) the utility of an existing link is overestimated by the cost metric; and 3) dropping of links is done considering the perception that both members have regarding link cost. Partition Avoidance: We present an informal argument as to why our link dropping algorithm does not cause a partition assuming steady state conditions and assuming multiple links are not dropped concurrently. Assume that member drops neighbor . This could result in at most two partitions. Assume and the size of ’s partition is . the size of ’s partition is Further, assume both and know all members currently in and is the size of the group. the group. Then, the sum of must be at least and must be at least Thus, , and at least one of these must exceed half the group size.
CHU et al.: CASE FOR END SYSTEM MULTICAST
As long as the drop threshold is lower than half the group size, the edge will not be dropped. Finally, we note that in situations where a partition of the mesh is caused (for example, due to multiple links being dropped simultaneously), our mechanisms for partition detection and repair described in Section III-A would handle the situation. C. Data Delivery Narada runs a distance vector protocol on top of the mesh. In order to avoid the well-known count-to-infinity problems, it employs a strategy similar to border gateway protocol (BGP) [17]. Each member not only maintains the routing cost to every other member, but also maintains the path that leads to such a cost. Further, routing updates between neighbors contains both the cost to the destination and the path that leads to such a cost. The per-source trees used for data delivery are constructed from the reverse shortest path between each recipient and the source, in identical fashion to DVMRP [5]. A member that receives a packet from source through a neighbor forward the packet is the next hop on the shortest path from to . only if forward the packet to all its neighbors who use Further, as the next hop to reach . The routing metric used in the distance vector protocol depends on the metrics for which the overlay is being optimized, which in turn depends on the particular application. We present an example in Section III-D. A consequence of running a routing algorithm for data delivery is that there could be packet loss during transient conditions when member routing tables have not yet converged. In particular, there could be packet loss when a member leaves the group or when a link is dropped for performance reasons. To avoid this, data continues to be forwarded along old routes for enough time until routing tables converge. To achieve this, we introduce a new routing cost called transient forward (TF). TF is guaranteed to be larger than the cost of a path with a valid route, that leaves adverbut smaller than infinite cost. A member tises a cost of TF for all members for which it had a valid route. Normal distance vector operations leads to members choosing (as TF is guaranteed to alternate valid routes not involving be larger than the cost of any valid route). The leaving member continues to forward packets until it is no longer used by any neighbor as a next hop to reach any member, or until a certain time period expires. D. Application-Specific Customizations A key feature of End System Multicast is that it enables application customizable solutions. In this section, we will study how we support an important, performance demanding class of applications—video conferencing—within the Narada framework. Conferencing applications require overlay trees simultaneously optimized for both latency and available bandwidth. Thus, this study allows us to illustrate how dynamic metrics like bandwidth and latency are dealt with in the Narada framework. These ideas may be applied to other applications as well. Conferencing applications deal with media streams that can tolerate loss through a degradation in application quality. This allows us to build a system that employs a hop-by-hop conges-
1461
tion control protocol. An overlay node adapts to a bandwidth mismatch between the upstream and downstream links by dropping packets. We use TFRC [7] as the underlying transport protocol on each overlay link. TFRC is rate-controlled UDP, and achieves TCP-friendly bandwidths. It does not suffer delays associated with TCP such as retransmission delays and queuing delays at the sender buffer. To construct overlay trees simultaneously optimized for bandwidth and latency, we have leveraged work done by Wang and Crowcroft [21] in the context of routing on multiple metrics in the Internet. A first choice is to use a single mixed routing metric which is a function of both bandwidth and latency. However, it is unclear how this function can individually reflect the bandwidth and latency requirements of the application. Instead, we use multiple routing metrics in the distance vector protocol, the latency between members and the available bandwidth. The routing protocol uses a variant of the shortest widest path algorithm presented in [21]. Every member tries to pick the widest (highest bandwidth) path to every other member. If there are multiple paths with the same bandwidth, the member picks the shortest (lowest latency) path among all these. We collect raw latency estimates of links in the mesh by having neighbors ping each other every 200 ms. Raw estimates of available bandwidth are obtained by passively monitoring data flow along the links. Both available bandwidth and latency are dynamic in nature, and using them as routing metrics leads to serious concerns of instability. We deal with the stability concerns using techniques in the design of the routing metrics described below. Latency: We filter raw estimates of the overlay link latency using an exponential smoothing algorithm. The advertised link latency is left unchanged until the smoothed estimate differs from the currently advertised latency by a significant amount. Available Bandwidth: We filter raw estimates of the available bandwidth of an overlay link using an exponential smoothing algorithm, to produce a smoothed estimate. Next, instead of using the smoothed estimate as a routing metric, we define discretized bandwidth levels. The smoothed estimate is rounded down to the nearest bandwidth level for routing purposes. Thus, a mesh link with a smoothed estimate of 600 kb/s may be advertised as having a bandwidth of 512 kb/s, in a system with levels corresponding to 512 and 1024 kb/s. To minimize possible oscillations when the smoothed estimate is close to a bandwidth level, we employ a simple hysteresis algorithm. Thus, while we move down a level immediately when the smoothed estimate falls below the current level, we move up a level only if the estimate significantly exceeds the bandwidth corresponding to the next level. Given that conferencing applications often have a bounded source rate, the largest level in the system is set to this maximum rate. Discretization of bandwidth and choice of a maximum bandwidth level ensure that all overlay links can fall in a small set of equivalence classes with regard to bandwidth. This discretized bandwidth metric not only enables greater stability in routing on the overlays, but also allows latency to become a determining factor when different links have similar but not identical bandwidth.
1462
IEEE JOURNAL ON SELECTED AREAS IN COMMUNICATIONS, VOL. 20, NO. 8, OCTOBER 2002
Our discussion so far has described how we incorporate bandwidth into the routing protocol, given a mesh that has been constructed. Incorporating bandwidth also requires changes to the heuristics used when a mesh link is added. When a member probes a member and has an estimate of the available bandwidth to , a modified version of the utility function presented in Fig. 6 that considers bandwidth is used to determine if a link to must be added. However, if does not have a bandwidth estimate to , it first determines the available bandwidth using active measurements involving transfer of data using the underlying transport protocol for several seconds, but at a rate bounded by the maximum source rate. To minimize the number of active measurements, conducts a probe to only if is seeing better application level performance than to the sources. We are currently investigating whether we can minimize active bandwidth measurements by using light-weight probing techniques such as round-trip time (RTT) probes and 10 kB data transfers. IV. EVALUATION The primary goal of our evaluation is to answer the following question: what performance penalty does an End System Multicast architecture suffer as compared with IP multicast with regard to both application and network level metrics? To answer this question, we compare the performance of a scheme for disseminating data under the IP multicast architectural framework, with the performance of various schemes for disseminating data under the End System Multicast framework. We have conducted our evaluation using both simulation and Internet experiments. Internet experiments help us understand how schemes for disseminating data behave in dynamic and unpredictable real-world environments, and give us an idea of the end-to-end performance seen by actual applications. On the other hand, simulations help analyze the scaling properties of the End System Multicast architecture with larger group sizes. Further, they help in understanding details of protocol behavior under controlled and repeatable settings. In the rest of this section, we present schemes that we compare for disseminating data, and our performance metrics. Sections V and VI present results for our Internet and simulation experiments. A. Schemes Compared We compare the following schemes for disseminating data in our simulation and Internet experiments. DVMRP: We assume that IP multicast involves constructing classical DVMRP like trees [5], composed of the reverse paths from the source to each receiver. Narada: This represents a scheme that constructs overlay trees in an informed manner, making use of network metrics like bandwidth and latency. It is indicative of the performance one may expect with an End System Multicast architecture, though an alternate protocol may potentially result in better performance. Random: This represents a naive scheme that constructs random but connected End System Multicast overlays.
Naive Unicast: Here, the source simultaneously unicasts data from the source to all receivers. Thus, in a group of size , the source must send duplicate copies of the same data. We note that the network metric considered in Narada impacts overlay performance. We have evaluated Narada-based schemes that consider: i) static delay based metrics such as propagation delay; ii) latency alone; iii) bandwidth alone; and iv) latency and bandwidth. We refer the reader to [3] for detailed results of this study. B. Performance Metrics To facilitate our comparison, we use several metrics that capture both application and network level performance. Latency: This metric measures the end-to-end delay from the source to the receivers, as seen by the application. Bandwidth: This metric measures the application level throughput at the receiver. Stress: We refer to the number of identical copies of a packet carried by a physical link as the stress of a physical link. For – and – have a stress of example, in Fig. 1(b), links 2 and 3, respectively, while in Fig. 1(d), link – has a stress of 1. In general, we would like to keep the stress on all links as low as possible. Resource Usage: We define resource usage as , where, is the number of links active in data transmission, is the delay of link , and is the stress of link . The resource usage is a metric of the network resources consumed in the process of data delivery to all receivers. Implicit here is the assumption that links with higher delay tend to be associated with higher cost. The resource usage is 30 in the case of transmission by DVMRP, 57 for naive unicast, and 32 for the smarter tree, shown in Fig. 1(c), (b), and (d), respectively. Finally, we compute the normalized resource usage (NRU) of a scheme as the ratio of the resource usage with that scheme relative to the resource usage with DVMRP. Protocol Overhead: This metric is defined as the ratio of the total bytes of nondata traffic that enters the network to the total bytes of data traffic that enters the network. The overhead includes control traffic required to keep the overlay connected, and the probe traffic and active bandwidth measurements involved in the self-organization process. Latency and bandwidth are application level performance metrics, while all other metrics measure network costs. Not all applications care about both latency and bandwidth. Our evaluation, thus, considers the needs of applications with more stringent requirements (such as conferencing), which require both high bandwidth and low latencies. An architecture that can support such applications well can potentially also support applications that care about latency, or bandwidth alone. C. Issues in Measuring Performance Metrics Our Internet and simulation evaluation presents several issues that we discuss. 1) Internet Evaluation: The limited deployment of IP multicast in the real world makes it difficult to evaluate application level performance using this architecture. Instead, we approximate this by the sequential unicast test. Here, we measure the bandwidth and latency of the unicast path from the
CHU et al.: CASE FOR END SYSTEM MULTICAST
source to each recipient independently (in the absence of other recipients). The above technique provides an indication of the performance that applications would see with IP multicast using DVMRP-like trees. While DVMRP actually results in trees composed of unicast paths from the receiver to the source (reverse-path forwarding), we do not expect this to affect our comparison results. We compute the resource usage with DVMRP by deriving the physical links of the tree, as well as the delays of these links, by doing a traceroute from the source to each receiver. Our Internet experiments currently do not measure stress. Measuring this metric requires an accurate knowledge of the physical paths between all pairs of members. In our Internet experiments, the latency metric includes the propagation and queuing delays of individual overlay links, as well as queuing delay and processing overhead at end systems along the path. We ideally wish to measure the latency of each individual data packet. However, issues associated with time synchronization of hosts and clock skew adds noise to our measurements of one-way delay that is difficult to quantify. Therefore, we choose to estimate the RTT. By RTT, we refer to the time it takes for a packet to move from the source to a recipient along a set of overlay links, and back to the source, using the same set of overlay links but in reverse order. Thus, the RTT of an overlay path S–A–R is the time taken to traverse S–A–R–A–S. The RTT measurements include all delays associated with one way latencies, and are ideally twice the end-to-end delay. 2) Simulation Evaluation: Our simulation experiments are conducted using a locally written, packet-level, event-based simulator. The simulator assumes shortest delay routing between any two members. The simulator models the propagation delay of physical links but does not model bandwidth, queuing delay and packet losses. This was done for two reasons. First, it is difficult to model Internet dynamics in a reasonable way in a simulator. Second, modeling of cross-traffic potentially restricts the scalability of our simulations. Given these restrictions, not all metrics have been evaluated in our simulations. In particular, we do not consider the bandwidth between members. Second, we assume that delays between members remains constant, and the latency metric is used in a more static sense. Finally, the protocol overhead metric in our simulations does not consider the overhead involved in members discovering bandwidth to each other.
1463
receiver sees. Although the set of hosts and source transmission rate are identical, a particular scheme may create a different overlay layout for each experimental run. While an individual host may observe vastly different performance across the runs, this does not imply that the various overlays are of any different quality. Therefore, we need metrics that capture the performance of the overlay tree as a whole. Let us consider how we summarize an experiment with regard to a particular metric such as bandwidth or latency. For a set of receivers, we sort the average metric value of the various receivers in ascending order, and assign a rank to each receiver from 1 to . The worst performing receiver is assigned a rank of 1 and the best performing receiver is assigned a rank of . For every rank , we gather the results for the receiver with rank across all experiments, and compute the mean. Note that the receiver corresponding to a rank could vary from experiment to experiment. For example, the result for rank 1 represents the performance that the worst performing receiver would receive on average in any experiment. V. INTERNET EVALUATION Our Internet experiments are conducted on a wide-area testbed with about 20 hosts, including a machine behind ADSL, and hosts in Asia and Europe. Our evaluation is conducted with our implementation of Narada that has been customized to conferencing applications, as described in Section III-D. An important factor that affects the performance of a scheme for disseminating data is the degree of heterogeneity in the environment we consider. To study the performance of schemes in environments with different degrees of heterogeneity, we create two groupings of hosts, the primary set and the extended set. The extended set includes all hosts in our testbed, while the primary set consists of a subset of hosts located at university sites in North America which are in general well connected to each other. There is greater variation in bandwidth and latencies of paths between nodes in the extended set as compared with the primary set. We begin by presenting our experimental methodology. We then present results in a typical experiment run in Section V-B. Section V-C provides a detailed comparison of various schemes for constructing overlays with regard to application level performance, and Section V-D presents results related to network costs.
D. Summarizing Performance of Schemes The objective of our evaluation is to evaluate and compare the performance of various schemes for disseminating data with respect to each of the performance metrics listed in Section IV-B. For a metric such as resource usage, it is easy to summarize the performance of a scheme. However, it is much more difficult to summarize the latency and bandwidth performance that a number of different hosts observe with a particular scheme. One approach is to present the mean bandwidth and latency, averaged across all receivers. Indeed, we do use this technique in Sections V-B and VI-C. However, this does not give us an idea of the distribution of performance across different receivers. A simple approach to summarizing an experiment is to explicitly specify the bandwidth and latencies that each individual
A. Evaluation Methodology The varying nature of Internet performance influences the relative results of experiments done at different times. Characteristics may change at any time and affect the performance of various experiments differently. Ideally, we should test all schemes for disseminating data concurrently, so that they may observe the exact same network conditions. However, this is not possible, as the simultaneously operating schemes would interfere with each other. Therefore, we adopt the following strategy: 1) we interleave experiments with the various protocol schemes that we compare to eliminate biases due to changes that occur at shorter time scales and 2) we run the same experiment at different times of the day to eliminate biases due to changes that
1464
Fig. 8.
IEEE JOURNAL ON SELECTED AREAS IN COMMUNICATIONS, VOL. 20, NO. 8, OCTOBER 2002
Mean bandwidth averaged over all receivers as a function of time.
occur at a longer time scale. We aggregate the results obtained from several runs that have been conducted over a two week period. Every individual experiment is conducted in the following fashion. All members join the group at approximately the same time. The source multicasts data at a constant rate and after four minutes, bandwidth and RTT measurements are collected. We vary the source rate to study dependence of results we see on the source rate. Each experiment lasts for 20 min. We adopt the above setup for all schemes, except sequential unicast. As described in Section IV-C, we approximate the performance of sequential unicast by determining the bandwidth and latency information of the unicast path from the source to each receiver. We do this by unicasting data from the source to each receiver for two minutes in sequence. B. Results With a Typical Run The results in this subsection give us an idea of the dynamic nature of overlay construction, and how the quality of the overlay varies with time. Our experiment was conducted on a weekday afternoon, using the primary set of machines and at a source rate of 1.2 Mb/s. The source host is at the University of California, Santa Barbara (UCSB). Fig. 8 plots the mean bandwidth seen by a receiver, averaged across all receivers, as a function of time. Each vertical line denotes a change in the overlay tree for the source UCSB. We observe that it takes about 150 s for the overlay to improve, and for the hosts to start receiving good bandwidth. After about 150 s, and for most of the session from this time on, the mean bandwidth observed by a receiver is practically the source rate. This indicates that all receivers get nearly the full source rate throughout the session. Fig. 9 plots the mean RTT to a receiver, averaged across all receivers as a function of time. The mean RTT is about 100 ms after about 150 s, and remains lower than this value almost throughout the session. Figs. 8 and 9 show that in the first few minutes of the session, the overlay makes many topology changes at very frequent intervals. As members gather more network information, the quality of the overlay improves over time, and there are fewer topology changes. In most of our runs, we find that the overlay
Fig. 9.
Mean RTT averaged over all receivers as a function of time.
converges to a reasonably stable structure after about four minutes. Given this, we gather bandwidth and RTT statistics after four minutes for the rest of our experiments. The figures above also highlight the adaptive nature of our scheme. We note that there is a visible dip in bandwidth, and a sharp peak in RTT at around 460 s. An analysis of our logs indicates that this was because of congestion on a link in the overlay tree. The overlay is able to adapt by making a set of topology changes, as indicated by the vertical lines immediately following the dip, and recovers in about 40 s. We have also evaluated how the RTTs to individual receivers vary during a session and results are presented in [3]. For all receivers, over 94% of the RTT estimates are less than 200 ms, while over 98% of the RTT estimates are less than 400 ms. C. Application Level Performance We present our results that compare the performance of various schemes for disseminating data on the Internet in various environments. We present results for two settings: 1) the primary set and a source rate of 1.2 Mb/s and 2) the extended set and a source rate of 2.4 Mb/s. Most pairs of hosts in the primary set can sustain throughputs of 1.2 Mb/s and, thus, the first scenario represents a relatively less heterogeneous environment where simpler schemes could potentially work reasonably well. On the other hand, the extended set represents an environment with a much higher degree of heterogeneity. Increasing the source rates to 2.4 Mb/s stresses the schemes more, because many Internet paths even between well connected university machines cannot sustain this rate. Further, several hosts in our testbed are located behind 10 Mb/s connections, and a poorly constructed overlay can result in congestion near the host. 1) Primary Set at 1.2-Mb/s Source Rate: Fig. 10 plots the mean bandwidth against rank for three different schemes. Each curve corresponds to one scheme, and each point in the curve corresponds to the mean bandwidth that a machine of that rank receives with a particular scheme, averaged across all runs. The error bars show the standard deviation. Thus, they do not indicate confidence in the mean, rather they imply the degree of variability in performance that a particular scheme for constructing overlays may involve. For example, the worst performing machine (rank 1) with the Random scheme receives a bandwidth
CHU et al.: CASE FOR END SYSTEM MULTICAST
1465
Fig. 10. Mean bandwidth versus rank at 1.2-Mb/s source rate for the primary set of machines.
Fig. 12. Mean bandwidth versus rank at 2.4-Mb/s source rate for the extended set of machines.
Fig. 11. Mean RTT versus rank at 1.2-Mb/s source rate for the primary set of machines.
Fig. 13. Mean RTT versus rank at 2.4-Mb/s source rate for the extended set of machines.
of a little lower than 600 kb/s on average. We use this method of presenting data in all our comparison results.1 We wish to make several observations. First, the sequential unicast curve indicates that all but one machine get close to the source rate, as indicated by one of the top lines with a dip at rank 1. Second, Narada is comparable to sequential unicast. It is able to ensure that even the worst-performing machine in any run receives 1150 kb/s on average. Interestingly, Narada results in much better performance for the worst performing machine as compared with sequential unicast. It turns out this is because of the existence of pathologies in Internet routing. It has been observed that Internet routing is suboptimal and there often exists alternate paths between end system that have better bandwidth and latency properties than the default paths [19]. Third, Narada results in consistently good performance, as indicated by the small standard deviations. Fourth, the Random scheme is suboptimal in bandwidth. On average, the worst performing machine with the Random scheme (rank 1) gets a mean bandwidth of about 600 kb/s. Further, the performance of Random can be quite variable as indicated by the large standard deviation. We believe that this poor performance with Random is because of the inherent variability in Internet path characteristics, even in relatively well connected settings. Fig. 11 plots mean RTT against rank for the same set of experiments. First, the RTT of the unicast paths from the source to the recipients can be up to about 150 ms, as indicated by the lowest line corresponding to sequential unicast. Second, 1The
curves are slightly offset from each other for clarity of presentation.
Narada is good at optimizing the overlay for delay. The worst machine in any run has an RTT of about 160 ms on average. Third, Random performs considerably worse with an RTT of about 350 ms for the worst machine on average. Random can have poor latencies because of suboptimal overlay topologies that may involve crisscrossing the continent. In addition, Random is unable to avoid delays related to congestion, particularly near the participating end hosts. 2) Extended Set at 2.4-Mb/s Source Rate: We stress our scheme for constructing overlays by considering extremely heterogeneous environments as represented by the extended set. Given the poor performance of Random even in relatively less heterogeneous settings, we do not present results here. Figs. 12 and 13 plot the bandwidth and RTT against host ranks for the four schemes of interest. The sequential unicast curves show that there are quite a few members that have low bandwidth and high latencies from the source, which indicates the heterogeneity in the set we consider. Even in such a heterogeneous setting, Narada is able to achieve a performance close to the sequential unicast. Apart from the less well-connected hosts (ranks 1–5), all other members get bandwidths of at least 1.8 Mb/s, and see RTTs of less than 250 ms on average. For ranks 1–5, Narada is able to exploit Internet routing pathologies and provide better performance than sequential unicast. A particularly striking example is two machines in Taiwan, only one of which has good performance to machines in North America. In our runs, the machine with poorer performance is able to achieve significantly better performance by connecting to the other machine in Taiwan.
1466
IEEE JOURNAL ON SELECTED AREAS IN COMMUNICATIONS, VOL. 20, NO. 8, OCTOBER 2002
TABLE I AVERAGE NORMALIZED RESOURCE USAGE OF DIFFERENT SCHEMES
TABLE II AVERAGE OVERHEAD WITH NARADA AND A BREAKDOWN OF THE OVERHEAD
that contribute to the overhead. We find that the average overhead is between 10% to 15% across all settings. This is an indication that even simple heuristics that we have implemented can keep the overall overhead low. Further, more than 90% of the overhead is due to members probing each other for bandwidth. Other sources of overhead contribute just 3%–7% of the overhead. These include exchange of routing messages between neighbors, group management algorithms to keep the overlay connected, and probes to determine the delay and routing state of remote members. Our current work is investigating the use of light-weight probing techniques to further reduce the overhead due to bandwidth measurements. VI. SIMULATION
3) Choice of Network Metrics: In addition to the schemes listed here, we have evaluated other schemes for constructing overlays in [3]. Overall our results indicate that it is important to explicitly optimize for both latency and bandwidth while supporting applications such as conferencing. Considering latency alone, or bandwidth alone leads to degraded performance. Further, the performance with static delay based metrics such as propagation delay is poor. The reader is referred to [3] for further details. D. Network Level Metrics Table I compares the mean normalized resource usage (Section IV-B) of the overlay trees produced by the various schemes for different environments and source rates. The values are normalized with respect to the resource usage with DVMRP. Thus, we would like the normalized resource usage to be as small as possible, with a value of 1.00 representing an overlay tree that has the same resource usage as DVMRP. The trees constructed by Narada can change over time—we consider the final tree produced at the end of an experiment. However, we observe that the overlays produced by these schemes are reasonably stable after about four minutes. We note from Table I that Narada can result in trees that make 30%–50% more use of resources than DVMRP. Further, Naive unicast trees which have all recipients rooted at the source, and schemes such as Random that do not explicitly exploit network information have a high resource usage. We have also determined the resource usage of Min-Span, the minimum spanning tree of the complete graph of all members, computed by estimating the delays of all links of the complete graph. Minimum spanning trees are known to be optimal with respect to resource usage, and as Table I shows, have lower resource usage than DVMRP. This indicates that an End System Multicast architecture can indeed make as efficient, if not better use of network resources than IP multicast. However, while minimum spanning trees are efficient from the network perspective, it is not clear that they perform well from the application perspective. Table II summarizes the protocol overhead (Section IV-B) involved in Narada, along with a breakdown of the main factors
Section V demonstrates that an End System Multicast architecture can perform quite well in realistic Internet settings. In this section, we study the performance issues with larger group sizes using simulation experiments. We begin by presenting factors that affect the evaluation. We then present our simulation setup and our results. A. Factors Affecting Performance A key factor that affects our comparison results is the topology model used in our simulations. We used three different models to generate backbone topologies for our simulation. For each model of the backbone, we modeled members as being attached directly to the backbone topology. Each member was attached to a random router, and was assigned a random delay of 1–4 ms. Waxman: The model considers a set of vertices on a square in the plane and places an edge between two points with a prob, where is the length of the longest posability of sible edge, is a random variable between 0 and , and and are parameters. We use the Georgia Tech. [22] random graph generators to generate topologies of this model. Mapnet: Backbone connectivity and delay are modeled after actual ISP backbones that could span multiple continents. Connectivity information is obtained from the CAIDA Mapnet project database [9]. Link delays are assigned based on geographical distance between nodes. Autonomous System Map (ASMap): Backbone connectivity information is modeled after inter-domain Internet connectivity. This information is collected by a route server from BGP routing tables of multiple geographically distributed routers with BGP connections to the server [8]. This data has been analyzed in [6] and has been shown to satisfy certain power laws. Random link delays of 8–12 ms was assigned to each physical link. In our simulations, we used backbone topology sizes consisting of around 1070 members and multicast groups of up to 256 members. We used a Waxman topology consisting of 1024 routers and 3145 links, an ASMap topology consisting of 1024 routers and 3037 links and a Mapnet topology consisting of 1070 routers and 3170 links. We have also studied the impact of varying topology size for each topology model in [4]. With Narada, each member in the data delivery tree has a degree that is dynamically configured based on the available bandwidth near a member. If a member has too many children,
CHU et al.: CASE FOR END SYSTEM MULTICAST
1467
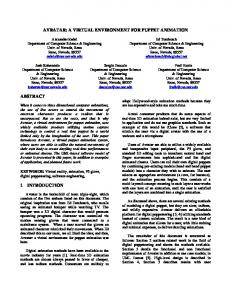
Fig. 14. Number of physical links with a given stress versus stress for naive unicast, Narada, and DVMRP.
Fig. 15. Worst case physical link stress versus group size for topologies for three models using Narada.
this could result in congestion near the member and a decrease in the available bandwidth. Narada can adapt dynamically to such a situation by detecting the fall in bandwidth and having children move away. However, given that our simulator does not consider Internet dynamics, we model the impact of this artificially by imposing restrictions on the degree. We do this using a parameter called the fanout range. The fanout range of a member is the minimum and maximum number of neighbors each member strives to maintain in the mesh. An increase of the fanout range could decrease mesh diameter and result in better delay performance. However, it could potentially result in higher stress on links near members. All results presented here assume a fanout range of 3–6 . We have investigated the impact of varying fanout range and the reader is referred to [4] for more details.
of physical links with a given stress. The stress of any physical link is at most one for DVMRP, indicated by a solitary dot. Under both naive unicast and Narada, most links have a small stress—this is to be expected. However, the significance lies in the tail of the plots. Under naive unicast, one link has a stress of 127 and quite a few links have a stress above 16. This is unsurprising considering that links near the source are likely to experience high stress. Narada, however, distributes the stress more evenly across physical links, and no physical link has a stress larger than nine. While this is high compared with DVMRP, it is a 14-fold improvement over naive unicast. Fig. 15 plots the variation of worst case physical link stress against group size for three topologies with Narada. Each curve corresponds to one topology model. Each point corresponds to the mean worst case stress for a particular group size, averaged over 25 experiments, and plotted with 95% confidence intervals. We observe that the curves are close to each other for small group sizes but seem to diverge for larger group sizes. Further, for all topologies, worst case stress increases with group size. Thus, for a group size of 64, mean worst case stress is about 5–7 across the three topologies, while for a group size of 256, it is about 8–14. We believe this increase of stress with group size is an artifact of the small topologies in a simulation environment relative to the actual Internet backbone. The reader is referred to [4] for a further discussion. Finally, we have also evaluated stress with Random. Our results indicate that Random tends to result in slightly higher stress than Narada across all topology models, and we omit the results for clarity. 2) Delay Results: Fig. 16 plots the mean delay experienced by a receiver using Random, Narada and DVMRP, as a function of group size for three different topology models. Each curve corresponds to a particular scheme, and a particular topology model. Each point represents the mean receiver delay for that group size averaged over 25 experiments, plotted with 95% confidence intervals. For example, the mean receiver delay with Narada using the ASMap topology is about 50 ms for a group size of 16. The curves are bunched into three families: the topmost set of curves correspond to Random, the lowest set corresponds to DVMRP and the set in between corresponds to Narada. For a range of group sizes and all topology models, Narada outperforms Random, but does not do as well as DVMRP. For
B. Simulation Setup All experiments we report here are conducted in the following manner. A fixed number of members join the group in the first 100 s of the simulation in random sequence. A member that joins is assumed to contain a list of all members that joined the group previously. After 100 s, there is no further change in group membership. One sender is chosen at random to multicast data at a constant rate. We allow the simulation to run for 40 min. In all experiments, neighbors exchange routing messages every 30 s. Each member probes one random group member every 10 s to evaluate performance. C. Simulation Results For all results in this section, we compute each data point by conducting 25 independent simulation experiments and we plot the mean with 95% confidence intervals. Due to space constraints, we present plots of selected experiments and summarize results of other experiments. 1) Stress: To get a better understanding of the stress metric, we consider the performance seen in a typical experiment conducted using a topology generated by the Waxman model and a group size of 128 members. One of the members is picked as source at random, and we evaluate the stress of each physical link. We study the variation of physical link stress under Narada and compare the results we obtain with physical stress under DVMRP and naive unicast in Fig. 14. Here, the horizontal axis represents stress and the vertical axis represents the number
1468
IEEE JOURNAL ON SELECTED AREAS IN COMMUNICATIONS, VOL. 20, NO. 8, OCTOBER 2002
Fig. 16. Mean receiver delay with Narada, Random, and DVMRP as a function of group size for three topology models. The curves are bunched into three families depending on the scheme used. Within each family, the legend indicates the performance for a particular topology model.
Mapnet and ASMap topologies and observe similar trends. For all topologies, the NRU is at most 1.9 for a group size of 128. 4) Protocol Overhead: In our simulations experiments, protocol overhead does not measure the cost of bandwidth probes, which we found as the chief source of overhead in our Internet results. Thus, this metric measures overhead mainly due to routing and group management associated with Narada. We find that the protocol overhead due to these factors increases linearly with group size, however, this is not significant for the group sizes we consider. For a source data rate of 128 Kb/s, the protocol overhead is about 2% for a group size of 64 members, and 4% for a group size of 128 members. Finally, we note that the control traffic that Narada introduces is independent of source data rate and, thus, the protocol overhead is even lower for higher source rates. VII. DISCUSSION We begin by summarizing results from our simulation and Internet experiments and then discuss some open issues. A. Summary of Results
Fig. 17.
Effect of group size on NRU: Narada, Random, and Naive unicast.
example, for a group size of 16 members, the mean receiver delay with Random varies between 70–80 ms depending on the topology model, while the mean delay with Narada is between 40–55 ms, and the mean delay with DVMRP is around 25–30 ms. For all topology models, the mean delay with DVMRP is relatively independent of group size. However, the performance of both Narada and Random tends to degrade with larger group size. For a group size of 256 members, the mean delay with Narada is about 70–105 ms and about 150–170 ms for Random, depending on the topology model. 3) Resource Usage: Fig. 17 plots the NRU against group size for the Waxman model alone. The results are normalized with respect to IP multicast. The lowest curve corresponds to Narada, while the two upper curves correspond to Random and Naive unicast respectively. First, Narada consumes less network resources than Naive unicast and Random, across all group sizes. For a group size of 16, the NRU is about 1.3 for Narada, while the NRU is about 1.6 for Naive unicast and Random. Second, NRU tends to increase with group size for all schemes. For a group size of 128, the NRU for Narada is about 1.9 and 2.4 for Naive unicast and Random. While these results are reasonable, we believe the performance of Narada with regard to resource usage could be even more significant if members are clustered. We have repeated this study with the
Our key results are as follows. Application Level Performance: Our Internet results demonstrate that End System Multicast can meet the bandwidth requirements of applications and at the same time achieve low latencies. In Internet experiments with the primary set, all hosts sustain over 95% of the source rate and achieve latencies lower than 80 ms, with the extended set, the mean performance attained by each receiver is comparable to the performance of the unicast path from the source to that receiver. Our simulation results match these numbers, and indicate that the penalty in delay is low even for medium size groups. For a range of topology models, the ratio of the mean delay with Narada relative to the mean delay with DVMRP is less than 1.7 for groups of size 16, and less than 3.5 for groups of 256 members. Stress: Our simulation results demonstrate that Narada results in a low worst case stress for small group sizes. For example, for a group size of 16, the worst case stress is about five. While for larger group sizes, worst case stress may be higher, it is still much lower than unicast. For example, for a group of 128 members, Narada reduces worst case stress by a factor of 14 compared with unicast. Resource Usage: Our Internet results demonstrate that Narada may incur a resource usage that is about 30%–50% higher than with DVMRP, while it can improve resource usage by 30%–45% compared with naive unicast. Again, our simulation results are consistent with our Internet results, and indicate that the performance with respect to this metric is good even for medium sized groups. The resource usage is about 35%–55% higher than with DVMRP for group sizes of 16 members, and about a factor of two higher for group sizes of 128 members. Further, we believe that the performance in resource usage may be even better if we consider clustered group members. Protocol Overhead: Our Internet experiments demonstrate that Narada can have a protocol overhead of about 10%–15% for groups up to 20 members. Over 90% of this overhead is members probing each other for bandwidth. To reduce the cost
CHU et al.: CASE FOR END SYSTEM MULTICAST
of bandwidth probes further, we are currently exploring lightweight probing techniques based on RTT measurements, transfers of 10 kB data chunks and bottleneck bandwidth measurements. Our initial experience suggests that these light-weight probing techniques are promising and can be quite effective at controlling overhead. Our simulation experiments on the other hand do not involve bandwidth probes. Our results indicate that the overhead due to other factors (e.g., routing and group management) is not significant for the group sizes we consider. B. Open Issues Overall our results suggest that End System Multicast can achieve good performance for small and medium sized groups involving tens to hundreds of members. The question then is: can an End System Multicast architecture scale to support much larger group sizes? Based on our experience, we believe the following issues need to be addressed. As the group size increases, the number of overlay hops between any pair of members increases and, hence, the delay between them potentially increases (e.g., Fig. 16). A careful analysis that investigates fundamental performance limits of an overlay approach for large group sizes would provide valuable insight on the feasibility of the End System Multicast architecture for large scale interactive applications. While we have demonstrated that End System Multicast can ensure good application performance over longer time scales, we have not investigated performance of applications over shorter time scales. Events such as failure of members, members leaving the group, or network congestion can potentially result in poor transient performance, particularly for interactive applications. While this is an issue that must be investigated even for smaller groups, it could be a greater concern for larger group sizes, as they could encounter a much higher frequency of such events. A self-improving overlay approach incurs overhead due to active measurements, and takes time to converge into an efficient structure. As group size increases, it is not clear whether an End System Multicast approach can keep probe overhead low and construct efficient overlays quickly. While the above issues need to be addressed to determine the viability of an End System Multicast approach for larger group sizes, certain design decisions taken in the current version of the Narada protocol may prevent it from scaling to larger group sizes. In Narada, each member maintains information regarding all other group members. This is a deliberate design choice that has been motivated by two reasons. First, Narada does not rely on external nodes for normal protocol operation. While it does use an out-of-band mechanism for bootstrapping, failure of this mechanism prevents new members from joining the group, but existing group members may continue to communicate with each other. Second, Narada has been designed with the objective of reestablishing connectivity among participating group members even under failure modes involving the simultaneous death of a significant fraction of group members. While maintaining full group membership information helps to achieve these goals, it leads to the concern
1469
that the costs of maintaining such information may be prohibitively expensive for larger sized groups. In this paper, we have made minimal assumptions regarding support from network infrastructure, both in terms of the robustness properties of end systems, and the network information available for overlay construction. We believe that scalability can be achieved more easily by making additional assumptions about the composition of the end systems, the failure models of hosts and the availability of external mechanisms for collecting network information. We describe recent efforts in this direction in Section VIII. Further, we are currently exploring these issues in the context of proxy-based End System Multicast architectures. Such architectures consist of a set of more robust or stable nodes that are not likely to all fail with high probability. This can greatly simplify the design of self-organizing protocols, and enable more scalable solutions. In addition, proxies are assumed to be persistent with long-lived relationships among them. This reduces the need for active measurements in creating overlays and helps in quick instantiation of efficient overlays. VIII. RELATED WORK Since the initial proposal of End System Multicast [4], several other researchers have begun advocating an overlay based approach for multicast communication [2], [10], [13], [15]. Architecturally, proposals for overlay based multicast have primarily differed on whether they assume a peer-to-peer architecture, or a proxy (infrastructure) based architecture. Yoid [10] and ALMI [15] emphasize peer-to-peer settings. In contrast, Scattercast [2], and Overcast [13] argue for infrastructure support. We view both these architectures as interesting and plan to look at the challenges and constraints specific to each architecture in the future. Further, ALMI [15] advocates a completely centralized solution, and places all responsibility for group management, and overlay computation with a central controller. As the research community has begun to acknowledge the importance of overlay based architectures, self-organizing protocols for constructing overlays have emerged as an important field of study. Most of the earlier proposed protocols fall in two broad categories that we summarize below. Protocols like Yoid [10], BTP [11], and Overcast [13] construct trees directly—that is, members explicitly select their parents from among the members that they know. While Overcast targets single source broadcasting applications, and constructs trees rooted at the source, Yoid constructs a single shared tree for all sources. Narada and Gossamer [2] construct trees in a two-step process: they first construct efficient meshes among participating members, and in the second step construct spanning trees of the mesh using well-known routing algorithms. A mesh-based approach has been motivated by the need to support multisource applications, such as conferencing. Single shared trees are not optimized for the individual source and are susceptible to a central point of failure. An alternative to constructing shared trees is explicitly constructing multiple overlay trees, one tree for each source. However, this approach needs to deal with the overhead of maintaining and optimizing multiple overlays.
1470
IEEE JOURNAL ON SELECTED AREAS IN COMMUNICATIONS, VOL. 20, NO. 8, OCTOBER 2002
Recently, researchers have begun designing self-organizing protocols that can scale to very large group sizes. Again, these newer protocols have taken two different approaches. Delaunay Triangulations [14], CAN [16], and Bayuex [23] assign to members addresses from some abstract coordinate space, and neighbor mappings are based on these addresses. For example, CAN assigns logical addresses from cartesian coordinates on an -dimensional torus. [14] assigns points to a plane and determines neighbor mappings corresponding to the Delaunay triangulation of the set of points. Determining neighbor mappings based on member addresses enables routing of messages based on the addresses, and full-fledged routing protocols such as distance vector algorithms are not required. Each member needs to maintain knowledge about only a small subset of members enabling the protocols to scale better to larger group sizes. However, in contrast to tree and mesh-based approaches, these protocols impose rules on neighbor relationships that are dictated by addresses assigned to hosts rather than performance. This may involve a performance penalty in constructed overlays and could complicate dealing with dynamic metrics such as available bandwidth. The Nice project [1] and Kudos [12] achieve better scaling properties than Narada by organizing members into hierarchies of clusters. Kudos constructs a two level hierarchy with a Narada like protocol at each level of the hierarchy. Nice constructs a multilevel hierarchy, and does not involve use of a traditional routing protocol. A concern with hierarchy-based approaches is that they complicate group management, and need to rely on external nodes to simplify failure recovery. To our knowledge, ours is perhaps the first work that has conducted a detailed Internet evaluation to analyze the feasibility of an overlay based architecture. Our work has shown that it is important to dynamically adapt to bandwidth and latency [3], and we have incorporated techniques in Narada that help to achieve this goal. In contrast, most other works have considered delay based metrics, and not dealt with important issues pertaining to the dynamic nature of network metrics. IX. CONCLUSION We have made two contributions in this paper. First, we have shown that for small and medium sized multicast groups, it is feasible to use an end system overlay approach to efficiently support all multicast related functionality including membership management and packet replication. The shifting of multicast support from routers to end systems, while introducing some performance penalties, has the potential to address most problems associated with IP multicast. We have shown, with both simulation and Internet experiments, that the performance penalties are low in the case of small and medium sized groups. We believe that the potential benefits of transferring multicast functionality from end systems to routers significantly outweigh the performance penalty incurred. Second, we have proposed one of the first self-organizing and self-improving protocols that constructs an overlay network on top of a dynamic, unpredictable and heterogeneous Internet environment without relying on a native multicast medium. We
also believe this is among the first works that attempts to systematically evaluate the performance of a self-organizing overlay network protocol and the tradeoffs in using overlay networks. Further, we believe that the techniques and insights developed in this paper are applicable to overlay networks in contexts other than multicast. Our current work involves studying mechanisms that can ensure robust transient performance of applications in environments with highly dynamic group membership, and highly variable network characteristics. Further, while in this work we have made conservative assumptions regarding the composition of end systems and their failure modes, we are currently investigating how we may take advantage of proxy-based End System Multicast architectures. REFERENCES [1] S. Banerjee, B. Bhattacharjee, and S. Parthasarathy, “A protocol for scalable application layer multicast,” Univ. Maryland, College Park, MD, Tech. Rep. CS-TR 4278, July 2001. [2] Y. Chawathe, “Scattercast: An architecture for Internet broadcast distribution as an infrastructure service,” Ph.D. dissertation, Univ. California, Berkeley, CA, Fall 2000. [3] Y. Chu, S. G. Rao, S. Seshan, and H. Zhang, “Enabling conferencing applications on the Internet using an overlay multicast architecture,” in Proc. ACM SIGCOMM, Aug. 2001. [4] Y. Chu, S. G. Rao, and H. Zhang, “A case for End System Multicast,” in Proc. ACM Sigmetrics, June 2000. [5] S. Deering, “Multicast routing in internetworks and extended LANs,” in Proc. ACM SIGCOMM, Aug. 1988. [6] C. Faloutsos, M. Faloutsos, and P. Faloutsos, “On power-law relationships of the Internet topology,” in Proc. ACM SIGCOMM, Aug. 1999. [7] S. Floyd, M. Handley, J. Padhye, and J. Widmer, “Equation-based congestion control for unicast applications,” in Proc. ACM SIGCOMM, Aug. 2000. [8] National Laboratory for Applied Network Research. Routing data. [Online]. Available: http://moat.nlanr.net/Routing/rawdata/ [9] Cooperative Association for Internet Data Analysis. Mapnet project. [Online]. Available: http://www.caida.org/Tools/Mapnet/Data/ [10] P. Francis. (2000, Apr.) Yoid: Your own Internet distribution. [Online]. Available: http://www.aciri.org/yoid/ [11] D. A. Helder and S. Jamin, “End-host multicast communication using switch-tree protocols,” in Proc. Workshop on Global and Peer-to-Peer Computing on Large Scale Distributed Systems (GP2PC), May 2002. [12] S. Jain, R. Mahajan, D. Wetherall, G. Borriello, and S. D. Gribble, “Scalable self-organizing overlays,” University of Washington, Seattle, Tech. Rep. UW-CSE 02-02-02, Feb. 2002. [13] J. Jannotti, D. Gifford, K. L. Johnson, M. F. Kaashoek, and J. W. O’Toole, Jr., “Overcast: Reliable multicasting with an overlay network,” in Proc. 4th Symp. Operating System Design and Implementation (OSDI), Oct. 2000. [14] J. Liebeherr and M. Nahas, “Application-layer multicast with Delaunay triangulations,” in Proc. IEEE GLOBECOM, Nov. 2001. [15] D. Pendarakis, S. Shi, D. Verma, and M. Waldvogel, “ALMI: An application level multicast infrastructure,” in Proc. 3rd Usenix Symp. Internet Technologies & Systems (USITS), Mar. 2001. [16] S. Ratnasamy, M. Handley, R. Karp, and S. Shenker, “Application-level multicast using content-addressable networks,” in Proc. NGC, 2001. [17] Y. Rekhter and T. Li, “A border gateway protocol 4 (BGP-4),”, RFC 1771, Mar. 1995. [18] J. Saltzer, D. Reed, and D. Clark, “End-to-end arguments in system design,” ACM Trans. Comput. Syst., vol. 2, pp. 195–206, 1984. [19] S. Savage, A. Collins, E. Hoffman, J. Snell, and T. Anderson, “The end-to-end effects of Internet path selection,” in Proc. ACM SIGCOMM, Aug. 1999. [20] F. B. Schneider, “Byzantine generals in action: Implementing fail-stop processors,” ACM Trans. Comput. Syst., vol. 2, pp. 145–154, 1984. [21] Z. Wang and J. Crowcroft, “Bandwidth-delay based routing algorithms,” in Proc. IEEE GLOBECOM, Nov. 1995. [22] E. W. Zegura, K. L. Calvert, and S. Bhattacharjee, “How to model an internetwork,” in Proc. IEEE INFOCOM, Mar. 1996. [23] S. Q. Zhuang, B. Y. Zhao, A. D. Joseph, R. H. Katz, and J. D. Kubiatowicz, “Bayeux: An architecture for scalable and fault-tolerant wide-area data dissemination,” in Proc. NOSSDAV, Apr. 2001.
CHU et al.: CASE FOR END SYSTEM MULTICAST
Yang-hua Chu received the B.S. and M.Eng. degrees from the Massachusetts Institute of Technology, Cambridge, MA, in 1996 and 1997, respectively. He is working toward the Ph.D. degree in computer science from Carnegie Mellon University, Pittsburgh, PA. His research interests lie in overlay networks, with an emphasis on building systems and services that can be deployed on the Internet.
Sanjay G. Rao received the B.Tech. degree in computer science and engineering from the Indian Institute of Technology, Madras, in 1997, the M.S. degree in computer science, in 2000, and is working toward the Ph.D. degree at the School of Computer Science, Carnegie Mellon University, Pittsburgh, PA. His research interests include overlay network design, peer-to-peer networks and multicast, and other technologies that enable efficient group communication over the Internet.
1471
Srinivasan Seshan received the Ph.D. degree from the Computer Science Department, University of California, Berkeley, in 1995. He is currently an Assistant Professor in the Computer Science Department, Carnegie Mellon University, Pittsburgh, PA. From 1995 to 2000, he was a Research Staff Member at IBM’s T.J. Watson Research Center, Yorktown Heights, NY. His primary interests are in the broad areas of network protocols and distributed network applications. In the past, he has worked on topics such as transport/routing protocol interactions with wireless networks, fast protocol stack implementations, RAID system design, performance prediction for Internet transfers, firewall design, and improvements to the TCP protocol. His current work includes overlay network design, Web server benchmarking, mobile computing/networking, and new approaches to congestion control.
Hui Zhang (M’95) received the B.S. degree in computer science from Peking University, Beijing, China, in 1988, the M.S. degree in computer engineering from Rensselaer Polytechnic Institute, Troy, NY, in 1989, and the Ph.D. degree in computer science from the University of California, Berkeley, in 1993. He is the Chief Technical Officer of Turin Networks, Petaluma, CA, and the Finmeccanica Associate Professor at the School of Computer Science, Carnegie Mellon University, Pittsburgh, PA. His research interests are in Internet, QoS, multicast, peer-to-peer systems, and metro networks. Dr. Zhang received the National Science Foundation CAREER Award in 1996 and the Alfred Sloan Fellowship in 2000.