A Case Study in Database Reliability: Component Types, Usage Profiles, and Testing C. A. Taylor
M. S. Gittens
A. V. Miranskyy
IBM Canada Ltd.
IBM Canada Ltd.
Department of Applied Mathematics
[email protected]
[email protected]
University of Western Ontario
[email protected]
relationships between: DBMS component types; DBMS usage profiles; DBMS component size; DBMS component changes; DBMS component usage; and DBMS defect yield.
ABSTRACT Data management lies at the core of most modern information technology deployments. Accordingly, the reliability of the database management system (DBMS) is critical to the reputation and success of both its vendors and their clients. However, there is a dearth of work in the literature focused on the reliability of the DBMS. More specifically, research is yet to be focused on the variables that influence DBMS reliability and the relationships between these variables.
The DBMS usage profiles studied are similar to the operational profiles proposed by Musa. However, DBMS usage profiles are particular to the individual industrial context. We recognize that it is important that we be able to extend our findings to other database management systems. Accordingly, we consider a DBMS component set comprised of only fundamental DBMS components that should be present in any enterprise relational DBMS.
We present an initial case study focused on the relationships between component type, usage profiles, component size, component changes, component usage, and defect yield. The system under study is a distributed enterprise relational DBMS.
We present this case study as an analysis of our perceptions. In Section 2, we discuss related work. The database under study is described in Section 3. In Section 4, we define relevant terms. Our initial perceptions and the associated analysis done to test these perceptions make up Section 5. Finally, Section 6 presents our conclusions and outlines future work.
Categories and Subject Descriptors D.2.4 [Software Engineering]: Software/Program – reliability, validation. H.2.m [Database Management]: Miscellaneous.
2. RELATED WORK Research is scarce in the area of DBMS reliability. All of the related work that we found acknowledges the need for DBMS testing. The majority of studies deal with the implementation of test tooling to solve a particular problem. Only two papers consider the relationships between variables that influence DBMS reliability.
General Terms Measurement, Reliability, Verification.
Keywords Database management system, testing, usage profiles, case study.
[2], [5], and [14] are focused on test tooling. They each deal with the solution to a different interesting problem in the DBMS testing domain but none consider the general problem of DBMS reliability. Wu et al. also look at DBMS testing in [16]. The need for test-centric usage profiles is implied in the problem definition but a profile-based presentation is not used. The paper’s result is highly specialized.
1. INTRODUCTION Database management systems tend to be complex evolving software systems. This makes assuring the reliability of a database management system (DBMS) hard. Software reliability engineering (SRE) quantifies the variables that influence reliability in operational profiles which are the tasks that a system is expected to perform and their respective probabilities of occurrence [12]. We are interested in quantifying the variables that influence specifically DBMS reliability. The assignment of test effort is also relevant. Towards improved DBMS reliability and efficient assignment of DBMS testing effort, we explore the
Somewhat similar to our work is that of Gittens et al. in [7]. That paper looks at reliability measures and metrics in the context of a DBMS. However, it differs from ours with its focus on code coverage and field defects. Perhaps most similar to our work is Sullivan and Chillerage’s paper, “A comparison of software defects in database management systems and operating systems” [15]. Refreshingly, they do not attempt to over-generalize their results. However, the paper is a comparative study involving two system types and it also focuses on field defects.
Permission to make digital or hard copies of all or part of this work for personal or classroom use is granted without fee provided that copies are not made or distributed for profit or commercial advantage and that copies bear this notice and the full citation on the first page. To copy otherwise, or republish, to post on servers or to redistribute to lists, requires prior specific permission and/or a fee. DBTest’08, June 13, 2008, Vancouver, BC, Canada. Copyright 2008 ACM 978-1-60558-233-7/08/06…$5.00.
While papers focused on DBMS testing are few and far between, we are not aware of any work that explicitly considers DBMS
1
usage profiles. Our case study considers DBMS testing and usage profiles towards better DBMS reliability. Such a study is long overdue.
The set of development components is a reflection of two things: (1) the classification scheme used by our development team to categorize development artifacts and (2) the structure of our development organization. This set of components is particular to the DUT. Moreover, it is the unique consequence of the implementation. The cardinality of this set is 80. Like the set of architectural components, security-related components are not included.
3. DATABASE MANAGEMENT SYSTEM UNDER TEST The DBMS under test (DUT) and study is a distributed enterprise relational DBMS. It provides a set of features that is comparable to the feature sets offered by other vendors in the same market segment. It also supports multiple platforms. The DUT has more than 20 million lines of code. It has evolved over a period of more than 20 years and 10 major versions.
Both sets of components represent the same complete system. However, this paper does not address the degree to which the components of each set overlap.
The quality assurance cycle for the DUT includes the Function Test and System Test phases. The Function Test phase precedes the System Test phase and is focused on validating new and existing product feature specifications. System Test immediately follows Function Test. The focus of the System Test phase is ensuring the reliability of new product features deployed in integrated customer-like environments. The defects found in either test phase are entered and tracked using the same source change management system.
4. TERMS In this section, we define the terms required for our discussion.
4.1 Components We define a component as a discrete grouping of software system functionality. This grouping can be logical or physical. In this study, we considered two sets of components: the set of architectural components and the set of development components.
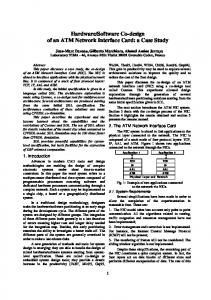
Figure 1. UML Component Diagram Depicting the Set of Architectural Components
Ramakrishnan and Gehrke define a simplified set of components that comprise a relational DBMS [13]. We started with this set and removed, combined, and added components to arrive at a set of components that represents the set of fundamental architectural components for a distributed enterprise relational DBMS.
4.2 Component Call Frequency Component call frequency measures the relative usage of a component within a component set. It is a measure of run time complexity. We define component call frequency as the number of times a particular component is used by a usage profile.
We removed the Commands – Web Forms component included in [13] because it is not fundamental to any DBMS architecture. The Database component was also removed. The DBMS – Query Evaluation Engine component was collapsed, combining its Plan Executor, Parser, Operator Evaluator, and Optimizer subcomponents. The DBMS – Buffer Manager and DBMS – Disk Space Manager subcomponents were also combined. To capture the distributed nature of a DBMS, we added the DBMS – Communication Manager component. This component is similar to the Data Communications Manager component introduced by Date in [4]. We also added the Utilities component. A utilities component makes sense for any enterprise DBMS. 1
4.3 Usage Profiles We define a usage profile as a capture of the run time behaviour of a software system for some interval of execution using some measure. In this study, the intervals correspond to two distinct but adjacent phases of our quality assurance cycle: Function Test and System Test. The measure used is component call frequency. The capture itself is a collection of components and their respective component call frequencies. We introduce two usage profiles: the Function Test (FT) Profile and the System Test (ST) Profile.
See Figure 1 for the resulting set of architectural components. This set of components corresponds to the generic relational DBMS architecture. The set of architectural components is depicted in the Unified Modeling Language (UML) format. The “DBMS –“ prefixes in component names have been removed.
1
In general, the FT Profile is a reflection of the DBMS as it was completely specified on the day the profile was compiled. This profile type is meant to capture a product’s behavioural specification. It is the first profile to be executed. The ST Profile is the second profile to be executed. It is a reflection of a complete DBMS with a subset of new features being exploited. This profile type is meant to capture real client usage.
A DBMS – Security component, though appropriate, was not included so as to not make any statements, implied or otherwise, as to the security of the product under study
2
4.4 Defects
5.1.3 Perception 3
We define the term defect according to our context. It is thereby defined as a variance from a desired product attribute. More concretely, we consider a defect to be a variance from the product specification or the product documentation found during the Function Test or System Test phases.
Past experience with the DUT suggests that for development components: (1) the FT Profile will have the larger total number of component call frequencies and (2) the ST Profile will have the greater component call frequency variability. It follows from (1), (2), and Perception 2 that we will find that the set of development components and the FT Profile lead to stronger positive correlations with number of defects than the set of development components and the ST Profile. We assume that differences between usage profiles in number of component call frequencies contribute more to total component call frequency than differences between component call variability.
4.5 Lines of Code The lines of code (LOC) measure of a component captures the size of the component. We reuse the LOC definition first provided by Jones in [9] and cited by Kan in [10]. That is, we define LOC as the number of source code instructions in a component, including data definitions, but excluding comments and prologues.
5.2 Analysis To test the initial perceptions outlined in Section 5.1, we calculated the linear correlation between number of defects and LOC, LOCC, and component call frequency. Both profile types were considered for each component type. In this section, we present the relationships between variables with contour plots and correlation tables.
4.6 Lines of Code Changed Lines of code changed (LOCC) captures the volume of changes made to a component. LOCC can be partially defined in terms of LOC. We partially define LOCC as the absolute difference in LOC for two different versions of the same component. We add to this definition that LOCC can also include the parts of a component that were neither added nor removed but changed from one version of the component to the next.
5.2.1 Contour Plots To better understand the relations between variables, we produced contour plots of number of defects versus pairs of explanatory variables: LOC and component call frequency; and LOCC and component call frequency; for each component type. Both usage profiles were considered. A tabular summary of correlations is provided for each component type in Section 5.2.1.3. The contour plots use logarithmic scales to deal with the spread of the data. We have also normalized the axes.
5. CASE STUDY We began this study by formulating our perceptions according to our own practical experiences and the knowledge of local domain experts. We present our initial perceptions in Section 5.1. Section 5.2 captures the analysis done to test our perceptions. Our analysis is based on defect, LOC, LOCC, and component call frequency data for a recent major release. The FT and ST Profiles used in our analysis were taken from the same major release.
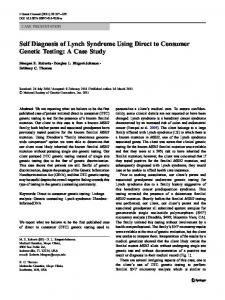
5.2.1.1 Development Components Figure 2 shows no apparent correlation between number of defects and variables LOC and component call frequency when the FT Profile is applied to the set of development components.
5.1 Initial Perceptions
ln(Call Frequency + 1)
In general, we expected to find that the largest numbers of defects belonged to large components with a large number of changes in the release under study. We also expected to find that the component type and usage profile with the highest average component call frequencies would have the strongest correlation with number of defects.
5.1.1 Perception 1 We will find positive correlations between number of defects and LOC, independent of component type and usage profile. Intuitively, the larger the component, the greater the likelihood that a defect has been injected during its development. There is literature to both support and oppose this belief [6]. However, research in this area has yet to be focused specifically on the DBMS.
1.0
1.0
0.9
0.8
0.8
0.6
0.7
0.4
0.6
0.2
0.5
0.0 0.6
0.7
0.8
0.9
1.0
ln(LOC + 1)
Figure 2. Number of Defects by LOC and Development Component Call Frequency for FT Profile
5.1.2 Perception 2 We will also find that the number of defects increases with component call frequency, independent of component type. Intuitively, the higher the component call frequency for a component and usage profile, the greater the test coverage provided for the component by the profile. This intuition is somewhat supported by Kit's assertion that the greater the test coverage, the greater the number of defects [11].
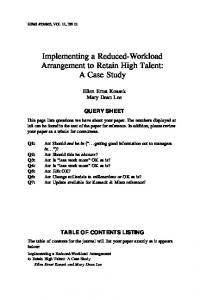
Like Figure 2, Figure 3 shows no apparent correlation between number of defects and LOCC and component call frequency when the FT Profile is applied to development components. Figure 4 shows no apparent correlation between number of defects and LOC and component call frequency when the ST Profile is applied to the set of development components.
3
1.0
1.0
0.9
0.8
0.8
0.6
0.7
variables in Section 5.2.2. The contour plots for architectural components are provided in the next section.
5.2.1.2 Architectural Components Figure 6 shows an apparent positive correlation between number of defects and variables LOC and component call frequency when the FT Profile is applied to the set of architectural components. The apparent relationship between variables shown in this figure supports Perceptions 1 and 2 to some degree. 1.0
0.4
0.6
ln(Call Frequency + 1)
ln(Call Frequency + 1)
Figure 5 appears similar to Figure 4. There is no apparent correlation between number of defects and LOCC and component call frequency for the ST Profile and development components.
0.2
0.5 0.3
0.5
0.7
0.9
ln(LOCC + 1)
Figure 3. Number of Defects by LOCC and Development Component Call Frequency for FT Profile ln(Call Frequency + 1)
1.0
0.9
0.8
0.8 0.6 0.7 0.4
0.6
0.2
1.0
0.6
0.8
0.8
0.2 0.0 0.7
0.8
0.9
1.0
Figure 4. Number of Defects by LOC and Development Component Call Frequency for ST Profile
1.0 ln(Call Frequency + 1)
1.0 0.8
0.8
0.6 0.6 0.4 0.4
0.2
0.2
1.0
Figure 8 shows the correlation between number of defects and LOC and component call frequency for the ST Profile and architectural components. We observe an apparent positive correlation that supports Perceptions 1 and 2 to some degree.
ln(LOC + 1)
1.0
0.9
Like Figure 6, Figure 7 shows an apparent positive correlation between number of defects and LOCC when the FT Profile is applied to architectural components. Accordingly, this figure also supports Perceptions 1 and 2 to some degree. We note that the correlation appears weaker for this plot than for the LOC plot (Figure 6).
0.4
0.6
0.8
Figure 6. Number of Defects by LOC and Architectural Component Call Frequency for FT Profile
0.6
0.4
0.7
ln(LOC + 1)
0.6
0.2
ln(Call Frequency + 1)
1.0
1.0
0.9
0.8
0.8 0.6 0.7 0.4
0.6
0.2
0.0 0.3
0.5
0.7
0.4
0.9
0.6
0.8
1.0
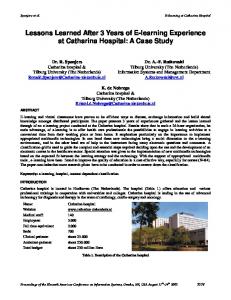
ln(LOCC + 1)
ln(LOCC + 1)
Figure 7. Number of Defects by LOCC and Architectural Component Call Frequency for FT Profile
Figure 5. Number of Defects by LOCC and Development Component Call Frequency for ST Profile
Figure 9 also shows an apparent positive correlation. The correlation is between number of defects and LOCC and component call frequency when the ST Profile is applied to architectural components. This figure supports Perceptions 1 and 2 to some degree.
Figures 2 through 5 did not obviously support any of our initial perceptions. This implied that further analysis of number of defects and the variables LOC, LOCC, and component call frequency was necessary for development components. Accordingly, we analyze the linear correlation between pairs of
4
Without correlation coefficients to compare degree, it is not clear to what degree each of the contour plots in this section support Perceptions 1 and 2. To clarify the degrees, we calculate and summarize correlation coefficients in the next section. ln(Call Frequency + 1)
1.0
Table 2. Summary of Linear Correlations Between Number of Defects and Explanatory Variables for Architectural Components
1.0
0.8
0.8 0.6
0.4 0.4
0.0 0.7
0.8
0.9
0.60
System Test
0.94
0.95
0.49
0.6
Table 3. Linear Correlations Between Variables for Development Components2
Figure 8. Number of Defects by LOC and Architectural Component Call Frequency for ST Profile ln(Call Frequency + 1)
0.95
0.8
ln(LOC + 1)
1.0
0.8
0.94
We analyze linear correlation tables to identify relations between pairs of variables, thereby further testing support for our initial perceptions. Table 3 shows the correlations between variables for development components after applying the logarithmic transformation ln(x + 1) to deal with the spread of the data and 0 input values. The correlations between variables for architectural components is shown in Table 4. For both tables, CCFFT is Component Call Frequency for the FT Profile; CCFST is Component Call Frequency for the ST Profile; and D is Number of Defects. We discard symmetrical values.
1.0
1.0
Function Test
5.2.2 Correlation Tables
0.2 0.6
LOC LOCC Component Call Frequency
Table 2 confirms support for Perceptions 1 and 2 for the FT Profile and architectural components. However, this support is only moderate. The table also shows that the apparent support for Perceptions 1 and 2 that we observed for the ST Profile in Section 5.2.1.2 is weak, at best.
0.6
0.2
Profile Type
0.6 0.4 0.4
0.2 0.0
LOCC LOC CCFFT CCFST D
0.2 0.4
0.6
0.8
1.0
ln(LOCC 1) ln(LOC ++1)
5.2.1.3 Summary Table 1 summarizes the linear correlations between number of defects and the explanatory variables: LOC, LOCC, and component call frequency; for the set of development components. The correlations for the set of architectural components are summarized in Table 2.
Function Test
0.81
0.89
0.38
System Test
0.81
0.89
0.43
CCFFT
CCFST
D
1 0.483035 0.469807 0.81361
1 0.820096 0.468769
1 0.427259
1
Table 4. Linear Correlations Between Pairs of Variables for Architectural Components
Table 1. Summary of Linear Correlations Between Number of Defects and Explanatory Variables for Development Components LOC LOCC Component Call Frequency
LOC
For the set of development components, we observe a strong positive correlation between number of defects and LOC which supports Perception 1. We also observe a stronger positive correlation between number of defects and LOCC. We note that LOC and LOCC are correlated, although they are not the focus of this study; and the component call frequencies of the FT and ST Profiles are also correlated.
Figure 9. Number of Defects by LOCC and Architectural Component Call Frequency for ST Profile
Profile Type
LOCC 1 0.863221 0.422667 0.385767 0.868822
LOCC LOC CCFFT CCFST D
Neither Perception 1 or 2 are supported by Table 1. The table also implies a lack of support for Perception 3. We note weak component call frequency correlation coefficients for both the FT and ST Profiles for development components. In fact, the ST Profile coefficient is the greater of the two, but the difference is small enough to deem support for Perception 3 inconclusive.
LOCC 1 0.956544 0.836234 0.89199 0.985423
LOC 1 0.935537 0.911675 0.928207
CCFFT
CCFST
D
1 0.852648 0.781096
1 0.871745
1
For the set of architectural components, we observe a strong positive correlation for each pair of variables. The correlation between number of defects and LOC supports Perception 1.
2
5
After ln(x + 1) transformation
Oregon, United States, August 21 - 24, 2000). M. J. Harold, Ed. ISSTA '00. ACM, New York, NY, 147-157.
Perception 2 is supported by the correlations between number of defects and each of FT Profile component call frequency and ST Profile component call frequency.
[3] Daskalantonakis, M. K. 1992. A Practical View of Software Measurement and Implementation Experiences Within Motorola. IEEE Trans. Softw. Eng. 18, 11 (Nov. 1992), 9981010.
6. CONCLUSION AND FUTURE WORK In general, architectural components appear to be more strongly correlated with number of defects than development components. The strongest correlation coefficients belong to the FT Profile and architectural components.
[4] Date, J. An Introduction to Database Systems. AddisonWesley, Reading, MA, 2000. [5] Deng, Y., Frankl, P., and Wang, J. 2004. Testing web database applications. SIGSOFT Softw. Eng. Notes 29, 5 (Sep. 2004), 1-10.
The perception that, in our context, there is a correlation between number of defects and LOC; and number of defects and LOCC; is supported by our case study. So is the perception that number of defects increases with component call frequency, to some degree.
[6] Fenton, N. E. and Ohlsson, N. 2000. Quantitative Analysis of Faults and Failures in a Complex Software System. IEEE Trans. Softw. Eng. 26, 8 (Aug. 2000), 797-814.
Perception 3 – the perception that development components and the FT Profile lead to higher positive correlations with number of defects than the ST Profile – is inconclusive. It appears that this perception holds somewhat but the correlation is weak and the coefficients for development components are similar to the coefficients for architectural components. More work is needed here.
[7] Gittens, M., Lutfiyya, H., Bauer, M., Godwin, D., Kim, Y. W., and Gupta, P. 2002. An empirical evaluation of system and regression testing. In Proceedings of the 2002 Conference of the Centre For Advanced Studies on Collaborative Research (Toronto, Ontario, Canada, September 30 - October 03, 2002). D. A. Stewart and J. H. Johnson, Eds. IBM Centre for Advanced Studies Conference. IBM Press, 3.
We observed that the explanatory variables LOC, LOCC, and component call frequency explain number of defects better for architectural components than development components. This implies that DBMS testing effort should be assigned to components as they interact and exist to satisfy requirements (architectural components), rather than their definition according to the teams that develop them (development components). This result may be particular to our context.
[8] Graves, T. L., Karr, A. F., Marron, J. S., and Siy, H. 2000. Predicting Fault Incidence Using Software Change History. IEEE Trans. Softw. Eng. 26, 7 (Jul. 2000), 653-661. [9] Jones, C. Programming Productivity. McGraw-Hill Companies, New York, NY, 1986. [10] Kan, S. Metrics and Models in Software Quality Engineering. Addison-Wesley, Boston, MA, 2005.
However, the observations that suggest that DBMS reliability activities such as defect estimation should target architecturalcomponent-based decompositions are not particular to our industrial context. This conclusion can be extended to any DBMS that implements the fundamental components depicted in Figure 1 and is both function tested and system tested.
[11] Kit, E. and Finzi, S. 1995 Software Testing in the Real World: Improving the Process. ACM Press/Addison-Wesley Publishing Co. [12] Musa, J. 1999. Developing More Reliable Software Faster and Cheaper. In Proceedings of the 5th International Conference on Engineering of Complex Computer Systems (October 18 - 22, 1999). ICECCS. IEEE Computer Society, Washington, DC, 180.
This paper considers one measure of run time complexity: component call frequency. The consideration of measures of static code complexity has been left to future work. Future work will also address the degree to which architectural components and development components overlap.
[13] Ramakrishnan, R. and Gehrke, J. Database Management Systems. McGraw-Hill, Boston, MA, 2000.
With this case study, we have enhanced our understanding of the relationships between: DBMS component types; DBMS usage profiles; DBMS component size; DBMS component changes; DBMS component usage; and DBMS defect yield. Our conclusions also form a meaningful initial contribution to studies in DBMS reliability.
[14] Suárez-Cabal, M. J. and Tuya, J. 2004. Using an SQL coverage measurement for testing database applications. SIGSOFT Softw. Eng. Notes 29, 6 (Nov. 2004), 253-262. [15] Sullivan, M., Chillarege, R. A comparison of software defects in database management systems and operating systems. Twenty-Second International Symposium on FaultTolerant Computing 8-10 (Jul. 1992), 475-484.
7. REFERENCES [1] Akima, H. 1996. Algorithm 761; scattered-data surface fitting that has the accuracy of a cubic polynomial. ACM Trans. Math. Softw. 22, 3 (Sep. 1996), 362-371.
[16] Wu, X., Wang, Y., and Zheng, Y. 2003. Privacy preserving database application testing. In Proceedings of the 2003 ACM Workshop on Privacy in the Electronic Society (Washington, DC). WPES '03. ACM, New York, NY, 118128.
[2] Chays, D., Dan, S., Frankl, P. G., Vokolos, F. I., and Weber, E. J. 2000. A framework for testing database applications. In Proceedings of the 2000 ACM SIGSOFT ISSTA (Portland,
The views expressed in this paper are those of the authors and not necessarily of IBM Canada Ltd. or IBM Corporation.
6