Proceedings of the 29th Annual International Conference of the IEEE EMBS Cité Internationale, Lyon, France August 23-26, 2007.
SuB02.6
A Classwise PCA-based Recognition of Neural Data for Brain-Computer Interfaces Koel Das, Sergey Osechinskiy, and Zoran Nenadic Abstract— We present a simple, computationally efficient recognition algorithm that can systematically extract useful information from any large-dimensional neural datasets. The technique is based on classwise Principal Component Analysis, which employs the distribution characteristics of each class to discard non-informative subspace. We propose a two-step procedure, comprising of removal of sparse non-informative subspace of the large-dimensional data, followed by a linear combination of the data in the remaining subspace to extract meaningful features for efficient classification. Our method produces significant improvement over the standard discriminant analysis based methods. The classification results are given for iEEG and EEG signals recorded from the human brain.
I. INTRODUCTION A brain-computer interface (BCI) is a communication link between the brain and an external device. A class of BCIs that are based solely on cognitive signals have received increased attention recently [1], [2]. These systems could be potentially useful for improving the quality of life of patients with locked in syndrome and other individuals with severe motor deficiencies. BCI typically consists of an assistive (external) device and a set of algorithms that enable the interaction of the brain and the device [3], [1]. BCIs can be classified into two categories: invasive and non-invasive. Non-invasive BCIs are typically realized by recording the neural activity from the surface of the scalp by means of electroencephalography (EEG) [1], [2] while invasive BCIs require implantation of recording electrodes through surgical procedure. In this article we will focus on both invasive and non-invasive BCIs, although the technique we develop can be potentially useful beyond BCI applications. The main function of a BCI system is to analyze neural patterns in real time and to utilize this information for communication with the external devices (e.g. computers or robots). To this end a training database is created, consisting of multiple records of neural signals, conditioned upon various cognitive classes (e.g. imagination of left vs. right hand movements [4]). Future (unknown) intentions are then decoded based on how well the corresponding neural signals match the class-conditional signals in the training database. EEG signals, commonly used in non-invasive BCI applications, are spatio-temporal and large-dimensional. Consequently, their analysis is hindered with two major obstacles.
Firstly, the dimension of data, n, by far exceeds the number of samples, nt , in the training database, giving rise to socalled small sample size conditions [5]. Under the small sample size conditions, the sample statistics of data can be extremely poor, if not meaningless. More specifically, the covariance matrices are highly singular. Secondly, largedimensional data necessarily translates to the curse of dimensionality, which presents challenges in handling and manipulation of statistical data. In particular the inversion and spectral decomposition of large matrices may not be feasible with standard computer architectures. For many BCI applications these challenges are tackled heuristically. For example, a common approach is to separate the processing in space and time [2], [4], without discussing explicitly the consequences of this space-time separability assumption. Furthermore, a vast majority of these studies utilizes the spectral power of EEG signals (e.g. µ-band or β band [2], [4]), as low-dimensional features of interest. While the power/frequency representation is physically intuitive, it is unclear why these ad hoc features should have optimal predictive power. Several studies [6], [7], [8] report significantly better decoding results with the use of other (more abstract) features. Another common strategy, often used in conjunction with the above, is to rank individual features (or recording electrodes) according to some criterion. The feature set is then constructed by concatenating a small number of features on the top of hierarchy. This approach, however, ignores the joint statistical properties of the features, which might result in suboptimal decoding performance. In this article, we present a computationally efficient, locally adaptable, classification technique. Our method does not assume space-time separability and it utilizes joint statistical properties of the features. The main idea behind our technique is to identify and discard a useless (noninformative) subspace in data. The recognition is then carried out in the residual space, where the small sample size conditions and the curse of dimensionality are no longer concerns. While our method was developed and tested on human EEG and intracranial EEG (iEEG) data, the technique is applicable to any large-dimensional spatio-temporal biomedical data, and in general to any large-dimensional statistical data. II. C LASSWISE P RINCIPAL C OMPONENT A NALYSIS
K. Das with the Department of Electrical Engineering and Computer Science, University of California, Irvine, CA 92697, USA
[email protected] S.Osechinskiy is with the Department of Biomedical Engineering, University of California, Irvine, CA 92697, USA
[email protected] Z. Nenadic is with the Department of Biomedical Engineering and the Department of Electrical Engineering and Computer Science, University of California, Irvine, CA 92697, USA
[email protected]
1-4244-0788-5/07/$20.00 ©2007 IEEE
Under the small sample size conditions, a large portion of the data space is sparse and carries very little or no useful information. To obtain meaningful data statistics, this irrelevant subspace must be discarded as noise, which is typically accomplished by global dimensionality reduction
6519
(A)
(B)
S
2
(C)
ω
2
ω2
ω
2
0
x*
x*
x* 0
S
x * 2
S
1
S
x1*
1
0 ω
ω1
ω
1
1
S
2
0
0
0
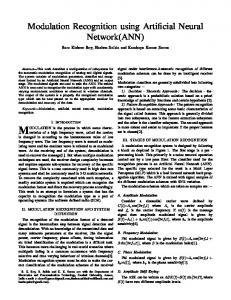
Fig. 1. (A) PCA (dashed) vs. cPCA subspace for 2-class case, where the classes ω1 and ω2 are represented as Gaussian contours.(B) Test data x∗ projected on reduced subspace S1 to produce test feature x1∗ . (C) x∗ projected on S2 to produce x2∗
techniques, such as Principal Component Analysis (PCA) or Independent Component Analysis (ICA). However, both PCA and ICA rely on statistical properties of the common data distribution, while the class-conditional statistics are ignored. Therefore, it can be argued that global dimensionality reduction techniques may be suboptimal for classification purposes. Large-dimensional data is commonly encountered in face (image) recognition problems, where Linear Discriminant Analysis (LDA) [5], and variants thereof [9], [10], have been successfully used. However, our experience with face recognition techniques applied to brain data were somewhat disappointing [7]. Motivated by these limitations, we proposed a modification of the direct LDA (DLDA) method [9], by introducing a threshold [7], whose role was to regularize the covariance matrix in a manner similar to the standard shrinkage approach [11]. However, the optimum value of the threshold was selected via internal cross-validation (CV), which rendered the method computationally expensive. Furthermore, LDA-based methods tend to overfit under the small sample size conditions giving error rates which are not generalizable. In this article we exploit the strength of PCA as a dimensionality reduction technique, while preserving the classspecific information to facilitate subsequent classification. Our technique is based on classwise PCA (cPCA) and results in a simple piecewise linear dimensionality reduction technique. Fig. 1 (A) illustrates the major difference between the classical PCA method and our technique, applied to a binary class case. In general, for c-class problems, our technique generates as many as c subspaces {S1 , S2 , · · · , Sc }, which approximate some nonlinear low-dimensional data manifold. Presumably, a data point from the class ωi is best represented in the local subspace Si , although this is not necessarily true and further tests are required (see Section II-B). On the other hand, PCA approximates data using a single low-dimensional subspace, and is ignorant of any class-specific information (e.g. curvature). The details of our algorithm will be given
for c = 2, and the extension to an arbitrary number of classes is straightforward. A. Feature Extraction Let ωi (i = 1, 2) denote two classes with means µi , and covariances Σi , and let x∗ ∈ Rn be unknown (test) data to be classified. In the first step, x∗ is represented in 2 subspaces, S1 and S2 (see Fig. 1), by means of the following transformation xi∗ = FiT (x∗ − µi ) n×m′i
i = 1, 2
(1)
where the columns of Fi ∈ R are taken as the basis vectors of Si . The two classes are transformed in a similar fashion [Fig. 1 (B)(C)]. In the simplest scenario, Fi = Vi , where Vi ∈ Rn×mi consists of the mi (mi to be chosen) principal components of the class ωi . To account for classes whose principal directions are nearly parallel, and hence the projections of the two classes to Si are highly overlapped, we propose to augment Fi with Vb ∈ Rn×1 , where Vb ∝ µ1 − µ2 . This step ensures that class differences arising from the two means are accounted for. For c-class cases, Vb readily generalizes to a basis spanned by the columns of the between-class-scatter matrix, commonly used in LDA applications [11]. To keep all projections orthogonal, the columns of Fi = [Vi |Vb ] are orthonormalized through the Gram-Schmidt procedure. While the above procedure typically yields Si of sufficiently low dimension (m′i ≪ n), where the size of data is no longer an obstacle, further improvements in terms of classification accuracy are possible with simple feature extraction techniques applied directly to the subspace Si . If linear feature extraction techniques are used (e.g. LDA), the mathematical formalism (1) remains the same, with mere modifications in the definition of Fi . More specifically, Fi = ′ [Vi |Vb ] Ti , where Ti ∈ Rmi ×m is the feature extraction matrix of the chosen method. In this article we use an informationtheoretic technique called Information Discriminant Analysis (IDA), whose advantages over LDA and similar techniques have been discussed at length in [12]. Unlike LDA, IDA
6520
has no constraints regarding the final dimension, m, of the feature space. However, BCI data is generally so sparse (small nt ) that the choice of m is severely limited. In our experience, working with 1 ≤ m ≤ 3, not only yields the best performance, but also provides a safeguard against overfitting [8], [7]. In summary, our feature extraction technique is a two-step procedure. In the first step, a large-dimensional and mostly sparse subspace of the original data space is discarded. In the second step, the remaining data is linearly combined into meaningful features for the purpose of classification. B. Classification Due to piecewise linear nature of our feature extraction method, the test data x∗ is represented in 2 feature subspaces [Fig. 1 (B)(C)]. To complete the feature extraction process, one of the subspaces must be eliminated. It turns out that this question can be solved within a classification framework, which is the ultimate goal of our technique. Therefore, the formal completion of the feature extraction process can be viewed as a bi-product of the classification process. For simplicity, we will assume that the classes are Gaussian with prior probabilities, P(ωi ). A straightforward application of the Bayes classifier at the first subspace yields P(ωi1 | x1∗ ) =
p(x1∗ | ωi1 )P(ωi ) p(x1∗ )
i = 1, 2
(2)
where p(x1∗ ) = ∑2i=1 p(x1∗ |ωi 1 ) P(ωi ), and P(ωi 1 | x1∗ ) are the posterior probabilities of the two classes in the first subspace. Since (1) is an affine transformation, both classes remain Gaussian, i.e. p( . | ωi 1 ) ∼ N (F1T (µi − µ1 ), F1T Σi F1 ). Based on the first subspace, x∗ is assigned to the class ωk with the maximum posterior probability k = arg max P(ωi 1 | x1∗ ) i=1, 2
Similarly, x∗ is transformed to the second subspace [see Fig. 1 (C)], and its class membership, ωl , is determined as follows: l = arg max P(ωi 2 | x2∗ ) i=1, 2
where P(ωi 2 | x2∗ ) =
p(x2∗ | ωi 2 ) P(ωi ) p(x2∗ )
i = 1, 2
and p(x2∗ ) is defined analogous to p(x1∗ ). Also note that p( . | ωi 2 ) ∼ N (F2T (µi − µ2 ), F2T Σi F2 ). Therefore, at each feature subspace, the test data, x∗ , can be associated with one of the classes. A final decision, x∗ ∈ ωg , is made by a direct comparison of the optimal class assignments per individual subspaces, i.e. g = arg max [P(ωk 1 | x1∗ ) P(ωl 2 | x2∗ )] k, l
III. EXPERIMENTAL RESULTS The performance of our method was tested on a set of iEEG data, adopted from Rizzuto et al. [6], and an EEG dataset recorded in our lab. A brief account of the iEEG experiments will be presented next. For more details, the reader is referred to [6], [8], [7]. The iEEG signals were recorded from the human brain during a standard memory reach task, consisting of 4 periods: fixation, target, delay, and reach. The appearance of a random target, either left or right of the fixation point, marked the onset of the target period. Once the target disappeared, the delay period started. The disappearance of the fixation target marked the onset of the reach period. The duration of each period was randomized and lasted between 1 and 1.3 s, and the total number of electrodes implanted in both hemispheres was 91. A total of 162 trials were recorded for each period. The signals were amplified, sampled at 200 Hz and band-pass filtered. The goal of our study is to predict the label of the trial (left vs. right) based on 1 s of data during target, delay and reach period. Note that data is a vector in 18200-dimensional space (n = 91 × 200). For the EEG experiments, a similar set-up was used, with 2 periods: fixation and target. The EEG signals were acquired using an EEG cap (Electro-Cap International, Eaton, OH) with 6 electrodes, and the signals were amplified, band-pass filtered and sampled at 200 Hz (Biopac Systems, Goleta, CA). The number of trials (left+right) was nt = 140 per session, and there were 3 such sessions. Our goal is to predict the label of the trial (left vs. right) based on 1 s of data during target period. The performance of our method was assessed through leave-one-out CV as explained below. A single trial (out of nt ) was selected for testing, and the remaining trials were designated for training. This procedure was repeated nt times, each time choosing a different sample as a test trial. Within a single fold of CV the following steps were performed: 1) cPCA was applied to the training data. Principal components with an eigenvalue smaller than 1% of the total variance (trace of the covariance matrix for each class), were discarded. This effectively determines Vi , and in turn mi (see Section II-A). The basis Vb was calculated, and the transformation matrix Fi = [Vi |Vb ] was found. 2) The training data was transformed according to (1), ′ and the feature extraction matrices, Ti ∈ Rmi ×1 , were obtained using IDA on each of the subspaces. This resulted in two 1-dimensional (1-D) feature subspaces. Note that the full transformation matrix can be formally written as Fi = [Vi |Vb ] Ti . 3) The testdata, x∗ , was transformed to the 2 feature subspaces, and its posteriors, P(ω ji | xi∗ ) (i, j = 1, 2), were calculated. Class membership was determined as per classification rule, explained in Section II-B The overall performance is estimated by dividing the number of correctly classified trials by nt . The performance of our method was compared to those
6521
of DLDA [9] and threshold-based DLDA methods [7]. All decoding results for DLDA and threshold-based DLDA were based on the quadratic classifier, and are comparable to our classification strategy (Section II-B). T HE PERFORMANCES (%)
TABLE I DLDA AND THRESHOLD - BASED
OF C PCA,
DLDA (T-B DLDA) FOR I EEG DATA , DURING target, delay AND reach PERIOD . (T OP ) U NCONSTRAINED , ( BOTTOM ) CONSTRAINED DATA . Period target delay reach target
delay
Time all all all 150:750 150:750 all all all
n 18200 18200 18200 10920 1920 3200 6400 9600
DLDA 70.37 58.02 66.05 72.22 86.42 83.95 85.80 65.43
T-B DLDA 72.22 58.64 66.05 80.25 87.06 87.65 92.59 71.60
cPCA+IDA 79.01 61.73 70.99 83.33 85.80 88.27 87.65 73.46
imaging of brain’s electrical activity (e.g. EEG, iEEG). We hypothesize that the technique will be a useful analysis tool for any large-dimensional biomedical data, and in general, for any data hindered with the small sample size conditions. Our current research efforts are directed toward the validation of our technique on a variety of large-dimensional recognition problems. The major weakness of our technique is that it does not scale favorably with the number of classes, c. In particular both the number of possible feature subspaces, and the dimension of the intermediate subspaces, Si , increase with c. However, this scaling is linear, as opposed to frequently used pairwise criteria [14], [15], which scale quadratically with c. Moreover, within a single subspace, our feature extraction is essentially linear, and reduces to simple matrix manipulations, which can be implemented efficiently. V. ACKNOWLEDGMENTS
T HE PERFORMANCES
TABLE II (%) OF C PCA, DLDA AND THRESHOLD - BASED
The authors would like to thank Daniel S. Rizzuto and Richard A. Andersen for providing iEEG data.
DLDA FOR EEG DATA , DURING target PERIOD Session 1 1 2 2 3 3
n 1200 180 1200 180 1200 180
Time all 100:250 all 100:250 all 100:250
DLDA 52.14 60.71 50.71 55.00 57.24 60.14
T-B DLDA 54.29 62.86 52.86 55.71 58.69 61.59
R EFERENCES
cPCA +IDA 75.71 90.00 62.14 82.14 75.35 90.58
The estimated classification rates for the iEEG and EEG datasets are shown in Tables I and II, respectively. Our cPCA-based classification method outperforms the other methods in almost all cases by a significant margin. In some cases, our method produces an improvement of around 50% over DLDA-based methods, using both unconstrained and constrained data. Usually the first 100 − 150 ms of the target period can be discarded due to visual processing delay [13]. Similarly, the electrodes can be constrained based on brain areas of interest. Various combinations of space time constraints have been reported in Tables I and II. In particular, with the EEG datasets, DLDA-based methods fail to capture the class information, yielding nearly chance-level classification rates, while our method produces significant improvement. Note that the features of our method have been limited to 1-D subspace. This constraint was imposed for comparison purposes, since LDA-based techniques operate on at most (c − 1)-D subspaces (c = 2 here). By allowing features of larger dimension (e.g. m = 2, 3), the classification rates of our technique were slightly better. The superior performance of our method can be attributed to the fact that LDA-based methods are susceptible to the noise, which explains their good performance on less noisy tasks, such as face recognition. IV. CONCLUSIONS AND FUTURE WORKS Using classwise PCA, we have developed a novel classification technique for large-dimensional data. The method is particularly suited for noisy measurements, arising in the
[1] G. Pfurtscheller, C. Neuper, G. R. Muller, B. Obermaier, G. Krausz, A. Schlogl, R. Scherer, B. Graimann, C. Keinrath, D. Skliris, G. Supp M. Wortz, and C. Schrank. Graz-BCI: State of the art and clinical applications. IEEE T. Neur. Sys. Reh., 11(2):177–180, 2003. [2] J. R. Wolpaw and D. J. McFarland. Control of a two-dimensional movement signal by a noninvasive brain-computer interface in humans. P. Natl. Acad. Sci. USA, 101(51):17849–17854, 2004. [3] J.R. Wolpaw, N. Birbaumer, D.J McFarland, G. Pfurtscheller, and T.M. Vaughan. Brain-computer interfaces for communication and control. Clin. Neurophysiol., 6(113):767–791, 2002. [4] G. Pfurtscheller, C. Neuper, D. Flotzinger, and M. Pregenzer. EEGbased discrimination between imagination of right and left hand movement. Electroen. Clin. Neuro., 103(6):642–651, 1997. [5] K. Fukunaga. Inroduction to Statistical Pattern Recognition. Academic Press, 1990. [6] D.S. Rizzuto, A.N. Mamelak, W.W. Sutherling, I. Fineman, and R.A. Andersen. Spatial selectivity in human ventrolateral prefrontal cortex. Nat. Neurosci., 8:415–417, 2005. [7] Koel Das, Joerg Meyer, and Zoran Nenadic. Analysis of large-scale brain data for brain-computer interfaces. In Proceedings of the 28th Annual International Conference of the IEEE Engineering in Medicine and Biology Society, pages 5731–5734, 2006. [8] Z. Nenadic, D.S. Rizzuto, R.A. Andersen, and J.W. Burdick. Advances in cognitive neural prosthesis: Recognition of neural data with an information-theoretic objective. In G. Dornhege, J.R. Millan, T. Hinterberger, D.J. McFarland, and K.-R. Muller, editors, Toward Brain Computer Interfacing, number ISBN: 9780262042444. The MIT Press, 2007. (in press). [9] H. Yu and H. Yang. A direct lda algorithm for high-dimensional data - with application to face recognition. Patter Recognition Letters, 34(10):2067–2070, 2001. [10] L.-F. Chen, H.-Y. Mark Liao, M.-T. Ko, J.-C. Lin, and G.-J. Yu. A new lda-based face recognition system which can solve the small sample size problem. Pattern Recognition, 33(10):1713–1726, 2000, Pages. [11] R. O. Duda, P. E. Hart, and D. G. Stork. Pattern Classification. WileyInterscience, 2001. [12] Zoran Nenadic. Information discriminant analysis: Feature extraction with an information-theoretic objective. IEEE T. Pattern Anal., 2007(in press). [13] S. Thorpe, D. Fize, and C. Marlot. Speed of processing in the human visual system. Nature, 381(6582):520–522, 1995. [14] M. Loog and R.P.W. Duin. Linear dimensionality reduction via a heteroscedastic extension of lda: the chernoff criterion. IEEE T. Pattern Anal., 26:732–739, 2004. [15] P. A. Devijver and J. Kittler. Pattern recognition: a statistical approach. Prentice Hall International, Englewood Cliffs, N.J., 1982.
6522