Jun 12, 2010 - methods, we introduce the cloud model and combine it with the item-based collaborative filtering recommendation algorithms. The.
2011, Vol.16 No.1, 016-020 Article ID 1007-1202(2011)01-0016-05 DOI 10.1007/s11859-011-0704-4
A Collaborative Filtering Recommendation Algorithm Based on Item and Cloud Model □ WANG Shuliang1,2, XIE Yuan1, FANG Meng1
0
Introduction
1. International School of Software, Wuhan University, Wuhan 430072, Hubei, China; 2. State Key Laboratory of Information Engineering in Survey, Mapping and Remote Sensing, Wuhan University, Wuhan 430072, Hubei, China © Wuhan University and Springer-Verlag Berlin Heidelberg 2011
Abstract: Recommender system is an important content in the research of E-commerce technology. Collaborative filtering recommendation algorithm has already been used successfully at recommender system. However, with the development of E-commerce, the difficulties of the extreme sparsity of user rating data have become more and more severe. Based on the traditional similarity measuring methods, we introduce the cloud model and combine it with the item-based collaborative filtering recommendation algorithms. The new collaborative filtering recommendation algorithm based on item and cloud model (IC-Based CF) computes the similarity degree between items by comparing the statistical characteristic of items. The experimental results show that this method can improve the performance of the present item-based collaborative filtering algorithm with extreme sparsity of data. Key words: recommendation system; collaborative filtering; cloud model; item similarity CLC number: TP 311
Received date: 2010-06-12 Foundation item: Supported by the National Basic Research Program of China (973 Program) (2006CB701305, 2007CB310804), the National Natural Science Foundation of China (60743001), Best National Thesis Fund (2005047), and the Natural Science Foundation of Hubei Province (CDB132, 2010j0049) Biography: WANG Shuliang, Ph. D., Professor, research directions: cloud model, spatial data mining and knowledge discovery. E-mail: slwang2005@whu. edu.cn
With the rapidly increasing amount of information in the networks, there is a serious need for a new technology to help people find what they want from a huge mass of data. Personality recommendation system emerges as the times requires, which is used to help users find information they are interested in. The provided personalized service is accepted by more and more E-commerce Web site, digital library and many other similar fields, and becomes one of the most important functions in these systems. At present, almost all large-scale e-commerce systems, such as Amazon, eBay, and taobao, use recommendation systems in a variety of modes. In order to generate accurate recommendation, several recommendation algorithms have been proposed, such as collaborative filtering recommendation algorithm[1], Bayesian network[2], cluster algorithm[3,4], association rules[5], and Horting based on graph-theoretic[6]. Among these recommendation algorithms, collaborative filtering is the most promising one, and it has been applied well in reality[7]. The recommendation system based on collaborative filtering was first proposed by Typestry[8]. In Typestry’s system, target users should clearly indicate similar users themselves. GroupLens[9] is an automatic collaborative filtering recommendation system based on users’ ratings, and is used to recommend films and news. Breese had a detailed discussion of various collaborative filtering recommendation algorithms and made an improvement[7]. The traditional collaborative filtering algorithm
17
WANG Shuliang et al : A Collaborative Filtering Recommendation Algorithm …
works by building a database of preferences for items by users. To find information that the target user may probably be interested in, we first discover the target user’s nearest neighbors, which are other users who have historically had similar taste to the target. Though collaborative filtering has been very successful in search, information filtering applications, and E-commerce applications, as the size of the systems increase, there is also a sharp increase in the number of users and items, the traditional nearest-neighbor collaborative filtering recommendation algorithms face the challenge of extreme sparsity of user rating data[8]. For example, E-commerce systems in reality often have large data sets, even active users may have purchased well under 1% of the items[9], therefore, the recommendation algorithm based on nearest-neighbor users is not only time-consuming but also leads to a sharp drop in the quality of recommendation results. To solve the difficulties of the extreme sparsity of user rating data, in this paper, we apply a different approach item and cloud-based collaborative filtering recommendation algorithm (IC-Based CF). The new algorithm computes similarity degree between items by a different similarity measuring methods based on cloud model. The experimental results show that the performance of the present item-based collaborative filtering algorithm is improved, even with extreme sparsity of data.
1 Collaborative Filtering Technology 1.1 Classification of Collaborative Filtering Recommendation Algorithm There are two reality-based hypotheses[9,10].One is that users having the similar preferences may be interested in the same. And the other is that users may be interested in the items that are similar with their previous likings. The first hypothesis focuses on the relationship between users, while the second focuses on the relationship between items. According to these two hypotheses, the collaborative filtering recommendation algorithm can be mainly categorized into two classes: user-based collaborative filtering recommendation algorithm[11] and item-based collaborative filtering recommendation algorithm[10]. The common and key step between user-based CF and item-based CF is the computation of similarity. The new CF in this paper is based on the item-based CF, so we take the item-based CF as an example to show the three most common similarity measuring methods. The similarity measuring method in user-based CF is similar.
1.2
Traditional Similarity Measuring Methods User rating data can be represented by matrix A(m, n). Here, m is the number of users, n is the number of items, and Rij denotes the rating of user ui on item j. There are mainly three ways to compute the similarity between items: cosine-based similarity, correlation-based similarity, and adjusted-cosine similarity. ① Cosine-based Similarity: In this case, two items are thought of as two vectors in the m dimensional user-space. Vector i denotes the ratings on item i and vector j denotes the ratings on item j. And similarity between items i and j, denoted by sim(i, j ) is given by ii j sim(i, j ) = cos(i , j ) = (1) i i j ② Correlation-based Similarity: In this case, similarity between two items i and j is measured by computing the Pearson-r correlation corrij . To make the correlation computation accurate we must isolate the co-rated cases. Let the set of users who both rated i and j be denoted by U, then the correlation similarity is given by sim(i, j ) = corrij =
∑
∑ u∈U
u∈U
( Ru ,i − Ri )( Ru , j − R j )
( Ru ,i − Ri ) 2
∑
u∈U
( Ru , j − R j ) 2
(2) ③ Adjusted Cosine Similarity: Computing similarity using basic cosine measure in item-based case has one important drawback—the differences in rating scale between different users are not taken into account. The adjusted cosine similarity offsets this drawback by subtracting the corresponding user average from each co-rated pair. Formally, the similarity between items i and j using this scheme is given by sim(i, j ) =
∑
∑
u∈U
( Ru ,i − Ru )( Ru , j − Ru )
( Ru ,i − Ru )2 u∈U
∑
( Ru , j − Ru )2 u∈U
(3)
Based on the above methods to compute similarity, we select one of them to get the most similar collection of items. 1.3 Analyzing of the Traditional Similarity Measuring Methods At present, recommendation algorithm is common in E-commerce systems. With the development of E-commerce, the user rating data is more and more sparse, and the quantity of items that has been rated by same users is limited. The user-based CF needs to find at least two users who have rated at least two same items. The fact similar users may not be able to be found if they lack same rated items. Accordingly, a recommender system based on nearest neighbor algorithms may be unable
18
to make any item recommendations for a particular user. Item-based CF has better performance than user-based CF in state of sparse databases[10], but it still needs to find at least two items that have been rated by at least two same users. The corresponding users’ sets of items can’t be exactly the same, so the similarity between items is not based on the same users set, as a result the accuracy of recommendations may be poor. There are some problems in the traditional similarity measuring method in the state of sparse database. Using cosine-based similarity measurement, while in the case that the rating vectors of the two items present multiple, the two items would be considered similar. However, in fact the ratings between items are much different. It is clear that cosine-based similarity measurement has one important drawback that the differences in rating scale between different users are not taken into account. The adjusted cosine similarity offsets this drawback by subtracting the corresponding user average from each co-rated pair. However, from the calculation formula of adjusted cosine similarity, we can see that a rating of an item is likely to equal to its average score, which means the divisor is zero, and in the condition with the sparse data, the set of customer that has rated two same items is very small, thus it will affect the accuracy of the result. The correlation-based similarity measurement also has the problem that has to find a customer set that has rated the same two items.
2 A New Algorithm Based on Item and Cloud Model The collaborative filtering recommendation algorithm based on item and cloud model in this paper improves the performance of similarity measuring method by introducing the cloud model when the user rating data are extremely sparse. Using the similarity measuring method based on cloud model, there is no need to isolate the users who have rated same items and no need to isolate items that have been rated by same users. We regard all ratings of an item as a “cloud” to establish a cloud model for each item, and the similarity between items can be determined by comparing the “clouds”. That is to say, we do not focus on a rating of an item rated by a specific user, but the statistical characteristics of the overall ratings. 2.1 Cloud Model Cloud model is an uncertainty transforming model
Wuhan University Journal of Natural Sciences 2011, Vol.16 No.1
between qualitative concept and quantitative numerical values. It mainly reflects two uncertainties of objects or human knowledge in objective world, which are fuzziness and randomness. The cloud model integrates the two uncertainties and forms the mapping from qualitative to quantitative[12]. The cloud is composed with cloud drops, and the cloud drops are in disorder. One cloud drop is an implement with quantity in qualitative concept. In this paper, the cloud drop that belongs to the rating cloud of each item is a rating of the item. All ratings of an item from different customers, namely different cloud drops, collect to form the rating cloud of the item. The cloud uses expectation Ex, entropy En, and excess entropy He to represent one quantitative concept holistically. Set the three numerical characteristics of rating cloud of item i to constitute the cloud characteristic vector ci . While computing the similarity between item i and j, we can judge from the similarity between vector ci and c j . The key innovation of this paper is getting characteristic vector c of the item’s rating cloud. To get the cloud feature vector c of item, we need a backward cloud generator. The backward cloud generator is an uncertainty conversion model that implements the process of transforming between numerical values and language values. It is mapping from quantitative numerical values to qualitative concept. It transforms accurate data to the concept that represented by qualitative linguistic values {Ex, En, He}, which can represent the whole of the accurate data. The backward cloud algorithm is as follows. Input: sample points X i , i = {1, 2, , n}. Output: numerical characteristic {Ex, En, He} that reflect qualitative concept. Algorithm steps: ① According to X i , compute the sample mean X of the data, X = tral moment is
1 n ∑ xi , first order sample absolute cenn i =1
1 n ∑ xi − X , sample variance is n i =1 S2 =
1 n ( xi − X ) 2 ; ∑ n − 1 i =1
② Ex = X ; ③ En =
π 1 n × ∑ xi − Ex ; 2 n i =1
④ He = S 2 − En 2 .
The algorithm in this paper firstly uses backward
19
WANG Shuliang et al : A Collaborative Filtering Recommendation Algorithm …
cloud generator to generate the characteristic vector of item cloud, the vector is c = (Ex, En, He). Ex reflects the average rating of users. En reflects dispersion of users’ rating. He means stability of entropy. And then get similarity between items by calculating the cosine-based similarity of c. 2.2 Item Similarity Computation We take the rating vector on m-dimensional user-space as input, and use one-dimensional backward cloud generator to generate cloud that represents the rating characteristic of the item. The generated numerical characteristic of cloud is {Ex, En, He}. Let vector c = (Ex, En, He) to represent the cloud of item i, then the similarity sim(i, j ) between item i and j is ci i c j sim(i, j ) = cos(ci , c j ) = (4) ci i c j Considering that the data set used in this paper is sparse, we choose cosine-based similarity to compute the cloud model similarity. The k most similar items of the target item can be selected by using this similarity measuring method. 2.3 Prediction Computation After getting the nearest neighbors of the target item by using the cloud-based similarity measuring method, the next step is prediction computation. Set similar items set of target item i as N, the prediction on an item i for a user u can be generated by computing the sum of the ratings given by the users on the items similar to i. We can denote the prediction Pu ,i as ∑ j∈N (Si, j × Ru , j ) Pu ,i = (5) ∑ j∈N (| Si , j |) Si , j delegates the similarity between item i and j. Ru , j is the score of item j rated by user u.
3 3.1
Experimental Evaluation
Data Set The data set we used was collected through the MovieLens Web site (movielens.umn.edu) during the seven-month period from September 19, 1997 to April 22, 1998. The data set includes totally 100 000 ratings. There are 943 users and 1682 movies, so the data set was converted into a user-item matrix that had 943 rows and 1682 columns. Each user in this data set had rated 20 movies at least, and the scores is an integer from one to five. We divided the database into training sets and test
sets. The data sets u1.base and u1.test through u5.base and u5.test are 80%/20% splits of the u data into training and test data. Each of u1, …, u5 have disjoint test sets. We repeated our experiment in training set and test set and then averaged the results. In order to measure the sparsity of data sets, we introduce the concept of sparsity level[10]. For the usernonzero entries item matrix, this is defined as 1 − . The total entries sparsity level of the movie data set is, therefore, 100 000 1− , which is 0.936 9. 943 × 1 682 3.2 Evaluation Metrics The measures for evaluating the quality of a recommender system can be mainly categorized into two classes: statistical accuracy metrics and decision support accuracy metrics[10]. Mean absolute error (MAE) between ratings and predictions is a widely-used statistical accuracy metric. MAE is easy to understand and can measure the quality of recommender systems in an intuitive way. In this paper, we used MAE as the evaluation metrics. MAE is a measure of the deviation of recommendations from their true user-specified values. The prediction set of user rating is expressed as { p1 , p2 , , pn }, the corresponding factual user rating set is expressed as {q1 , q2 , , qn }, formally, N
MAE =
∑p i =1
i
− qi
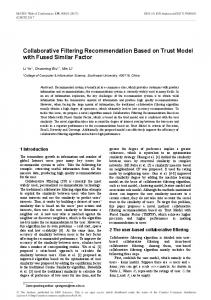
(6) N The lower the MAE is, the more accurately the recommendation predicts user ratings. 3.3 Experimental Results The item-based collaborative filtering recommendation algorithm has been proven to have better performance than user-based collaborative filtering recommendation algorithm in the state of extremely sparse data[10]. Therefore, in this paper, we combine the similarity measuring method with the item-based CF, hoping that there is a better performance on the extremely sparse user rating data. We implemented three traditional similarity algorithms basic cosine, correlation and adjusted cosine as described in Section 1.2 and tested them on our data sets by computing MAE. The size k of similar items set is from 10 to 400 (there is a total of 1 683 items in our data set). Figure 1 shows the experimental results. It can be observed from the results that when k is larger than 150, the IC-based CF proposed in this paper
20
Wuhan University Journal of Natural Sciences 2011, Vol.16 No.1
ward cloud algorithm in this paper can be improved to make the cloud characteristic vector more accurate. If cloud characteristic vector is more representative of the items score achieved, the IC-based algorithm can have better performance.
References [1] Sarwar B, Karypis G, Konstan J, et al. Item-Based collaboraFig. 1
Comparison of accuracy of recommendation algorithms
has the minimum value of MAE. This result can be explicated by the characteristic of cloud model. In the traditional collaborative filtering recommendation algorithm, if correlation or adjusted cosine is used to measure similarity, the similarity between two items is determined by the ratings of users who have rated both these items. However, with the extremely sparse data, the quantity of these users is very limited, so even these users have similar ratings on these two items, these two items may not be the exact nearest neighbors. The experiment results support that the accuracy of recommendations is poor. Using basic cosine to measure similarity, there is no statistics information of items, and if there were two items that had never been rated by any user, these two items are regarded as similar by this method. This result is obviously imprecise.
4
Conclusion
tive filtering recommendation algorithms [C]// Proceedings of the 10th International World Wide Web Conference, Hong Kong: ACM Press, 2001: 285-295. [2] Chickering D, Hecherman D. Efficient approximations for the marginal likelihood of Bayesian networks with hidden variables [J]. Machine Learning, 1997, 29(2/3): 181-212. [3] Dempster A, Laird N, Rubin D. Maximum likelihood from incomplete data via the EM algorithm [J]. Journal of the Royal Statistical Society, 1977, B39: 1-38. [4] Thiesson B, Meek C, Chickering D, et al. Learning mixture of DAG models [R]. Technical Report, MSR-TR-97-30, Redmond: Microsoft Research, 1997. [5] Sarwar B, Karypis G, Konstan J, et al. Analysis of recommendation algorithms for E-commerce [C]// Proceedings of the 2nd ACM Conference on Electronic Commerce. Minneapolis: ACM Press, 2000: 158-167. [6] Wolf J, Aggarwal C, Wu K L, et al. Horting hatches an egg: A new graph-theoretic approach to collaborative filtering [C]// Proceedings of the ACM SIGMOD International Conference on Knowledge Discovery and Data Mining. San Diego: ACM Press, 1999: 201-212.
In this paper, based on the traditional collaborative filtering recommendation algorithm, we introduced the cloud model and proposed a similarity measuring method based on cloud model. We combined the similarity measuring method based on cloud model with the item-based collaborative filtering recommendation algorithm to form the new collaborative filtering recommendation algorithm based on item and cloud model. The biggest difference between the IC-based CF and the traditional CF is the way to compute similarity of items. Using the similarity measuring method based on cloud model, it does not require strict comparison of different users of the items score, but consider all ratings of an item to compute this item’s statistics features, and then determine the similarity between items by comparing the statistics features of items. The experiment results show that the new algorithm can improve the performance of the present item-based collaborative filtering algorithm with extremely sparse data. Simultaneously, the back-
[7] Breese J, Hecherman D, Kadie C. Empirical analysis of predictive algorithms for collaborative filtering [R]. San Francisco: Technical Report MSR-TR-98-12, 1998: 43-52. [8] Zan H, Hsinchun C, Daniel Z. Applying associative retrieval techniques to alleviate the sparsity problem in collaborative filtering [J]. ACM Trans on Information Systems, 2004, 22(1): 116-142. [9] Goldberg D, Nichols D, Oki B M, et al. Using collaborative filtering to weave an information tapestry[J]. Communications of the ACM, 1992, 35(12): 61-70. [10] Deshpande, Karypis G. Item-Based Top-N Recommendation Algorithms [J]. ACM Trans Information Systems, 2004, 22(1): 143-177. [11] Badrul S, Karypis G, Konstan J, et a1. Analysis of Recommendation Algorithms for E-commerce [M]. New York: ACM Press, 2000: 106-112. [12] Li Deyi. Artificial Intelligence with Uncertainty [M]. Beijing: National Defense Industry Press, 2005: 171-177 (Ch).
□