Mahout since a key advantage of the collaborative filtering approach is that it does not rely on ... where a neural network was trained to do the classification. [4].
1
User based Collaborative filtering Recommendation System using Apache Mahout Tarun Bhatia (2012239) Upendra Chaurasia (2012244) Abstract--Recommender systems or recommendation systems predict the preference that user would give to an item. They are a subclass of information filtering system and have become common in recent years and have been applied in various applications like music, news, movies, books, social tags, research articles and search queries. They can be even found at online dating sites, twitter followers, financial services and life insurances. Recommendation are produce by two ways either through collaborative filtering or content based filtering. We choose collaborative filtering for our project and Apache Mahout since a key advantage of the collaborative filtering approach is that it does not rely on machine analyzable content and therefore it is capable of accurately recommending complex items such as movies without requiring an "understanding" of the item itself .It is based on the assumption that people who agreed in the past will agree in the future, and that they will like similar kinds of items as they liked in the past. Apache mahout is selected as it is scalable machine learning library and can be implemented on Hadoop. Since collaborative filtering requires large input data to perform well so we need scalable machine learning algorithm. We experimented by applying different similarity correlations and nearest n neighbors to get better performance of our recommendation system on given dataset.
I. INTRODUCTION Recommender systems are very popular in e-commerce application. They supply users with a list of items recommendations that they might prefer while buying. For example Amazon provides its user a list of recommended books based on books bought by the users who bought the specific book. Social networking sites like Facebook use variants on recommender techniques to identify people most likely to be as yet unconnected friends. YouTube has its own recommendation system [1]. The biggest issue faced by recommendation system that they need a lot of data to make effective recommendations. It’s no coincidence that companies like Google, Amazon, Netflix, YouTube, and Facebook which have good recommendations have also large amount of consumer data. The more items and users data a recommender has, better is the chance for getting good recommendation.
Another problem is while todays someone has a particular intension when buying tomorrow he may have different intension. It takes lot of variable for a good recommendation. Since the data needed to produce a good quality recommendation system is use we need a scalable recommender system. In order to solve this problem cloud computing platform are used. There are many for example, Amazon's Elastic Compute Cloud, Azure of Microsoft, the IBM Computing on Demand or Blue Cloud and Google's AppEngine etc. Cloud computing is the provision of dynamically scalable and often virtualized resources as a service over the Internet. Apache mahout is an open source scalable machine learning library in java for large scale machine learning projects. It can be implemented on Hadoop. Mahout greatly simplifies extracting recommendations and relationships from input datasets. Here we look at setting up Mahout and running its recommender on a sample of 100k preferences. Apache Mahout is a highly scalable machine learning library that enables developers to use optimized algorithms, such as collaborative filtering and random forest decisiontree-based classifiers. As such, Apache Mahout is becoming one of the most popular library for machine-learning projects. In this first of a pair of articles, I'll start explaining how to create a Mahout recommender by taking advantage of one of its collaborative filtering algorithms. Using the Hadoop platform, we can easily make the program execute in parallel, and the MapReduce framework allows the user to break a big problem for many small problems, then the small problems could be handled by the Hadoop platform, thus improve the speed of computing. A. Apache Mahout The Apache Mahout architecture for non-distributed recommender engine provides a rich set of components from which we can construct a customized Recommender System by the selection of algorithms. Mahout is designed to be enterprise-ready designed for performance, scalability and flexibility. Top level packages define the Apache Mahout interfaces to these key abstractions are: DataModel UserSimilarity ItemSimilarity UserNeighborhood Recommender
2 Mahout provides these building blocks from which we can construct the best Recommender for our application. Fortunately, Mahout also provides a way to evaluate the accuracy of our Recommenders on datasets using header org.apache.mahout.cf.taste.eval.
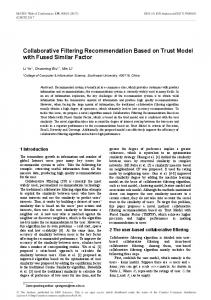
Figure 2. Apache Mahout Architecture
II. RELATED WORK Early work on collaborative filtering was done by (Resnick et al., 1994) who using a memory based algorithm where similarity between users is measured using the correlation coefficient between the two users [2]. An empirical comparison of several collaborative filtering algorithm was done by (Breese et al., 1998) [3]. Collaborative filtering was posed as a classification problem in (Billsus & Pazzani, 1998) where a neural network was trained to do the classification [4]. Recommendation was again posed as classification in (Basu et al., 1998) where it was shown that appropriately chosen content features can improve performance compared to pure collaborative filtering [5]. Condliff et al. (1999) designed a Bayesian mixed effect model using both content and collaborative features. Baxter in 1995 investigated the approach of learning shared parameters in machine learning, in context of learning multiple task based on hierarchical Bayesian modeling [6]. Ungar & Foster in 1998 proposed models that cluster both users and items. These approaches had attracted performance bound but may need modification in order to be practically scalable. The Mahout project was started by people involved in apache lucene community with a desire to build a robust well documented scalable implementation of common machine learning algorithms for clustering and categorizing [7,8].
III. APPROACH A. Datasets We are using Group-lens dataset. Grouplens Research has collected and made available rating data sets from the MovieLens web site (http://movielens.org) [9]. The data sets were collected over various periods of time, depending on the size of the set. Rating of the movies are contained in file ratings.dat. Each line of this file represents one rating of one movie by one user and has the following format: UserID::MovieID::Rating::Timestamp The lines within file are ordered by userID and then within the file by MovieID. Ratings have been made on five star scale with half star increment. Another file Movies.dat contains movieID title and genres. MovieID is real movie ID. Genres are a pipe separated list and are selected from the following: Action Western War Thriller Sci-fi Romance Mystery Musical Horror Film-noir Fantasy Drama Documentary Crime Comedy Children Animation Adventure
Table -I Name ML 100k
Users 943
Items 1,682
Preferences 100,000
B. Preprocessing and feature extraction The recommender requires input data in the form of preferences. Preferences are associations from users to items. Grouplens dataset is tab –delimited file with user ids, item ids, and ratings, and some additional information .We can choose the fields based on which need to make our recommendation system. This file can be converted to csv (comma separated file) by using cut, awk command in Linux or we can write a java class for that. C. Machine Learning techniques used Recommendations can be provided by two basic techniques are collaborative filtering and content based filtering.
3 Collaborative filtering is a technique for making automatic predictions (filtering) about the taste of a user by collecting preferences from many users (collaborating). The underlying assumption of approach is that if a person X has the same opinion as a person Y on an issue, X is more likely to have Y's opinion on a different issue A than to have the opinion on A of a person chosen randomly [11]. This is different from the simpler approach of giving an average score for each item of interest, for example based on its number of votes. The motivation for collaborative filtering comes from the idea that people often get the best recommendations from someone with similar tastes to themselves. Typically, the workflow of a collaborative filtering system is [10]: 1. A user expresses his or her preferences by rating items (e.g. movies) of the system. These ratings can be viewed as an approximate representation of the user's interest in that domain. 2. The system matches this user’s ratings against other users’ and finds the people with most similar preferences. 3. With similar users, the system recommends items that the similar users have rated highly but not yet being rated by this user, presuming the absence of rating is often considered as the unfamiliarity of an item. Collaborative filtering can be user based or item based. Algorithm We are using user based collaborative filtering. The user-based recommender algorithm comes out of this intuition. It’s a process of recommending items to some user, denoted by u, as seen below [11]: for every item i that u has no preference for yet for every other user v that has a preference for i compute a similarity s between u and v incorporate v's preference for i, weighted by s, into a running average return the top items, ranked by weighted average.
The outer loop considers every known item that the user hasn’t already expressed a preference for as a candidate for recommendation. The inner loop looks for any other user who has expressed a preference for the same candidate item, and looks at their preference value. In the end, the values are averaged to come up with a weighted average, i.e. each preference value is weighted in the average by how similar that user is to the target user. The more similar a user, the more heavily their preference value is weighted. Examine every item would result in a very slow process. To speed up a neighborhood of most similar users is computed first, and only items known to those users are considered [11]: for every other user w compute a similarity s between u and w retain the top users, ranked by similarity, as a neighborhood n for every item i that some user in n has a preference for,
but that u has no preference for yet for every other user v in n that has a preference for i compute a similarity s between u and v incorporate v's preference for i, weighted by s, into a running average.
For finding similarity we used Pearson’s similarity coefficient, after comparing with Tanimoto similarity correlation and Euclidian similarity correlation. Pearson correlation of two series is the ratio of their covariance to the product of their variances. Covariance is a measure of how much two series move together in absolute terms; it’s big when the series moves far in the same direction from their means in the same places. Dividing by the variances merely normalizes for the absolute size of their changes. Tanimoto Coefficient uses the ratio of the intersecting set to the union set as the measure of similarity. Represented as a mathematical equation:
N is the number of attributes in each object (a, b). c is the intersecting object. Euclidian distance is the square root of the sum of the squares of the differences between corresponding elements of the two vectors.
Correlation between vectors X and Y are defined as follows:
where μX and μY are the means of X and Y respectively, and σX and σY are the standard deviations of X and Y. The numerator of the equation is called the covariance of X and Y, and is the difference between the mean of the product of X and Y subtracted from the product of the means. Note that if X and Y are standardized, they will each have a mean of 0 and a standard deviation of 1, so the formula reduces to:
4 D. Evaluation Various evaluation metrics are available to measure the quality of the recommendation system. This section presents various evaluation metrics to evaluate prediction, accuracy, and performance. 1) Coverage It is defined as the percentage of the item the recommendation system is able to recommend to the user. It can be used to detect algorithm’s accuracy. Although they recommend only a small number of items. These are usually very popular items with which user is already familiar without the help of system. 2) Prediction Accuracy These metrics measure how close the recommender’s prediction to the true users rating. The various measures are Mean Absolute Error, Root Mean Square Error, Precision, Recall, F1 metric. The mean absolute error is a model evaluation metric used with regression models. The mean absolute error of a model with respect to a test set is the mean of the absolute values of the individual prediction errors on over all instances in the test set.
Root mean squared error is an error calculation method used in describing how well a regression model represents a data being modelled.
Where, pi is the prediction for user i ri is the true rating value k is the number of items user I has rated Precision is the fraction of retrieved instances that are relevant.
Recall is the fraction of relevant instances that are retrieved.
F1 considers both the precision p and the recall r of the test to compute the score: p is the number of correct positive results divided by the number of all positive results, and r is the number of correct positive results divided by the number of positive results that should have been returned. It can be represented as a weighted average of the precision and recall, where an F1 score reaches its best value at 1 and worst score at 0.
E. Study/Experiment We used root mean square score to compare different experiments with design of user based collaborative filtering recommendation system. We compare three similarity correlation along with their nearest n neighborhood. Table -II For neighborhood size 2 Similarity correlation Root mean square score Pearson 1.232969 Euclidian 1.238418 Tanimoto 1.275288 Table -III For neighborhood size 10 Similarity correlation Root mean square score Pearson 1.1785418 Euclidian 1.1637617 Tanimoto
1.08074
Table -IV For neighborhood size 20 Similarity correlation Root mean square score Pearson 1.1653594 Euclidian 1.11506732 Tanimoto 1.0519529 Table -V For neighborhood size 30 Similarity correlation Root mean square score Pearson 1.1477560 Euclidian 1.0842597 Tanimoto 1.0349538 Table -VI Similarity correlation Pearson Euclidian Tanimoto
For neighborhood size 100 Root mean Time (ms) square score 1.0686070 60584 1.0054979 57873 1.0144103 224618
Table -VI Similarity correlation Pearson Euclidian Tanimoto
For neighborhood size 200 Root mean Time (ms) square score 1.0209923 59950 0.9662379 60128 1.0099516 223520
Table -VII Similarity correlation Pearson Euclidian Tanimoto
For neighborhood size 300 Root mean Time (ms) square score 1.0156588 64335 0.96623361 61745 1.0113669 234112
5 Table -VIII Similarity correlation Pearson Euclidian Tanimoto
For neighborhood size 390 Root mean Time (ms) square score 1.0244975 65669 0.9653799 65115 1.0115253 637636
V. DISCUSSION Collaborative filtering approaches often suffer from three problems: cold start, scalability, and sparsity [13].
Cold Start: Large amount of existing data on a user is required in order to make accurate recommendations. Scalability: Since the data is huge consisting of millions of users and product a large amount of computation power is needed to calculate recommendation. Sparsity: There are huge number of items on major e-commerce sites. The most active users will only have rated small subset of overall database. Thus many items have either no rating or very few ratings. VI. REFERENCES
Figure 2. Graph showing neighborhood size (x-axis) vs root mean squared score(y-axis) for different similarity correlation on 70% training data. The experiments have been evaluated for User-Based Collaborative Filtering that utilize the Pearson Correlation Coefficient, Euclidean Distance Similarity and Tanimoto Coefficient Similarity algorithms to determine how similarity measures affect the prediction accuracy of an User-Based collaborative filtering algorithm. The following results are obtained on Movie-lens 100k dataset using 70% training data and 30% testing data.
Figure 3. Graph showing neighborhood size vs time take by different similarity correlation along with their n nearest neighbor.
IV. RESULTS
[1] Wee Sun Lee collaborative learning for recommender systems [2] Resnick, P., Iacovou, N., Suchak, M., Bergstrom, P., & Riedl, J. (1994). Grouplens: An open architecture for collaborative filtering of netnews. [3] Breese, J. S., Heckerman, D., & Kadie, C. (1998). Empirical analysis of predictive algorithms for collaborative filtering. [4] Michael J. Pazzani and Daniel Billsus Content-Based Recommendation Systems [5] Basu, C., Hirsh, H., & Cohen, W. (1998). Recommendation as classification: Using social and contentbased information in recommendation. [6] Condliff, M. K., Lewis, D. D., Madigan, D., & Posse, C. (1999). Bayesian mixed-effects models for recommender systems.. [7] www.mahout.apache.org [8] http://en.wikipedia.org/wiki/Apache_Mahout [9] http://grouplens.org/ [10] http://en.wikipedia.org/wiki/Collaborative_filtering [11] Owen, Anil, Duning, Friedman Mahout in action (2012) [12] Collective Intelligence in Action. [13] Blerina Lika, Kostas Kolomvatsos , Stathes Hadjiefthymiades Facing the cold start problem in recommender systems