A COMPARISON BETWEEN AN OBJECTIVE QUALITY MEASURE AND THE MEAN ANNOYANCE VALUES OF WATERMARKED VIDEOS Myl`ene C.Q. Farias, Sanjit K. Mitra
Marco Carli, Alessandro Neri
University of California, Santa Barbara Electrical and Computer Engineering Dept. mylene,
[email protected]
University of Roma TRE Electrical Engineering Dept. carli,
[email protected]
ABSTRACT
2. THE WATERMARKING METHOD
In this paper, a comparison between an objective quality measure and the perceived mean annoyance values of watermarked videos is presented. A psychophysical experiment has been performed to measure the detection threshold and mean annoyance values of several watermarked videos, using two different marks. The results of this experiment were then compared with an objective quality measure, obtained through a tracing watermarking system. An estimation of the detection threshold of the watermarked videos was found.
Several watermarking methods have been proposed in the literature; a first classification of these methods can be done according to the particular domain in which the embedding process is performed. The watermark insertion can be done in the spatial domain [1] or in an ad hoc transform domain such as the DCT (Discrete Cosine Transform) domain [2], the Fourier domain [3], and the Wavelet domain [5], [7]. In this paper, the marking procedure used is based on embedding the two-dimensional watermark in the DCT domain.
1. INTRODUCTION Data hiding, and digital watermarking are techniques used for embedding data into digital video or image. In recent years several embedding systems have been proposed to copyright protection, authenticity verification, and data compression. Embedding watermarks into still images or video may, however, introduce undesired distortions or artifacts degrading the quality of the image. It is important to measure the visibility and annoyance of the artifacts introduced by the watermarking process. The only way to determine the visibility and annoyance is to measure them directly with human subjects. However, the experiments are too expensive and time consuming to be a practical method for measuring image quality. The development of an objective quality measure is, therefore, necessary. In this paper, we compared the mean annoyance values, obtained through a psychophysical experiment, and an objective quality measure, obtained through a tracing watermarking system. The goal of this research is to predict the visibility of artifacts in a watermarked video using a simple measure. If successful, this technique could reduce the cost of an embedding system evaluation by eliminating the need of a psychophysical experiment. This research is supported in part by an Italian National Research Council, in part by a National Foundation Grant No. CCR-0105404, and by CAPES-Brazil.
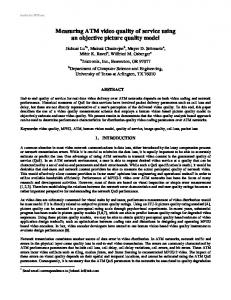
In this comparison, a high bit rate multimedia communication system has been considered: the video frame size is 720×486, in YCrCB format, 4:2:2 digital component video. The watermark image has a size of 88×88 pixels. Two watermarks have been tested: the Random image and the Logo image shown in Figure 1. The embedding procedure can be summarized as fol. lows. First, the watermark image w(n), n = (n1 , n2 ), is normalized, and binarized: w ˜ (n) = sign (w (n) − E {w (n)}), (1) Second, a pseudo random algorithm is used to generate the pseudo-noise image p(n), with values in the range [-1,1]. One pseudo-noise image is created for each frame of the video to avoid visual latency. For a generic frame of a video sequence fi (n), the final watermark wi is obtained by multiplying the watermark by pi (n): wi (n) = w ˜ (n) pi (n) (2) The logarithm of the luminance is taken and then the DCT coefficients are computed. Taking the logarithim of the luminance has the effect of flattening its distribution allowing
Fig. 1. Random (left), and Logo (right) images used as watermarks.
lower scaling values to be used in a linear manner. The mark is then added to the mid-frequencies DCT coefficients. In our experimental trials, the mark is embedded starting from the (215, 390) DCT coefficient. Several starting points have been tested: the results show that the range of frequencies where the watermark is inserted is strongly dependent on the application. For the purpose of delivering a high quality video through an ideal channel, the mid-frequencies are a good choice. Inserting the mark in the low-frequencies would cause visible artifacts in the image, while inserting it in the high frequencies would make it easier to remove it. An improved version of this algorithm can be obtained by using a zig-zag scheme. The final mark is multiplied by a scaling factor α and is added to the DCT coefficients: Yi (n) = DCT (log (fi (n))) + α · wi (n)
(3)
This scaling factor α can be used to vary the strength of the watermark. In various applications and video formats different values for α are desirable. By increasing α, we also decrease the quality of the video. The Equation (3) is always invertible, i.e., an inverse function can be computed and the original mark extracted. However, a degradation of the mark will be present due to the DCT transformation and to the pseudo-noise image pi (n). The retrieval method can be summarized in this way. First, the logarithm of the luminance of the received frame fi0 (n) is taken and its DCT is calculated: G0i (h) = DCT (log (fi0 (n)))
(4)
Second, for each frame the DCT coefficients where the mark was inserted are extracted and then multiplied by the corresponding pseudo-noise image. We assume that the receiver knows the initial position in the DCT domain where the mark is inserted. The result is averaged for a chosen number of frames Nf . The extracted binary watermark is obtained by taking the sign of this final result: Nf X 1 w ˜r (h) = sign G0 (h) pi (n) (5) Nf i=1 i An objective measure of the degradation of the recovered watermark caused by the embedding procedure is obtained by calculating the mean square error of the extracted watermark: X 2 (w ˜ (n) − w˜r (n)) , (6) Ee = n
where w ˜ (n) is the original and w ˜r (n) is the extracted watermark watermark. Our goal is to use Ee as an objective quality measure of the watermarked video. Because the degradations of the recovered watermark are due to the embedding process, Ee carries information about the visibility of the artifacts in the watermarked video.
Fig. 2. Zoomed version of the 10th frame of Cheerleaders: original (left) and embedded with watermark Logo and α = 0.6 (right). 3. THE PSYCHOPHYSICAL EXPERIMENT We used twenty test subjects drawn from a pool of students in the introductory psychology class at UCSB. A Sony PVM-1343 monitor is used to display the test video sequences. The experiment is run with one subject at a time. The subjects are positioned at a distance of four screen heights (80 cm) from the video monitor. After each video is displayed, the subject is asked to enter if he/she saw any defect. If the answer is no, no further questions are asked and the next video is shown. If the answer is yes he/she is asked to enter a value between 0 and 100, representing how annoying the defect is, compared to the worst defect present in the training sequences. The test video sequences were generated by embedding the two watermarks into five original video sequences of assumed high quality: Bus, Cheerleader, Flower-garden, Football and Hockey. The video clips are all 5 seconds long and contain scenes that are typical of normal television. To find artifact detection and annoyance values, the contrast of the error patterns must range from nearly imperceptible to highly annoying. This is obtained by varying the scaling factor used in the watermark embedding algorithm. The set of scaling factors used is 0.1, 0.2, 0.3, 0.4, 0.5, and 0.6. Figure 2 displays a detail of 10th frame of the video Cheerleaders with and without watermark. The left picture of Figure 2 corresponds to the original video, while the right picture corresponds to the same video embedded with the watermark logo and α = 0.6. The total number of test sequences used in this experiment is 65, which includes 60 test sequences (5 originals times 6 strength factors times 2 watermark images) plus the 5 original sequences. The sequences are shown in a random order during the main experiment. The total squared error (TSE) is used as our objective error measure: 2
TSE = Σn Σi (yi (n) − fi (n)) ,
(7)
where yi is the i-th frame of the watermarked video and fi is the i-th frame of the original video.
CheerLogo 100
0.9
90
0.8
80
0.7
70
Mean Annoyance
Probability of detection
CheerLogo 1
0.6
0.5
0.4
60
50
40
0.3
30
0.2
20
0.1
10
0 3.6
3.8
4
4.2
4.4 Log (TSE)
4.6
4.8
5
0 3.6
5.2
10
Fig. 3. Probability of detection curve for embedding the watermark Logo into the video cheerleaders. 4. EXPERIMENTAL RESULTS To measure the detection threshold for the artifacts, the probability of detection for each artifact as a function of the error energy is estimated. The threshold is defined as the error energy such that the artifact is seen by 50% of the subjects. The probability of detecting each artifact is estimated by counting the number of people who detected the artifact and dividing by the number of observations. The logarithm of the error energy (TSE) is used for each artifact as the independent variable. The probability as a function of the logarithmic error energy is then fitted using the Weibull function [8], which has an S-shape similar to the experimental data and is defined as k
P (x) = 1 − 2(Sx)
,
(8)
where P (x) is the probability of detection, x is the logarithmic error energy, 1/S is the 50% detection threshold in logarithmic error energy, and k is a constant that determines the steepness of the function. Figure 3 depicts the probability of detection curves for the artifacts caused by embedding the watermark image Logo into the video Cheerleaders. The curve corresponding to the artifacts caused by embedding the image Random is very Table 1. Threshold error energy and detection threshold curve fit parameters for the artifacts.
Test Sequence Bus-Logo Bus-Random Cheer-Logo Cheer-Random Flower-Random Foot-Logo Foot-Random
Detection Threshold TSE log10 (TSE) 15488 4.19 16218 4.21 27542 4.44 28184 4.45 39811 4.60 26303 4.42 26303 4.42
Curve Fit Parameters S k 0.2407 27.71 0.2378 31.17 0.2259 37.66 0.2256 42.38 0.2179 87.50 0.2270 25.68 0.2273 27.38
3.8
4
4.2
4.4 Log10(TSE)
4.6
4.8
5
5.2
Fig. 4. Mean annoyance curve for embedding the watermark Logo into video cheerleaders. similar, implying that the choice of a different image as a watermark does not have a significant effect on the visibility of the artifacts. Table 1 summarizes the 50% detection threshold found in terms of error energy (TSE) and logarithmic error energy (log10 (TSE)). Overall, the threshold values do not change considerably over the sequences and remain almost constant when only the embedded image is changed. Table 1 also includes the curve fit parameters found for each sequence and image tested. The parameter S (sensitivity) corresponds to the inverse of the log-threshold and therefore has the same behavior. The parameter k, which represents the steepness of the probability of detection curve, varies between different videos and may be due to variation in content of the videos. The same artifact at the same strength will vary both in visibility and annoyance depending on where and when it appears, and also on the texture and luminance characteristics of the background of the video. Standard methods [8] are used to analyze the data provided by the test subjects and to compute the mean annoyance values. The mean annoyance values for each test sequence is fitted with the standard logistic function [8]: (ymax − ymin ) ³ ´ y = ymin + (9) 1 + exp − (x−x) β where y is the predicted annoyance and x is the logarithmic error energy. The parameters ymax and ymin establish the limits of the annoyance value range. The parameter x translates the curve in the x-direction and the parameter β controls the steepness of the curve. Figures 4 depicts the mean annoyance curves versus the logarithmic error energy for the artifacts caused by embedding the watermark image Logo into the video Cheerleaders. Again, the curve corresponding to the artifacts caused
1
tion of the detection threshold of the watermarked video. This approximation can be useful in the design of a embedding system.
0.9
0.8
Normalized Amplitude
0.7
6. CONCLUSIONS
0.6
0.5
0.4
0.3
Annoyance for Logo Annoyance for Random MSE for Logo MSE for Random
0.2
0.1
0 0.1
0.15
0.2
0.25
0.3 0.35 0.4 α (Watermark strength)
0.45
0.5
0.55
0.6
Fig. 5. Normalized mean annoyance and extracted watermark mean square error curves, for the video Cheerleaders.
A comparison between an objective quality measure and the mean annoyance values of watermarked videos is presented. A psychophysical experiment was performed to measure the detection threshold and mean annoyance values of several watermarked videos. The results of this experiment were then compared with the objective measures obtained by calculating the mean square error of the extracted watermark. An approximation of the detection threshold of the watermark was obtained. 7. REFERENCES
by embedding the image Random is very similar. The steepness of the annoyance curve β does not vary significantly for different watermarks, but it does vary between test sequences. The same is true for the parameter x. 5. WATERMARK DATA ANALYSIS The degradation of the recovered watermark can be used as a measure of the quality of the watermarked video. Experimental results show that, if other noise sources are not present, the degradation of the watermark is due only to the DCT and to the pseudo-random noise image pi (n). The smaller the difference between the extracted and the original watermark, the more visible are the artifacts introduced by the watermarking process. An objective measure Ee for the video quality of the watermarked video is obtained using Equation (6). The bigger the number of frames Nf used in the extraction of the watermark (Equation (5)), the smaller Ee . If Nf > 15, the value of Ee is so small that it becomes difficult to find any relation between the objective and the subjective measures. In this work, we used Nf = 3 frames. A small number of frames gives a fast tool for estimating the quality of the watermarked video, without requiring a psychophysical experiment. Figure 5 depicts the combined graph of the mean annoyance curve, obtained from the psychophysical experiment, and the objective quality measure, Ee , for the video Cheerleaders. Both curves were normalized between 0 and 1 to fit in the same graphic. As expected, Ee decreases with the strength of the embedded watermark α, while the mean annoyance increases with it. For each of the videos tested, the curve has a similar shape, but the values of the errors are rather different because the data-hiding capacity of each video is different. The point where the two curves meet gives an approxima-
[1] N. Nikolaidis, and I. Pitas, “Robust image watermarking in the spatial domain,” Signal Processing, vol. 66, no.3, pp. 385-403, May 1998. [2] M. Barni, F. Bartolini, V. Cappellini, A. Piva, “A DCTdomain system for robust image watermarking,” Signal Processing, vol. 66, no. 3, pp. 357-372, May 1998. [3] I. Cox, J. Kilian, F. Leighton, T. Shamoon, “Secure spread spectrum watermarking for multimedia,” IEEE Trans. Image Processing, vol. 6, no. 12, December 1997. [4] M. D. Swanson, B. Zhu, A. H. Tewfik, “Transparent robust image watermarking transform,” Proc. IEEE Int. Conf. Image Proc. 1996, Lausanne, Switzerland, pp. 211-214, 16-19 September, 1996. [5] H. Inoue, A.Miyazaki, T. Katsura, “An image watermarking method based on the wavelet transform,” Proc. IEEE Int. Conf. Image Proc. 1999, pp. 296-300, Kobe, Japan, 25-28 October, 1999. [6] H. J. M. Wang, P. C. Su, and C. C. J. Kuo, “Waveletbased blind watermark retrieval technique,” Proc. SPIE, vol 3528, Conf. on Multimedia Systems and Applications, Boston, MA, November 1998. [7] P. Campisi, A. Neri, M. Visconti, “A wavelet based method for high frequency subbands watermark embedding,” SPIE Multimedia Systems and Applications III, Boston (MA), November 2000. [8] ITU Recommendation BT.500-8, “Methodology for subjective assessment of the quality of television pictures,” 1998.