See discussions, stats, and author profiles for this publication at: https://www.researchgate.net/publication/268524300
A Comparison between Simple Linear Regression and Radial Basis Function Neural Network (RBFNN) Models for Predicting Students’ Achievement Conference Paper · June 2014 DOI: 10.13140/2.1.3878.5600
CITATIONS
READS
2
437
3 authors: Haviluddin Haviluddin
Andang Sunarto
Universitas Mulawarman
Institut Agama Islam Negeri Bengkulu
52 PUBLICATIONS 79 CITATIONS
14 PUBLICATIONS 16 CITATIONS
SEE PROFILE
SEE PROFILE
Suci Yuniarti Universiti Malaysia Sabah (UMS) 5 PUBLICATIONS 2 CITATIONS SEE PROFILE
Some of the authors of this publication are also working on these related projects:
prediction View project
IT Government View project
All content following this page was uploaded by Haviluddin Haviluddin on 25 March 2017.
The user has requested enhancement of the downloaded file.
TABLE OF CONTENT: Part 2 Titles & Authors 1.
PEMBANGUNAN DAN PENGESAHAN INSTRUMEN 2P2S UNTUK MENGENAL PASTI PERSEPSI GURU MATEMATIK DALAM KOMUNITI PEMBELAJARAN PROFESIONAL: LESSON STUDY
Page Numbers 1-18
Nancy Ng Yut Kuan Faculty of Psychology and Education , Universiti Malaysia Sabah 2.
FAKTOR PENYUMBANG PENCAPAIAN RENDAH MATA PELAJARAN EKONOMI STPM DI SABAH: SATU TINJAUAN AWAL
19-28
Abdul Said Ambotang¹, Baharom bin Mohamad² dan Dullah Yute³ ¹·²·³Fakulti Psikologi dan Pendidikan, Universiti Malaysia Sabah 3.
PERLAKSANAAN PENGAJARAN MATA PELAJARAN SEJARAH DI SEKOLAH RENDAH: TINJAUAN DALAM KALANGAN GURU DI DAERAH TAWAU SABAH 1,2
4.
29-39
Dullah Yute¹ dan Abdul Said Ambotang² Fakulti Psikologi dan Pendidikan, Universiti Malaysia Sabah
KEPIMPINAN PENGAJARAN GURU BESAR HUBUNGANNYA DENGAN KOMITMEN DAN KEPUASAN KERJA GURU DI SEKOLAH RENDAH
40-50
Abdul Said Ambotang¹, Jumriah Abdul Azis² dan Christina Andin³ ¹· ² Fakulti Psikologi dan Pendidikan,Universiti Malaysia Sabah ³Fakulti Pendidikan, Universiti Teknologi Malaysia 5.
PERBANDINGAN EFIKASI GURU DI MAKTAB RENDAH SAINS MARA SABAH DAN MRSM TERENGGANU.
51-57
Mohd Mahadzir Rahimi Bin Mohamed Nawi1, Khalid Bin Johari2 Dewi Isma Bt Madzlan3, Norsimah Bt Dasan4 Zulaine Bin Awang Taul5 1,2,3,4,5
6.
Fakulti Psikologi dan Pendidikan, Universiti Malaysia Sabah
AMALAN KREATIVITI DALAM PENGAJARAN DAN PEMBELAJARAN PENDIDIKAN SENI VISUAL DI SEKOLAH MENENGAH DAERAH KUDAT SABAH: SATU KAJIAN KES George Tamaki and Sabariah Sharif Fakulti Psikologi dan Pendidikan, Universiti Malaysia Sabah
58-73
7.
PENGGUNAAN ’MAGIC HAND’ DALAM MEMBANTU MURID MENGINGAT FASA-FASA BULAN BAGI MATA PELAJARAN SAINS TAHUN 5 :SATU KAJIAN TINDAKAN Chin Mui Ken1, and Dr. Siew Nyet Moi @ Sopiah Abdullah2 1,2 Faculty of Psychology and Education, Universiti Malaysia Sabah
74-82
8.
KESAN LATIHAN PLIOMETRIKS MENGGUNAKAN METOD KONVENSIONAL DAN SHUTTLE MVP KE ATAS PENINGKATAN KUASA BAHAGIAN BAWAH BADAN ATLET LOMPAT KIJANG
83-98
Frankie Lumpil1, D Maryama Daud2 Sekolah Sukan Malaysia Sabah, Kota Kinabalu, Sabah, Malaysia. 2 Department of Sports Science, Universiti Malaysia Sabah
1
9.
HUBUNGAN ANTARA EFIKASI GURU DENGAN METAKOGNISI DALAM KALANGAN GURU-GURU SEKOLAH RENDAH PEDALAMAN SATU DI BEBERAPA BUAH DAERAH DI SABAH
199-105
Iffahzuleha Elmandily Binti Awaluddin Fakulti Psikologi dan Pendidikan, Universiti Malaysia Sabah
10.
HUBUNGAN ANTARA KESEDARAN METAKOGNISI DENGAN KOMITMEN KERJAYA DALAM KALANGAN GURU – GURU PEDALAMAN SATU DI SABAH
106-111
Isninah binti Muin1 Faculty of Psychology and Education, Universiti Malaysia Sabah
1
11.
HUBUNGAN ANTARA EFIKASI KOLEKTIF DENGAN KREATIVITI PENGAJARAN DALAM KALANGAN GURU-GURU SEKOLAH RENDAH PEDALAMAN SATU DI BEBERAPA BUAH DAERAH DI SABAH
112-119
Cory Joanes Fakulti Psikologi dan Pendidikan, Universiti Malaysia Sabah 12.
HUBUNGAN ANTARA AMALAN PENGURUSAN, KEPUASAN KERJA DAN KOMITMEN KERJA DALAM KALANGAN KETUA PANITIA BERDASARKAN PRESTASI AKADEMIK SEKOLAH A DAN SEKOLAH B KAWASAN PEDALAMAN ATAS NEGERI SABAH. Laimah Sungap Pejabat Pendidikan Daerah Keningau, Sabah.
120-132
13.
PENGARUH KEPEMIMPINAN INSTRUKSIONAL, MOTIVASI KERJA GURU TERHADAP PRESTASI KERJA GURU MATA PELAJARAN SEJARAH DI SABAH.
133-142
Dg Norizah Ag Kiflee@Dzulkifli¹, Baharom Mohamad², and Roslee Talip³ 1,2,3 Faculty of Psychology and Education, Universiti Malaysia Sabah 14.
PENGETAHUAN GURU BAHASA MELAYU SEKOLAH RENDAH
143-149
Hairiya bt Darwis1 Mohd Zaki b Ishak2 1,2 Fakulti Psikologi dan Pendidikan, Universiti Malaysia Sabah 15.
BAHAN BANTU MENGAJAR GURU BAHASA MELAYU SEKOLAH RENDAH DI DAERAH SEMPORNA 1,2
16.
150-157
Bibah Bt Talag1, Mohd. Zaki B. Ishak2 Fakulti Psikologi dan Pendidikan, Universiti Malaysia Sabah
HUBUNGAN KUALITI PENGAJARAN GURU DENGAN SIKAP PEMBELAJARAN PELAJAR SEKOLAH RENDAH
158-174
Normiati Batjo1 dan Mohamad Nizam Nazarudin2 1.2
17.
Faculty of Psychology and Education, Universiti Malaysia Sabah
MOTIVASI DALAM PELAKSANAAN PEMBELAJARAN PERDAGANGAN BERASASKAN PROJEK PELAJAR TINGKATAN EMPAT DI SEBUAH SEKOLAH MENENGAH DAERAH KOTA BELUD, SABAH.
175-184
Cheng Tsen Lui1 Christina Peter Ligadu2, Dayang Maryama Awang Daud3 1,2,3 Fakulti Psikologi dan Pendidikan, Universiti Malaysia Sabah PEMBINAAN DAN PENGESAHAN INSTRUMEN LITERASI PENTAKSIRAN INSTITUT PENDIDIKAN GURU (ILP IPG)
18.
185-194
Zakiah Noordin1, Vincent Pang1 dan Mohd Khairuddin Abdullah1 1 Fakulti Psikologi dan Pendidikan, Universiti Malaysia Sabah 19.
MELAYU DALAM KALANGAN PELAJAR TINGKATAN EMPAT DI DAERAH TAWAU 1,2,
Hapsa bt Anwar1 & Mohd Zaki b Ishak2 Fakulti Psikologi dan Pendidikan, Universiti Malaysia Sabah
195-202
20.
PELAKSANAAN PROGRAM BIMBINGAN MEMBACA DAN MENULIS (PROBIM) DALAM KALANGAN PELAJAR SEKOLAH MENENGAH
203-210
Samsuriani Rusli1 Mohd. Zaki Ishak2 1,2, Fakulti Psikologi dan Pendidikan, Universiti Malaysia Sabah 21.
HUBUNGAN ANTARA PENGETAHUAN DAN KEMAHIRAN PENGURUSAN DISIPLIN DENGAN SIKAP GURU DISIPLIN
211-217
Najihah bt Yahya Roslee Talip 1,2, Fakulti Psikologi dan Pendidikan, Universiti Malaysia Sabah
22.
SIKAP DAN KEMAHIRAN GURU PRASEKOLAH DALAM PENGGUNAAN TEKNOLOGI MAKLUMAT BERASASKAN KOMPUTER ( ICT ) DALAM PENGAJARAN AWAL SAINS 1,2,
23.
24.
Dg Mariam Binti Hassan1 and Baharom Mohamad2 Fakulti Psikologi dan Pendidikan, Universiti Malaysia Sabah
TEKNOLOGI PENGURUSAN PENGETAHUAN PENGARUH SIKAP, NORMA SUBJEKTIF, PERSEPSI KAWALAN GELAGAT DALAM KALANGAN PENGURUS SEKOLAH RENDAH DI SABAH 1,2
218-229
230-239
Nazarius G. Yulip1 and Sopiah Abdullah@ Siew Nyet Moi2 Faculty of Psychology and Education , Universiti Malaysia Sabah
HUBUNGAN ANTARA EFIKASI KOLEKTIF DENGAN METAKOGNISI GURU DALAM KALANGAN GURU SEKOLAH RENDAH PEDALAMAN SATU SABAH
240-253
Nick Vrynner Liah Faculty of Psychology and Education, University Malaysia Sabah 25.
PEMBANGUNAN DAN PENILAIAN PEMBELAJARAN BERBANTUKAN KOMPUTER (PBK) WEB MULTIMEDIA INTERAKTIF PENDIDIKAN JASMANI DALAM KEMAHIRAN ASAS PSIKOMOTOR SUKAN HOKI Mad Rosli bin Saraamu dan Dr. Anuar bin Din Fakulti Psikologi dan Pendidikan, Universiti Malaysia Sabah
254-261
26.
HUBUNGAN ANTARA KERJA BERPASUKAN DENGAN KEPUASAN KERJA KETUA PANITIA SEKOLAH RENDAH W.P.LABUAN
262-273
Mohammad Nizam B. Nazaruddin1, dan Diana Farahdilla Fadli2 1,2 Fakulti Psikologi dan Pendidikan, Universiti Malaysia Sabah 27.
PENGARUH SIKAP DAN PERSEKITARAN TERHADAP TINGKAH LAKU PONTENG SEKOLAH DALAM KALANGAN MURID DAERAH PENAMPANG 1,2
28.
274-283
Tairin @Noraisah Binti Lontou dan Baharom Mohamad2 Faculty of Psychology and Education, Universiti Malaysia Sabah HUBUNGAN PENGURUSAN KURIKULUM GURU BESAR DENGAN KOMITMEN DAN KEPUASAN KERJA GURU DI SEKOLAH RENDAH LUAR BANDAR DALAM DAERAH SANDAKAN.
284-289
Khairol bin Jumat ¹ Mohamad Nizam bin Nazarudin² 1,2 Fakulti Psikologi dan Pendidikan, Universiti Malaysia Sabah 29.
HUMAN SECURITY IN THE CONTEXT “FREEDOM FROM WANT”: SCHOOL AND HEALTH ACCESS OF INDONESIAN CHILD LABOUR IN THE PALM OIL PLANTATION SECTOR IN LAHAD DATU AND SANDAKAN
290-298
Dewi Herviani1, Ramli Dollah2, Kntayya Mariappan3, Wan Shawaluddin Wan Hassan4, Emilia .R5, Mohammad Faikar Adi Nugroho6, Raden Ilyas Fatahillah7 1,,5,6,7
School of Social Science, Universiti Malaysia Sabah Lecture of International Relation, School of Social Science, University Malaysia Sabah 3 Lecture of Antropology Sosiology, School of Social Science,University Malaysia Sabah
2,4
30.
A COMPARISON BETWEEN SIMPLE LINEAR REGRESSION AND RADIAL BASIS FUNCTION NEURAL NETWORK (RBFNN) MODELS FOR PREDICTING STUDENTS’ ACHIEVEMENT Haviluddin1, A. Sunarto2, Suci Yuniarti3 1
School of Engineering & Information Technology, Universiti Malaysia Sabah 2 School of Science & Technology, Universiti Malaysia Sabah 3 Faculty of Psychology and Education, Universiti Malaysia Sabah
299-308
31.
PENGUNAAN MODEL KONSTRUKTIVISME RADIKAL BAGI MENGATASI MASALAH PEMBELAJARAN PELAJAR BAGI GEOGRAFI FIZIKAL.
309-320
Ovelyn @ Ozy Matanluk Sekolah Menengah kebangsaan Sikuati, Kudat. 32.
PENDIDIKAN DAN PELATIHAN KEWIRAUSAHAAN: TELAAH TEORITIS 1,2,3
Edah Runengsih1, Eny Listiany2, Arianti3 Faculty of Business, Economic and Accountancy, University Malaysia Sabah
321-327
A COMPARISON BETWEEN SIMPLE LINEAR REGRESSION AND RADIAL BASIS FUNCTION NEURAL NETWORK (RBFNN) MODELS FOR PREDICTING STUDENTS’ ACHIEVEMENT Haviluddin1, A. Sunarto2, Suci Yuniarti3 1
School of Engineering & Information Technology, Universiti Malaysia Sabah 2 School of Science & Technology, Universiti Malaysia Sabah 3 Faculty of Psychology and Education, Universiti Malaysia Sabah
[email protected] [email protected] [email protected]
Abstract This paper presents an approach for predicting student achievements using statistics and artificial neural networks (ANN), namely linear regression and radial basis function neural network (RBFNN) methods. The data is gained from 108 students from mathematics department in Islamic University, Bengkulu, Indonesia. The results of measurement are then compared to the value of the mean of square error (MSE). The results show that MSE 0.076 with model Y = 3.193 + 0.002 for linear regression and MSE 0.003, model Y = (1)T + (0.0021) with sum-squared error goal 0.01, and spread 1 for the RBFNN. The smallest MSE value indicates a good method for accuracy. Therefore, the RBFNN model illustrates the proposed best model to predict students’ achievement. Keywords: simple linear regression, ANN, RBFNN, MSE, student achievement
INTRODUCTION Researchers widely and mostly employ the analysis model that combines statistical methods and artificial neural networks (ANNs). Thus, the use of these combined methods broadly used in finance, demography, and weather. In analysis scheme, the use of combination methods is influenced by the pattern of analysis models of particular data because each method has different sequences. The analysis model results that have high accuracy and good are very significant in decisionmaking; for example for predicting, designing and creating (Donate, Sanchez, & Miguel, 2012; Valipour, Banihabib, & Behbahani, 2013). Hence, the main factor affecting the selection of analyzing model techniques is to identify and determine based on the data characteristics. Time-series is part of data characteristics that consist of four features. They are (1) trend (T) that data have characteristics that tend to go up and down; (2) seasonal variation (S) means that type of data in the annual periodic fluctuations such as month, week and day; (3) cycles (C) refers to periodic fluctuations in the data type more than one year and; (4) random component (R) means a type of time series which is a combination of seasonal variation, trends, cycles and random factors (Chung-Fu, 2011; Ferrari-Santos, Simões da-Silva, de-Sá Silva, & da-Costa Sene, 2011; Wei, 2006). Furthermore, a time series consists of a set of observations based on time. In principle, time series are used to analyze a set of data (𝑦𝑡+1 , 𝑦𝑡+2 , … , 𝑦𝑡−𝑛 ) based on the data (𝑥𝑡+1 , 𝑥𝑡+2 , … , 𝑥𝑡−𝑛 ) in a certain time frame (Box, Jenkins, & Reinsel, 2008; Donate et al., 2012; Zhang, 2003). In this paper, simple linear regression statistical and RBFNN have been used to analyze model using trend data characteristics. This article consists of four sections. Introduction section is the motivation to do the writing of the article. Next, the literature related to the theory and techniques in forecasting time series is discussed in literature review section. Method and sampling section presents 299
the experimental results, and finally finding and discussion section describes the discussion results and research summaries.
LITERATURE REVIEW The analysis model is the first activity of modeling what will happen in the next stage based on previous data. In this paper, we conducted an comparison using the simple linear regression and RBFNN methods to analyze a model of student achievement based on learning motivation data. Next, we describe briefly about simple linear regression, RBFNN technique and learning motivation. Simple Linear Regression The simple linear regression is a way of modeling the relationship between variables in statistical analysis (Cohen, Manion, & Morrison, 2010). The objective of regression analysis is to predict a single dependent variable from the knowledge of one or more independent variables (Hair et al., 2010). When the model includes one explanatory variable (the independent variable) and one explained variable (the dependent variable), the statistical technique is called simple linear regression. The equation of simple linear regression is: 𝑌 = 𝑎 + 𝑏𝑥 Where: 𝑌: 𝑑𝑒𝑝𝑒𝑛𝑑𝑒𝑛𝑡 𝑣𝑎𝑟𝑖𝑎𝑏𝑙𝑒 𝑎 ∶ 𝑐𝑜𝑛𝑠𝑡𝑎𝑛𝑡 𝑏 ∶ 𝑐𝑜𝑒𝑓𝑓𝑖𝑐𝑖𝑒𝑛𝑡 𝑣𝑎𝑟𝑖𝑎𝑏𝑙𝑒 𝑥 ∶ 𝑖𝑛𝑑𝑒𝑝𝑒𝑛𝑑𝑒𝑛𝑡 𝑣𝑎𝑟𝑖𝑎𝑏𝑙𝑒
In using regression techniques, it is important to be aware of certain assumptions underpinning them. The assumptions should be fulfilled are normality, multicollinearity, linearity and outliers. After all of the assumptions are fulfilled, the analysis can be run. The normality of the data can be assessed by checking the measures of skewness and kurtosis. The measure of skewness is a measure of the asymmetry of a distribution. The normal distribution is symmetric and has a skewness value of 0. The measure of kurtosis indicates the extent to which the scores are “bunched” around the mean. The measures of skewness and kurtosis which is close to 0 indicate that the distribution of scores is considered approximately normal (Argyrous, 2011). In addition, to run the regression analysis, normality of the residuals for the dependent variable (the differences between calculated and observed scores) must be met. Kolmogorov-Smirnov test is used to assess the normality of the residuals for the dependent variable. To determine the multicollinearity, Tolerance and Variance Inflation Factor (VIF) value in SPSS output can be used (Hair, Black, Babin, & Anderson, 2010). Tolerance is an indicator of how much of the variability of the specified independent is not explained by the other independent variables in the model while VIF is the inverse of the Tolerance value (Pallant, 2011). If Tolerance value is not less than 0.1 or VIF value is less than 10 then there is no multicollinearity between independent variables. To assess the linearity and outliers, the scatterplot between standardized residual value and standardized prediction value is used. If the plot between standardized residual value and standardized prediction value does not make a pattern then the model is considered linear. If there are no standardized residuals that more than 3.3 or less than -3.3 then the assumption of outliers are considered fulfilled (Tabachnick & Fidell, 2007).
Artificial Neural Networks (ANNs) 300
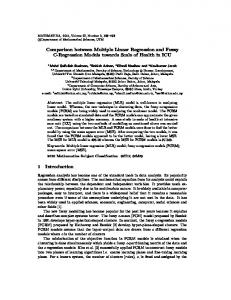
Today, artificial intelligence (AI) has influenced our life. Along with the development of software and hardware, since 1990's AI continues to evolve and be used to solve various problems in the real world (Khashei & Bijari, 2010). Technically, the existing AI grouped into: (1) searching, is used to search the optimum, (2) reasoning, reasoning, using reasoning in the results, (3) planning, generally used in manufacturing and robotic world, and (4 ) learning, use of ANNs has been trained to a conclusion (Gomes & Ludermir, 2013). ANNs is the abbreviation of artificial neural networks and a part of AI. An ANNs is a computational models inspired in the natural neurons (Badiru & Cheung, 2002; Buchanan, 2005) and influenced by ideas from many disciplines (Basheer & Hajmeer, 2000). Warren McCulloch and Walter Pitts in 1943 introduced a simple of neural networks. They proposed assigning weights in the network are set to perform simple logic function, called propagation function. Then, the propagation function results of weight are compared with the threshold functions, generated by the activation function. Then also, the combination of several simple neurons into a system will enhance the ability of neural computation. In principles, useful or not an ANNs are determined by weight training results. Radial Basis Function Neural Network (RBFNN) The RBFNN emerged as a variant of ANN in late 80’s is a kind of feed-forward neural network (FFNN). The RBFNN structure has a three-layer FFNN which includes an input layer, a hidden layer with RBF neurons and an output layer with linear neurons. Hence, RBFNN has a unique training algorithm consists of supervised and unsupervised as well (Wu-Yu & Yu, 2012). The architecture of RBFNN as shown in Figure 1. Then, the RBFNN equation is 𝑚
𝑌 = ∑ 𝑊𝑗𝑚 . 𝜑 𝑗=1
Where: 𝑌 = 𝑜𝑢𝑡𝑝𝑢𝑡 𝑣𝑎𝑙𝑢𝑒; 𝜑 = ℎ𝑖𝑑𝑑𝑒𝑛 𝑙𝑎𝑦𝑒𝑟 𝑣𝑎𝑙𝑢𝑒; 𝑊 = 𝑤𝑒𝑖𝑔ℎ𝑡𝑠 (0 − 1). The algorithm of RBFNN to analyze within time series data characteristics is: 1. Initialization of the network. 2. Determining the input signal to hidden layer, and find 𝐷𝑖𝑗 is a distance data 𝑖 to 𝑗 where 𝑖, 𝑗 = 1,2, … , 𝑄 𝑅
𝐷𝑖𝑗 = √ ∑(𝑝𝑖𝑘 − 𝑝𝑗𝑘 )2 𝑘=1
3. Find 𝑎1 is a result activation from distance data multiply bias. 2
𝑎1𝑖𝑗 = 𝑒 −(𝑏1∗𝐷𝑖𝑗) x 𝑏1 =
√−ln(0.5) 𝑠𝑝𝑟𝑒𝑎𝑑
4. Find weight and bias layers, 𝑤2𝑘 and 𝑏2𝑘 , in each 𝑘 = 1,2, … , 𝑆
301
Figure 1: The RBFNN architecture (Wu-Yu & Yu, 2012)
Learning Motivation Motivation, the powerful force behind our behavior, takes place in every field of our live including in learning (Aslan & Kirikkanat, 2013). Learning motivation can be understood as the extent to which persistent effort a student pays toward learning (Law, Lee, & Yu, 2010). What motivates learners to engage in the cognitive processes of selecting, organizing, and integrating are required for meaningful learning (Mayer, 2014). When speaking of learning motivation it should describe mechanisms that direct toward the learning goals, initiate learning activity and hold one‘s learning ability on a level that enables person to attain new information and more complex knowledge (Kovacevic, Minovic, Milovanovic, de Pablos, & Starcevic, 2013). They further suggest that context, or a form of presenting a material and learning process itself, are important when comes to the question of learning effectiveness and achievement. Experts have divided motivation into two major groups of internal motivation and external motivation (Amrai, Motlagh, Zalani, & Parhon, 2011) (Amrai et al., 2011). Intrinsic motivation is motivation in which the task is enjoyable or satisfying in itself; extrinsic motivation is motivation induced by rewards or punishments dependent upon success or failure in the task (Lina, McKeachie, & Kim, 2003). They suggest that, in college classes, grades are clearly an extrinsic reward; intrinsic motivation involves interest in the subject matter, enjoyment of challenge, or a sense of making progress and increasing mastery. Motivation is an important factor that increases students’ achievement (Tuysuz, Yildiran, & Demirci, 2010). Previous studies have identified that there is a significant relationship between learning motivation and students’ achievement (Amrai et al., 2011; Bruinsma, 2004). Some of studies also showed that learning motivation can predict students’ achievement (Choi & Kim, 2013; Moenikia & Zahed-Babelan, 2010; Steinmayr & Spinath, 2009). (Hamjah, Ismail, Rasit, & Rozali, 2011) suggest that the methods that could be implemented to improve learning motivation students are enhancement of the identified contributing factors namely the students’ personality development, lecturers’ career awareness, choice of peers, students’ spiritual connection with God, family’s encouragement, students’ financial aid and learning facilities at university. METHOD AND SAMPLING The study employed the questionnaire with five point Likert-scales to obtain the data about learning motivation. To gain the data of students’ achievement, the GPA data was used. The GPA data were gathered from the academic unit of Islamic University, Bengkulu. The data were collected from 2005-2013. A total of 108 students from mathematics department in Islamic University, Bengkulu were chosen as sample. The data of learning motivation and students’ achievement (GPA) can be seen in Appendix A. The data was then analyzed using Statistical Package for Social Sciences (SPSS) version 16.0 and MATLAB R2012a. The simple linear regression analysis and RBFNN were engaged.
302
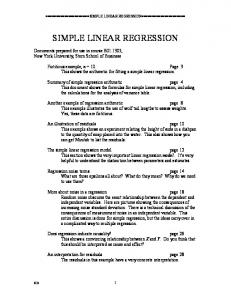
FINDINGS AND DISCUSSIONS Analysis using Simple Linear Regression Method Before running simple linear regression analysis, there are assumptions should be fulfilled. First, the normality of the data must be fulfilled. The skewness and kurtosis of GPA were 0.162 and 0.125 respectively while the skewness and kurtosis of learning motivation were -0.147 and -0.275. The measures of skewness and kurtosis of the variables were close to 0. It means that the distribution of GPA and learning motivation were considered normally distributed. Beside the data of dependent variable is normally distributed, normality of the residuals for the dependent variable (the differences between calculated and observed scores) must be met in regression analysis. In this case, residuals for GPA scores should be approximately normally distributed. To determine the normality of residual mathematics anxiety scores, Kolmogorov-Smirnov test was used. The result showed that the Sig. Value was 0.143, more than 0.05. It means that the residual for GPA scores is normally distributed. Therefore, the normality of the residual for dependent variable is fulfilled. The next assumption must be met in regression analysis is multicollinearity. To determine the multicollinearity, Tolerance and Variance Inflation Factor (VIF) value in SPSS output were used. Tolerance value of learning motivation was 1.0 which is not less than 0.1. In addition, the VIF value of learning motivation was 1.0 which is less than 10. It means that there is no multicollinearity between them. In other words, the assumption of multicollinearity is fulfilled. To determine linearity and outliers, the scatterplot between standardized residual value and standardized prediction value of GPA can be used. Based on Figure 1, the scatterplot does not make a pattern so the model is considered linear. In addition, there were no standardized residuals that more than 3.3 or less than -3.3. Therefore, there were no outliers in the data so the assumption for outliers is fulfilled. Because of the assumptions were fulfilled, the regression analysis can be run.
Figure 2: Scatterplot between Standardized Residual Value and Standardized Prediction Value of GPA
The result of the simple linear regression analysis can be seen in Table 1.
303
Model 1
Table 1: The Result of Simple Linear Regression Analysis Sum of Squares df Mean Square F
Regression
.076
1
Residual
6.641
106
Total
6.717
107
.076 .063
1.210
Sig. .274a
a. Predictors: (Constant), Motivation_X b. Dependent Variable: GPA_Y
Analysis using RBF Technique In the second analysis, student achievement data were tested using RBFNN technique. Based on ANNs rules, the data were divided into training and testing data. The training data were selected from 2005 to 2011 or contained 84 data points and 2012-2013 or 24 data points were used as testing data. Creating a precise neural network by 𝑛𝑒𝑤𝑟𝑏(𝑃, 𝑇, 𝑒𝑟𝑟𝑜𝑟_𝑔𝑜𝑎𝑙, 𝑠𝑝𝑟𝑒𝑎𝑑) function, which is this function creates RBFNN structure, automatically selected the number of hidden layer and made the error to 0. For the sum-square error (SSE) goal values are 0.01, 0.02, and 0.03. Spread is the density of basis function, then spread value of 1 was settled.
304
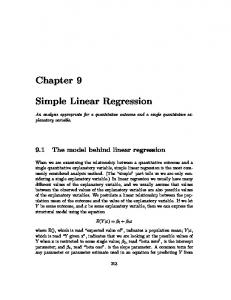
Figure 3: The RBFNN results with SSE 0.01, 0.02, and 0.03
CONCLUSION AND FUTURE WORK In this paper, the analysis using statistical and AI methods to achieve the model of students’ achievement have been conducted in the Islamic University, Bengkulu. According to Figure 3, the results of linear regression analysis show that MSE value is 0.076 with regression Y = 3.193 + 0.002. In addition, the results of RBFNN shows that for SSE = 0.01 then MSE value is 0.003 with regression Y = (1)T + (0.0021), for SSE = 0.02 then MSE value is 0.016 with regression Y = (1)T + (0.013), and for SSE = 0.03 then MSE value is 0.026 with regression Y = (1)T + (0.02). Indicator test result of data is the smallest error value, where value indicating an error testing is the best model (Wu-Yu & Yu, 2012). Therefore, the determination of the best model is determined by selecting the smallest value of testing error. Based on the results, RBFNN has the smallest value of testing error. Thus, the test results of RBFNN are considered closer to the actual value. In other words, the RBFNN model illustrates the proposed best model to predict students’ achievement. Table 2: Comparison model simple linear regression and RBFNN
Method Linear regression RBFNN with spread = 1 SSE goal = 0.01 SSE goal = 0.02 SSE goal = 0.03
MSE 0.076
Model Y = 3.193 + 0.002
0.003 0.016 0.026
Y = (1)T + (0.0021) Y = (1)T + (0.013) Y = (1)T + (0.02)
ACKNOWLEDGMENTS The paper is supported by the Consulate General of the Republic Indonesia (KJRI), Kota Kinabalu, Sabah-Malaysia. The authors thank to the editors “International Conference on Education (ICEdu14)”, and the Universitas Negeri Jakarta-Universiti Malaysia Sabah reviewers for helpful comments and suggestions. REFERENCES Amrai, K., Motlagh, S. E., Zalani, H. A., & Parhon, H. (2011). The relationship between academic motivation and academic achievement students. Procedia Social and Behavioral Sciences, 15(2011), 399–402. Argyrous. (2011). Statistics for Research: With a guide to SPSS. Aslan, A. E., & Kirikkanat, B. (2013). Achievement and motivation: A different perspective on familiar concepts. Procedia Social and Behavioral Sciences, 106(2013), 308-316. Badiru, A. B., & Cheung, J. Y. (2002). FUZZY ENGINEERING EXPERT SYSTEMS WITH NEURAL NETWORK APPLICATIONS.
305
Basheer, I. A., & Hajmeer, M. (2000). Artificial neural networks: fundamentals, computing, design, and application. Journal of Microbiological Methods, 43(2000), 3-31. Box, G. E. P., Jenkins, G. M., & Reinsel, G. C. (2008). Time Series Analysis Forecasting and Control : Fourth Edition. Bruinsma, M. (2004). Motivation, cognitive processing and achievement in higher education. Learning and Instruction, 14(2004), 549–568. Buchanan, B. G. (2005). A (Very) Brief History of Artificial Intelligence. American Association for Artificial Intelligence. Choi, K. H., & Kim, D. Y. (2013). A cross cultural study of antecedents on career preparation behavior: Learning motivation, academic achievement, and career decision self-efficacy. Journal of Hospitality, Leisure, Sport &Tourism Education, 13(2013), 19–32. Chung-Fu, T. (2011). A review on time series data mining. Engineering Applications of Artificial Intelligence, 24(2011), pp. 164 - 181. doi: 10.1016/j.engappai.2010.09.007 Cohen, L., Manion, L., & Morrison, K. (2010). Research Methods in Education. (6th edition). Donate, J. P., Sanchez, G. G., & Miguel, A. S. D. (2012). Time Series Forecasting. A Comparative Study Between An Evolving Artificial Neural Networks System And Statistical Methods. International Journal on Artificial Intelligence Tools, 21(1 1250010). doi: 10.1142/S0218213011000462 Ferrari-Santos, A. C., Simões da-Silva, J. D., de-Sá Silva, L., & da-Costa Sene, M. P. (2011). Network traffic characterization based on Time Series Analysis and Computational Intelligence. Journal of Computational Interdisciplinary Sciences, 2(3), pp. 197-205. doi: 10.6062/jcis.2011.02.03.0046 Gomes, G. S. d. S., & Ludermir, T. B. (2013). Optimization of the weights and asymmetric activation function family of neural network for time series forecasting. Expert Systems with Applications, 40(2013), 6438–6446. doi: http://dx.doi.org/10.1016/j.eswa.2013.05.053 Hair, J. F., Black, W. C., Babin, B. J., & Anderson, R. E. (2010). Multivariate Data Analysis: A Global Perspective. (7th edition). Hamjah, S. H., Ismail, Z., Rasit, R. M., & Rozali, E. A. (2011). Methods of increasing learning motivation among students. Procedia Social and Behavioral Sciences, 18(2011), 138–147. Khashei, M., & Bijari, M. (2010). An artificial neural network (p, d,q) model for timeseries forecasting. Expert Systems with Applications, 37 (2010), 479–489. doi: 10.1016/j.eswa.2009.05.044 Kovacevic, I., Minovic, M., Milovanovic, M., de Pablos, P. O., & Starcevic, D. (2013). Motivational aspects of different learning contexts: ‘‘My mom won’t let me play this game. . .’’. Computers in Human Behavior, 2(2013), 354–363. Law, K. M. Y., Lee, V. C. S., & Yu, Y. T. (2010). Learning motivation in e-learning facilitated computer programming courses. Computers & Education, 55(218–228.). Lina, Y. G., McKeachie, W. J., & Kim, Y. C. (2003). College student intrinsic and/or extrinsic motivation and learning. Learning and Individual Differences, 13(2003), 251–258. Mayer, R. E. (2014). Incorporating motivation into multimedia learning. Learning and Instruction, 29(2014), 171-173. Moenikia, M., & Zahed-Babelan, A. (2010). A study of simple and multiple relations between mathematics attitude, academic motivation and intelligence quotient with mathematics achievement. Procedia Social and Behavioral Sciences, 2(2010), 1537–1542. Pallant, J. (2011). SPSS Survival Manual: A step by step guide to data analysis using SPSS. (4th edition). . Steinmayr, R., & Spinath. (2009). The importance of motivation as a predictor of school achievement. Learning and Individual Differences, 19(2009), 80–90. Tabachnick, B. G., & Fidell, L. S. (2007). Using Multivariate Statistics. (5th edition). Tuysuz, M., Yildiran, D., & Demirci, N. (2010). What is the motivation difference between university students and high school students? Procedia Social and Behavioral Sciences, 2(2010), 1543– 1548. Valipour, M., Banihabib, M. E., & Behbahani, S. M. R. (2013). Comparison of the ARMA, ARIMA, and the autoregressive artificial neural network models in forecasting the monthly inflow of
306
Dez dam reservoir. Journal of Hydrology, 476(2013), 433–441. doi: http://dx.doi.org/10.1016/j.jhydrol.2012.11.017 Wei, W. W. S. (2006). Time Series Analysis Univariate and Multivariate Methods Second Edition. Wu-Yu, J., & Yu, J. (2012). Rainfall time series forecasting based on Modular RBF Neural Network model coupled with SSA and PLS. Journal of Theoretical and Applied Computer Science, 6(2), 3-12. Zhang, G. P. (2003). Time series forecasting using a hybrid ARIMA and neural network model. Neurocomputing, 50(2003), 159 – 175. doi: S0925-2312(01)00702-0
307
Appendix A: Data Sample of GPA and Learning Motivation
Year 2005
2006
2007
Learning GPA Motivation (LM) 3.22 3.80 3.30 3.02 3.76 3.55 3.49 3.41 3.15 3.66 3.50 3.47 3.27 3.27 3.72 3.52 3.26 3.76 3.63 3.77 3.63 3.02 3.04 3.52 3.46 3.24 3.27 3.23 3.70 3.31 3.06 3.31 3.05 3.22 3.13 3.47
Year
83 2008 97 106 115 112 92 93 84 88 120 81 103 119 2009 102 99 99 112 103 106 120 117 99 86 108 112 2010 118 110 104 87 87 98 106 110 93 120 96
Learning GPA Motivation Year (LM)
Learning GPA Motivation (LM)
3.76 3.10 3.41 3.53 3.78 3.20 3.57 3.67 3.08 3.18 3.24 3.78 3.71 3.32 3.18 3.64 3.60 3.08 3.68 3.75 3.52 3.53 3.31 3.21 3.36 3.28 3.63 3.17 3.11 3.34 3.78 3.40 3.34 3.03 3.20 3.05
3.78 3.68 3.21 3.02 3.19 3.44 3.47 3.69 3.05 3.15 3.66 3.42 3.55 3.00 3.66 3.31 3.38 3.27 3.28 3.19 3.23 3.40 3.70 3.30 3.54 3.76 3.12 3.06 3.65 3.59 3.79 3.98 3.26 3.73 3.27 3.91
88 2011 99 112 116 92 107 112 117 86 86 114 119 81 2012 111 110 102 89 80 91 105 105 82 118 109 116 2013 83 100 85 87 114 86 97 95 115 108 113
102 101 93 112 106 107 101 101 107 90 114 115 98 90 118 82 117 117 81 88 109 83 91 81 105 117 82 80 112 105 110 93 90 120 92 90
308
6 Authors Haviluddin was born in Loa Tebu, East Kalimantan, Indonesia. He graduated from STMIK WCD Samarinda in 2005 in the field of Management Information, and he completed a Master Degree at Gadjah Mada University, Yogyakarta in 2009 in the field of Computer Science. He is also a Lecturer in the Faculty of Mathematic and Natural Science, Universitas Mulawarman, East Kalimantan, Indonesia. Currently, he is pursuing his Ph.D in the field of Computer Science at the School of Engineering and Information Technology, Universiti Malaysia Sabah, Malaysia.
Andang Sunarto was born in Cilacap, Central Java, Indonesia. He graduated from Universitas Islam Indonesia, Yogyakarta in 1999 in the field of Information Technology, and he completed a Master Degree at Gadjah Mada University, Yogyakarta in 2004 in the field of Computer Science. He is also a Lecturer in the Faculty of Sharia and Islamic Economics, Institut Agama Islam Negeri Bengkulu, Sumatera, Indonesia. Currently, he is pursuing his Ph.D in the field of Applied Science at the School of Science and Technology, Universiti Malaysia Sabah, Malaysia.
Suci Yuniarti was born in Tegal, Central Java, Indonesia. She graduated from Universitas Negeri Malang, in 2009 in the field of Mathematic Education. Currently, she is pursuing her Master in the field of Mathematic Education at the School of Education and Social Development, Universiti Malaysia Sabah, Malaysia.
View publication stats