IEEE TRANSACTIONS ON INFORMATION THEORY, VOL. 59, NO. 5, MAY 2013
3189
A Compression Model for DNA Multiple Sequence Alignment Blocks Luís M. O. Matos, Diogo Pratas, and Armando J. Pinho, Member, IEEE
Abstract—A particularly voluminous dataset in molecular genomics, known as whole genome alignments, has gained considerable importance over the last years. In this paper, we propose a compression modeling approach for the multiple sequence alignment (MSA) blocks, which make up most of these datasets. Our method is based on a mixture of finite-context models. Contrarily to other recent approaches, it addresses both the DNA bases and gap symbols at once, better exploring the existing correlations. For comparison with previous methods, our algorithm was tested in the multiz28way dataset. On average, it attained 0.94 bits per symbol, approximately 7% better than the previous best, for a similar computational complexity. We also tested the model in the most recent dataset, multiz46way. In this dataset, that contains alignments of 46 different species, our compression model achieved an average of 0.72 bits per MSA block symbol. Index Terms—Finite-context models, genomics, lossless compression, multiple sequence alignments (MSAs), whole genome alignments.
I. INTRODUCTION
O
VER the past years, impressive progress has been made in DNA sequencing. The genomes of many species, some of them very large, are now available and are increasing in number and size at a fast pace. This progress caused a significant growth in the amount of data available in public databases, including those related to whole genome alignments. Recently, Hanus et al. [1] proposed a modeling strategy for whole genome alignment data, relying on well-established statistical evolutionary models for representing the DNA bases and on a context-based modeling approach for representing the alignment gaps. This resulted in a sophisticated method capable of attaining coding performances much better than the popular Lempel-Ziv (LZ)-based coding techniques. The algorithm assumes independence between the insertion/deletion mutational process and the evolutionary nucleotide substitution process. Based on this assumption, the positions of the gaps and the nucleotides in the alignment are encoded independently. Manuscript received May 18, 2012; revised October 19, 2012; accepted December 05, 2012. Date of publication January 18, 2013; date of current version April 17, 2013. This work was supported in part by FEDER through the Operational Program for Competitiveness Factors and by National Funds through the Foundation for Science and Technology in the context of the projects FCOMP-01-0124-FEDER-010099 (FCT reference PTDC/EIA-EIA/103099/2008) and FCOMP-01-0124-FEDER-022682 (FCT reference PEst-C/EEI/UI0127/2011). The authors are with the Signal Processing Laboratory, the Institute of Electronics and Telematics Engineering of Aveiro, and the Department of Electronics, Telecommunications and Informatics, University of Aveiro, 3810-193 Aveiro, Portugal (e-mail:
[email protected];
[email protected];
[email protected]). Communicated by O. Milenkovic, Associate Editor for Coding Theory. Digital Object Identifier 10.1109/TIT.2012.2236605
The nucleotides are compressed using appropriate modeling of genome evolution. The gap positions, resulting from the insertion/deletion mutational process, are encoded using prediction techniques inspired by lossless binary image compression methods. In this paper, we propose an alternative approach for modeling and compressing whole genome alignment data. Instead of separating the data into two different sources (DNA bases and gaps), handled independently, we build a model that addresses both the DNA bases and the alignment gaps at once. This new modeling strategy allows exploring additional data correlations not considered by the Hanus et al. approach, such as intercolumn dependences and base/gap relations, resulting in further coding gains. Whole genome alignments are important datasets that provide the opportunity to study and analyze the evolutionary process of several species (vertebrate and mammalian, for example). In the next section, we explain in more detail this particular genomic dataset. The University of California at Santa Cruz comparative genomics group and the Ensemble Compara project [2] both provide genome alignment datasets, requiring hundreds of gigabytes of storage, that are growing in size in every new release. In this paper, to allow a direct comparison with the results attained by the method proposed by Hanus et al. [1], we also use the multiz28way [3] dataset for assessing the performance of the compression models (this set includes alignments of 28 vertebrate genome sequences). Besides this dataset, we also provide compression results regarding the most recent dataset available, multiz46way that contains alignments of 46 different species. The compression of DNA sequences has proved to be a difficult problem, even when using high complexity models. Some of the best compression algorithms require an average of at least 1.7 bits per symbol (bps) [4]–[7], for a maximum of . In the whole genome alignment case, we consider a five letter alphabet, , that includes each of the four bases, denine, ytosine, uanine, and hymine, and where symbol “ ” represents a missing entry (i.e., an alignment gap). An uniformly distributed and independent sequence drawn from this alphabet requires to be stored. The modeling method that we propose, using a mixture of finite-context models, attains rates around 0.94 bps on the multiz28way dataset, about 7% less than the method reported in [1]. This is considerably less than the 1.7 bps average value that is usually attained in single sequences because, even having a larger alphabet, the correlation among the data is also larger, as explained in the following sections.
0018-9448/$31.00 © 2013 IEEE
3190
IEEE TRANSACTIONS ON INFORMATION THEORY, VOL. 59, NO. 5, MAY 2013
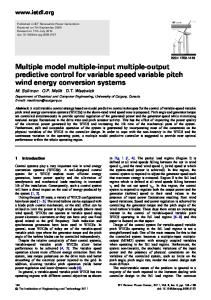
Fig. 1. Example of alignment of five homologous sequences and the estimated maximum a posteriori common ancestor nucleotide for each column.
II. WHOLE GENOME ALIGNMENTS Computational genome annotations and evolutionary genomics are two molecular biology research areas that use multiple genome alignment data. The alignment of DNA sequences has been used to help locating certain kinds of functional noncoding regions [8] and more recently for finding protein-coding genes [9], [10] and noncoding RNA genes [11]. Moreover, it is possible to observe the similarities and differences between the DNA sequences of humans and other species that share a common ancestral, providing critical data for finding the course of evolution. Furthermore, we can also perform a computational reconstruction of ancestral genome sequences that explains certain characteristics of species [3]. DNA sequences that have evolved from the same ancestral sequence are called homologous. In the case of genes, they are likely to encode similar functions and each function that is experimentally verified in one species can be mapped to a homologous gene in other species. The detection of homologous sequences in different genomes is a computationally nontrivial task, because different genomes of different species can greatly differ due to mutations that occurred during the species evolution [12]. There are two kinds of mutations that can be found in the genome. The first one, known as large-scale mutations, affect large regions, leading to reorganizations of the whole genome. Duplications, deletions, insertions, inversions, and transactions are examples of large-scale mutations that can occur through genetic recombination of the DNA [25]. The second one, the small-scale mutations, affects the DNA sequence only locally, changing a single or several neighboring nucleotides. There are three subtypes of small-scale mutations that affect DNA: substitutions, insertions, and deletions. In a substitution, a DNA nucleotide is changed by another one. Insertion and deletion mutations (InDels) remove/insert a single or multiple nucleotides from/into the DNA sequence [13]. Due to large-scale mutations, different genomes can greatly differ in size, which is a problem if we want to compare different genomes. The process of sequence alignment is used to describe parts of the genome that have evolved from a common ancestor. The algorithm is usually divided in two main steps. In the first step, homologous regions in different species are identified. Homologous regions that have diverged considerably cannot be identified properly, since they cannot be distinguished from the other nonhomologous ones. In the second step, the identified homologous sequences from different species are properly aligned into several multiple sequence alignment (MSA) blocks, accounting for substitutions and small-scale InDels. The missing
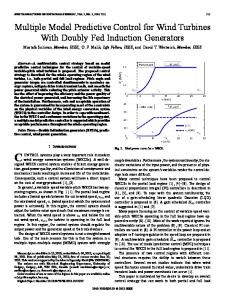
Fig. 2. Part of the tree presented in [3], which indicates the assumed evolutionary relationships among the sequences in the 28-way alignment. The branch lengths are proportional to the average number of substitutions per site (adapted from [3]).
entries caused by the InDels are filled with a gap symbol “ .” First, the evolutionary closest sequences are aligned. Then, the process is progressively repeated, until all identified homologous sequences have been included into a single MSA block [14]. In Fig. 1, we can find a small MSA example of homologous sequences from the human, platypus, chicken, lizard, and zebrafish genomes. The gaps that were inserted in positions 9–15 were likely caused by a deletion in the lizard genome. On the other hand, the gaps in positions 21–28 were probably caused by an insertion in the chicken genome. A part of the phylogenetic tree describing the evolutionary relationship of the 28 vertebrates is depicted in Fig. 2. There are several MSA algorithms [15]–[21] and the most recent rely on heuristic optimization strategies and require
MATOS et al.: COMPRESSION MODEL FOR DNA MULTIPLE SEQUENCE ALIGNMENT BLOCKS
huge computational resources. Despite the computational requirements, we can find alignments of whole genomes in large databases, such as those of UCSC [22] and Ensembl [23]. Each multiple alignment format file contains several MSA blocks derived from the genome rearrangements caused by large-scale mutations. The datasets, used for testing in this paper, contain alignment blocks from 1 up to 28 (or 46) species. The human sequence is used as a reference to align the genome sequences of the other species, meaning that the human homologous sequence is always present in each MSA block. However, there are MSA blocks with a single line, which means that the human genome sequence is not alignable with other species. Each file of the dataset corresponds to a single human chromosome, containing all MSA blocks of that chromosome.
III. RELATED WORK To our knowledge, the only algorithm proposed so far for the compression of whole genome alignments was introduced by Hanus et al. [1]. Their method is based on well-established statistical evolutionary models and on prediction techniques used for lossless binary image compression. In their proposed evolutionary-based compression scheme, the nucleotides in a MSA block are compressed using the predictions obtained from a nucleotide substitution model, whereas the gaps are encoded independently using techniques from lossless binary image compression. According to them, encoding the nucleotides and the gaps separately is justified by the independence of the two underlying mutational processes and should not introduce an inherent loss to the achievable compression rate. In this section, we will describe briefly the algorithm proposed in [1]. A. Nucleotides Compression Regarding the compression of the nucleotides, Hanus et al. proposed two encoding approaches, both relying on statistical evolutionary models that describe the evolutionary relationships between homologous nucleotides. The nucleotides in each MSA block column are homologous in the sense of sharing a common ancestor. In Fig. 2, we have a portion of a phylogenetic tree with 18 species out of 28 from the multiz28way dataset. The full phylogenetic tree of the multiz28way dataset, has 28 branches with length , describing the evolutionary relationship between the several species. For each MSA block, a subtree corresponding to the species that occur in the MSA block is created. Then, for each alignment column , the set of species leaf nodes , corresponding to the homologous nucleotides actually observed in this column, is determined first. The gaps are removed, leading to the vector of homologous nucleotides , observed in the column. The evolutionary relationship of the species leaf nodes is described by a subtree of the full phylogenetic tree . In order to compute the probability of observing a set of homologous nucleotides in different species, given the evolutionary model relating the species, the Felsenstein algorithm
3191
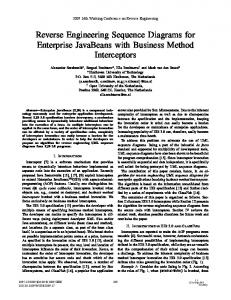
Fig. 3. (Left) Best main context of depth 4. (Right) Edge contexts: (a) first column, (b) first row, and (c) second row. The position to be encoded is denoted by “X” (adapted from [1]).
[26] is used. This algorithm allows us to calculate the likelihood on a tree, using an efficient iterative procedure. The obtained probabilities for each column can then be used for driving an arithmetic encoder. This columnwise approach represents an optimal encoding strategy given the evolutionary model. However, it is only feasible for a small number of nucleotides per column. Therefore, the authors decided to use an alternative encoding scheme, based on a representative common ancestor. A representative common ancestor nucleotide is encoded for each column together with a set of conditional probabilities, , of all leaf nucleotides observed in that is a function column. This representative common ancestor of the column realization and is chosen with the aim of minimizing the number of bits required to encode column (1) corresponds to The estimated common ancestor nucleotide the maximum likelihood estimate under the assumption that the nucleotides have evolved independently.
B. Gaps Compression The gaps in the MSA blocks result from the alignment process. In [1], the gaps are compressed by considering each MSA block as a binary image, where the presence of a gap is signaled with one of the two possible pixel values (e.g., 1) and the four DNA bases with the other pixel value (e.g., 0). This binary image, also known as a puncturing matrix, is compressed using a template-driven prediction compression algorithm and arithmetic entropy coding. In order to choose a suitable context template, the authors tried several context sizes and configurations and concluded that the best context should be of size 4 (depicted in Fig. 3 as the “main context”). As can be seen, there are different contexts to encode the first two rows and also the first column (see Fig. 3). In order to be able to use the edge contexts, it is necessary to encode the first column and the first two rows, separately. Moreover, the puncturing matrix compressor was also compared to other state-of-the-art approaches for the lossless compression of binary images, including JBIG and JBIG2, outperforming them.
3192
IEEE TRANSACTIONS ON INFORMATION THEORY, VOL. 59, NO. 5, MAY 2013
IV. PROPOSED COMPRESSION MODEL
B. Mixing the Probabilities
A. Finite-Context Modeling The proposed approach is based on a mixture of finite-context models. Finite-context models have been used for single DNA sequence compression [6], [7]. However, in this case, we are dealing with multiple DNA sequences divided into several MSA blocks, where the size of these blocks ranges from 1 row to several rows. In our approach, we consider each MSA block as a special image, where each pixel/position can have only five different values from the alphabet . For each MSA block, we assign probability estimates for each symbol in , regarding the next outcome, according to a conditioning context computed over a finite and fixed number of past outcomes (order- finite-context model [27] with states). The probability estimates are calculated using symbol counts that are accumulated while the MSA block is processed, making them dependent not only on the past symbols, but also on . We use the estimator (2)
Our modeling approach is based on a mixture of probability estimates. In order to compute the probability estimate for a certain symbol, it is necessary to combine the probability estimates given by (2) using (5). The weight assigned to model can be computed according to (7) i.e., by considering the probability that model has been generated by the sequence until that point. In that case, we would get (8) where denotes the likelihood of sequence being generated by model and denotes the prior probability of model . Assuming (9) where
denotes the number of models, we also obtain (10)
Calculating the logarithm, we get
where represents the number of times that, in the past, symbol was found having as the conditioning context and where
(11a) (11b)
(3) is the total number of events that has occurred so far in association with context . Parameter allows balancing between the maximum likelihood estimator and an uniform distribution (when the total number of events, , is large, it behaves as a maximum likelihood estimator). For , (2) is the well-known Laplace estimator. The per symbol information content average provided by the finite-context model of order- , after having processed symbols, is given by
which is related to the code length that would be required by model for representing the sequence . It is, therefore, the accumulated measure of the performance of model until instant . DNA sequences are known to be nonstationary. Due to this fact, a good performance of the model in a certain region of the sequence might not be attained in other regions. In order to obtain a good performance in each model, we decided to use a mechanism of progressive forgetting of past performances. This mechanism allows each model to progressively forget the past and, consequently, to give more importance to the most recent past. Therefore, we rewrite (11b) as
(4)
(12a)
bits per symbol. When using several models simultaneously, the can be viewed as measures of the performance of those models until that instant. Therefore, the probability estimate can be given by a weighted average of the probabilities provided by each model, according to
(12b) where Defining
dictates the forgetting factor to be used.
(5) (13) where
denotes the weight assigned to model
and and removing the logarithms, we can rewrite (11) as (6)
(14)
MATOS et al.: COMPRESSION MODEL FOR DNA MULTIPLE SEQUENCE ALIGNMENT BLOCKS
3193
Fig. 4. Context templates used. “X” indicates the current symbol.
and, finally, set the weights to (15)
C. Typical Image Templates As mentioned previously, we are treating each MSA block as a special image with five intensities (five different symbols). We process the symbols of each block in a raster scan order, as in typical sequential image coding. Fig. 4 shows the context templates used. Templates T4 and T10 are typically found in the context of image compression. Template T4 is smaller than T10, which allows us to capture more reliable statistical information in smaller MSA blocks. On the contrary, template T10 is better at capturing statistical information in larger MSA blocks. The last template T9 is more specific for this kind of data, trying to explore as much as possible the correlation along the columns (see Fig. 1).
Fig. 5. (Top) Small piece of the block presented in Fig. 1. (Bottom) ACM. After encoding each line, the most frequent symbol per column is computed and inserted in the ancestral line.
Algorithm 1 Require: A
.
Require: An integer D. Ancestral Context Model (ACM) The ACM is a special model that explores the correlation between the symbols of each column in the MSA blocks. This ancestral model uses the most frequent symbol per column as a context symbol that can be used for defining the conditioning states of this model. In order to understand more easily the ACM, we present in Fig. 5 a small example. This figure shows a small portion of the MSA block presented at the top of Fig. 1. The ACM is basically an ancestral line with symbols, where is the number of columns of the current MSA block. For each block that is processed, the algorithm initializes a line with an arbitrary symbol (e.g., “ ”). After processing each symbol, the algorithm computes the most frequent symbol for the current column, from the first row until the current one. The most frequent symbol is inserted in the ancestral line to be used later. The information of the ancestral line after processing several rows will be very similar to the estimated ancestor line depicted in Fig. 1. Algorithm 1 describes how the ancestral line is updated during the compression of each MSA block. The presented algorithm only computes the most frequent symbol in a specific column when processing row . In the end, it will return the most frequent symbol. As can be seen, the loop in line 4 computes the frequencies of each symbol in the current column from the first row until the current row (including the current row). Since this update process is performed after encoding the current symbol, then the encoded symbol is also available at the decoder at this point. The loop in line 9 is responsible for obtaining the most frequent symbol or in the case of a tie the symbol closest to the current row.
. .
Require: An integer
Ensure: The most frequent symbol of the current column. 1: for all
do
2: 3: end for {Loop the current column symbols} 4: for
to
do
5: 6: 7: end for { stores the most frequent symbol in the current column} 8: 9: for all 10:
do if
11: 12:
end if
13: end for 14: return
then
3194
IEEE TRANSACTIONS ON INFORMATION THEORY, VOL. 59, NO. 5, MAY 2013
TABLE I SIMULATION RESULTS, IN BITS PER SYMBOL, USING ONLY THE ACM, FOR DIFFERENT CONTEXT SIZES AND FOR THE MULTIZ28WAY DATASET. THE FIRST COLUMN (DENOTED AS “LEFT”) INDICATES THE NUMBER OF SYMBOLS USED ON THE LEFT-HAND SIDE OF THE SYMBOL TO ENCODE. THE FIRST ROW INDICATES THE NUMBER OF SYMBOLS USED IN THE ACM ON THE RIGHT-HAND SIDE OF THE SYMBOL TO ENCODE. THE RESULTS SHOW THAT FOR THE MULTIZ28WAY DATASET, THE BEST DIZES ARE LEFT—2, RIGHT—5
Fig. 6. Portion of the ancestral line used. “X” denotes the current symbol to be encoded. We used two symbols on the left-hand side part of ACM and five symbols on the right-hand side part. The combination of the left- and right-hand in the figure, results in an side parts and of the central symbol, denoted as order-7 ACM.
During the compression of each MSA block, we have an ancestral context line with statistical information regarding the most frequent symbol per column. However, we only need a small portion of the ancestral line. In order to obtain the size of the ancestral context line that maximizes the compression ratio, we ran some simulations for different sizes using only the ACM. In Fig. 6, we show an example of an MSA block and layout of the ancestral line. After performing the simulations using the multiz28way dataset, we obtained the results that are listed in Table I. According to these results, the sizes of left- and right-hand side parts of the ACM that minimize the average number of bits per symbol is, respectively, 2 and 5. Therefore, we chose an ACM with size 7 (2 left + 5 right + 1 center) to perform the rest of our simulations. E. Static Column Model (SCM) Due to the fact that the arithmetic coding uses probability estimates of each symbol, we can define an order-0 model that explores the strong correlation that is present in each column. The SCM uses the probabilities of each symbol per column to encode the current symbol. In Fig. 7, we show a small example that explains how this model works. In this example, we are processing row number 5, meaning that the probabilities of each symbol must be calculated using only the information of rows 1–4. Suppose that we were encoding the symbol positioned at the fifth row and third column. According to Fig. 7, a relative
Fig. 7. SCM example. After processing the first four rows, the algorithm computes the probability of each symbol per column (bottom). The computed probabilities are used to encoded the symbols of row 5.
frequency of 1/4 will be used by the probability estimator for compressing symbol “ .” F. Column Model (CM) The SCM is a model that explores correlations along a MSA block column. However, it could be also interesting to reuse the statistical information of the previous columns to encode symbols of other MSA columns. For this purpose, we propose a CM of order 5, which corresponds to the number of symbols of the alphabet. In this case, instead of using the neighboring symbols of the current symbol to define the conditioning context (see Section IV-C), the CM uses the frequency of each symbol of the current column to build a small context. In order to understand more easily this model, we present a small example in Fig. 8 that shows how the context for each column is created. Considering that we are processing the symbol at position (5, 2), the context that is used to encode symbol “ ” is denoted as “Context 2” in Fig. 8. After analyzing column 2 of Fig. 8, the symbols, sorted by frequency in a nonascending order, are ACTG-. The sorting process that is used to create the context is described in the loop on line 11 of Algorithm 2. Using this model, it is possible to combine contexts that are very similar due to the statistical similarity of their columns. For example, in Fig. 8, contexts 5 and 8 are similar, because after computing the statistics of each symbol in each column using Algorithm 2, the resulting context is the same.
MATOS et al.: COMPRESSION MODEL FOR DNA MULTIPLE SEQUENCE ALIGNMENT BLOCKS
3195
Algorithm 2 Require: A
. .
Require: An integer Require: An integer
.
Ensure: The conditioned context of the current symbol. 1: 2: for
to
do
3: Fig. 8. CM example. Contexts 1–8 are used to encode the first eight symbols of row 5. Each context is built sorting the symbols of each column by its frequency in a nonascending order.
4: end for 5: 6:
V. RESULTS
7: {Loop the current column symbols and update frequencies of each symbol.} 8: for
to
do
9: 10: 11: end for {Sort the symbols in a nonascending order using its frequency.} 12: for
to
do
13: 14:
for
15:
to if
do then
16: 17: 18: 19: 20: 21:
end if end for {Build the context combining the symbols, first the most frequent and then the less frequent ones, using a concat operation (operator ).
22: 23: end for 24: return
We used two datasets in our simulations: the multiz28way, also used by Hanus et al. [1], and the most recent dataset, with 46 species, multiz46way. As mentioned previously, our algorithm is based on a mixture of several models that are combined in order to compute the probabilities that are communicated to the arithmetic encoder. We have performed several simulations for understanding which models should be included in the mixture. Fig. 9 depicts the results obtained using several combinations. We show only the best combinations, due to the large number of all possible arrangements. T4, T9, and T10 denote the models based on the templates presented in Fig. 4. SCM, CM, and ACM correspond to the SCM, CM, and ACM, respectively. The results indicate that the SCM generates worse results, when compared to the CM and ACM models. The combination with CM and ACM provides similar results. However, the mixture T4+T9+T10+ACM seems to be the one that provides the best compression results and, for this reason, it was chosen. In Section IV-B, we have explained how the mixture of models is performed. Because this mixture depends on a parameter , we investigated how the performance is related to the value of . Fig. 10 displays this relation, where it can be observed that the providing the best results is between 0.95 and 0.96. For , the global compression results is about 0.93930 bps. On the other hand, for , the compression is about 0.93934 bps. Since the variation is minimal, we decided to use 0.95 as the default value. Table II presents the overall compression ratio for different alignment files and for the whole multiz28way and multiz46way datasets. The “FcmMxMSA” column contains the results attained by the compression approach proposed in this paper, including the additional information required by the decoder for recovering the MSA blocks, such as the size of each block. Table II contains also the results attained by the method proposed by Hanus et al. [1] (only for the multiz28way, because the available software, MSAc, could not handle the multiz46way dataset), and by LZ compression. As can be seen, on average, the proposed method requires less than 1 bps for compressing the MSA blocks of the multiz28way
3196
IEEE TRANSACTIONS ON INFORMATION THEORY, VOL. 59, NO. 5, MAY 2013
TABLE II MSA OVERALL COMPRESSION RESULTS, IN BITS PER SYMBOL, FOR THE MULTIZ28WAY AND MULTIZ46WAY DATASETS, LZ, THE METHOD PROPOSED BY HANUS et al. [1] (MSAC), AND THE METHOD PROPOSED IN THIS PAPER
Fig. 9. Average bits per symbol attained for several combinations of models, regarding the multiz28way dataset.
dataset, outperforming the MSAc and LZ methods. The compression ratio is even higher for the multiz46way dataset, with an average of 0.72 bps to store the MSA blocks. However, as can be seen by the compression value provided by LZ, this dataset is in fact more compressible. It should be noted that the parameters of the model have been tuned using only the multiz28way dataset. Nevertheless, and looking at the compression gains in relation to LZ, we verify that the model remains effective for the multiz46way dataset, i.e., it does not reveal overfitting. The “LB” column provides the number of bits per symbol that would be required if we could select the best model to encode each symbol (but without considering the side information indicating the model used). Therefore, this value can be seen as a lower bound on the number of bits per symbol that can be
Fig. 10. Relation between the average number of bits per symbol for the multiz28way dataset and the parameter . This evaluation was performed using the combination T4+T9+T10+ACM.
attained by these models. For a certain set of models, the gap between this value and the value effectively attained depends only on the quality of the probability mixing procedure. Fig. 11 displays two charts showing the contribution of each symbol to the final number of bits per symbol attained in each of the two datasets (in this case, without considering the overhead associated with the additional information, such as the size of the blocks). The left chart shows the average bits per symbol required by the proposed algorithm for compressing each symbol. The chart on the right-hand side shows the relative frequency of each symbol. After analyzing the information presented in Fig. 11, it is clear that symbols “ ” and “ ” are the ones having the worst compression results. On the other hand, the gap symbol (“ ”) is the one with the best compression ratio.
MATOS et al.: COMPRESSION MODEL FOR DNA MULTIPLE SEQUENCE ALIGNMENT BLOCKS
3197
Fig. 11. Average bits per symbol (left chart) and percentage of occurrence (right chart) for each symbol in the multiz28way and multiz46way datasets.
Regarding the right-hand side graphic of Fig. 11, we conclude that the gap symbol is the most frequent in the datasets. On the contrary, the less frequent symbols are the “ ” and “ ” [24]. These observations suggest the reason why we obtained better compression results in the multiz46way dataset. In this dataset, the relative frequency of the gap symbol is about 8% higher than in the multiz28way dataset (with more species involved, there is a higher probability of having alignment gaps). Also, the gap symbols are easier to compress (they tend to appear in larger clusters, which facilitates the compression). Combined, these two aspects have a decisive influence in the final compression ratio. In order to understand more clearly the performance of each model, we have collected statistical information of each one during the compression of the multiz28way dataset. The goal was to count how many times a certain model was the best one in the mixture. For each symbol, the best model is the one that alone would generate better compression results than others. These results are shown in Fig. 12. As can be seen, on average, the model associated with the context template T9 was of the time the best one, whereas the model with context T10 was the best of the time. Both the ACM and the model associated with context template T4 have been the best model, each of them, of the time. Finally, some considerations regarding the computational complexity of the methods. Our method took about 22.5 h to compress the multiz28way dataset. This measure takes into account the compression of the MSA blocks and the extra information contained in the files. The extra information was compressed using the LZ method. The MSAc method took almost 23 h to compress the same dataset, i.e., both approaches are comparable in terms of computational complexity. The multiz46way dataset, which contains about twice the data of the multiz28way dataset, took about 48 h to compress using our approach, i.e., about twice the time, suggesting that the computational complexity of the technique is linear in relation to the size of the dataset. Moreover, since the algorithm addresses both DNA bases and gaps as image pixels, without distinguishing between them, its complexity does not depend on the real probability model of the data.
Fig. 12. Performance of the four models: using template T4, T9, T10, and ACM. The performance is based on the number of times that, during compression, each model was the best one. The best model in the mixture is the one that, if considered alone and for each symbol, could generate the best compression results among the four.
VI. CONCLUSION Recent advances in DNA sequencing led to a fast growth in the amount of genomic data available in public databases. This paper deals with one particularly voluminous dataset in molecular genomics, known as whole genome alignments. These datasets contain genomes of different species aligned using an extra symbol representing missing entries. In this paper, we presented a modeling approach specifically designed for compressing whole genome alignments. The proposed algorithm is based on a mixture of finite-context models and arithmetic coding. We use context templates similar to those used in image coding, but also some designed taking into account the strong correlation that exists in each column of the MSA blocks. Despite the ACM and CM being relatively different, they explore the column correlation of the MSA blocks in a similar way. The SCM is an order-0 model that explores the statistical information of each column independently, by using the symbol frequencies of the current column. In Section V, we presented the results for several combinations of these models. We concluded that using the context templates T4,
3198
IEEE TRANSACTIONS ON INFORMATION THEORY, VOL. 59, NO. 5, MAY 2013
T9, T10, and the ACM, we could attain the best compression results. Using this mixture, the proposed method outperforms the LZ and MSAc methods, achieving compression rates close to 0.94 bps for the multiz28way dataset and about 0.72 bps for the multiz46way dataset. We also concluded that the model with the best performance is associated with the T9 template configuration. ACKNOWLEDGMENT The authors would like to thank Pavol Hanus for providing an implementation of his algorithm. REFERENCES [1] P. Hanus, J. Dingel, G. Chalkidis, and J. Hagenauer, “Compression of whole genome alignments,” IEEE Trans. Inf. Theory, vol. 56, no. 2, pp. 696–705, Feb. 2010. [2] M. Clamp et al., “Ensembl 2002: Accommodating comparative genomics,” Nucleic Acids Res., vol. 31, no. 1, pp. 38–42, Jan. 2003. [3] W. Miller et al., “28-way vertebrate alignment and conservation track in the UCSC genome browser,” Genome Res., vol. 17, no. 12, pp. 1797–1808, Nov. 2007. [4] G. Korodi and I. Tabus, “An efficient normalized maximum likelihood algorithm for DNA sequence compression,” ACM Trans. Inf. Syst., vol. 23, no. 1, pp. 3–34, Jan. 2005. [5] M. D. Cao, T. I. Dix, L. Allison, and C. Mears, “A simple statistical algorithm for biological sequence compression,” in Proc. Data Compress. Conf., Snowbird, UT, Mar. 2007, pp. 43–52. [6] A. J. Pinho, D. Pratas, and P. J. S. G. Ferreira, “Bacteria DNA sequence compression using a mixture of finite-context models,” in Proc. IEEE Workshop Statist. Signal Process., Nice, France, Jun. 2011, pp. 125–128. [7] A. J. Pinho, P. J. S. G. Ferreira, A. J. R. Neves, and C. A. C. Bastos, “On the representability of complete genomes by multiple competing finite-context (Markov) models,” PLoS ONE, vol. 6, no. 6, p. e21588, Jun. 2011. [8] R. C. Hardison, “Conserved noncoding sequences are reliable guides to regulatory elements,” Trends Genet., vol. 16, no. 9, pp. 369–372, Sep. 2000. [9] A. Siepel and D. Haussler, “Computational identification of evolutionarily conserved exons,” in Proc. 8th Annu. Int. Conf. Res. Comput. Molecular Biol., New York, NY, Mar. 2004, pp. 177–186. [10] S. S. Gross and M. R. Brent, “Using multiple alignments to improve gene prediction,” J. Comput. Biol., vol. 13, no. 2, pp. 379–393, Mar. 2006. [11] J. S. Pedersen et al., “Identification and classification of conserved RNA secondary structures in the human genome,” PLoS Comput. Biol., vol. 2, no. 4, p. e33, Mar. 2006. [12] B. Lewin, Genes VIII. Redwood City, CA: Benjamin Cummings, 2003. [13] G. M. Cooper, M. Brudno, E. A. Stone, I. Dubchak, S. Batzoglou, and A. Sidow, “Characterization of evolutionary rates and constraints in three mammalian genomes,” Genome Res., vol. 14, no. 4, pp. 539–548, Apr. 2004. [14] M. Blanchette, “Computation and analysis of genomic multi-sequence alignments,” Annu. Rev. Genom. Human Genet., vol. 8, no. 1, pp. 193–213, May 2007. [15] V. Cutello, G. Nicosia, M. Pavone, and I. Prizzi, “Protein multiple sequence alignment by hybrid bio-inspired algorithms,” Nucleic Acids Res., vol. 39, no. 6, pp. 1980–1992, Mar. 2011. [16] M. R. Aniba, O. Poch, A. Marchler-Bauer, and J. D. Thompson, “AlexSys: A knowledge-based expert system for multiple sequence alignment construction and analysis,” Nucleic Acids Res., vol. 38, no. 19, pp. 6338–6349, Oct. 2010.
[17] L. Ye and X. Huang, “MAP2: Multiple alignment of syntenic genomic sequences,” Nucleic Acids Res., vol. 33, no. 1, pp. 162–170, Jan. 2005. [18] M. Blanchette et al., “Aligning multiple genomic sequences with the threaded blockset aligner,” Genome Res., vol. 14, no. 4, pp. 708–715, Apr. 2004. [19] N. Bray and L. Pachter, “MAVID: Constrained ancestral alignment of multiple sequences,” Genome Res., vol. 14, no. 4, pp. 693–699, Apr. 2004. [20] M. Brudno, C. B. Do, G. M. Cooper, M. F. Kim, E. Davydov, N. C. S. Program, E. D. Green, A. Sidow, and S. Batzoglou, “LAGAN and Multi-LAGAN: Efficient tools for large-scale multiple alignment of genomic DNA,” Genome Res., vol. 13, no. 4, pp. 721–731, Apr. 2003. [21] R. Chenna, H. Sugawara, T. Koike, R. Lopez, T. J. Gibson, D. G. Higgins, and J. D. Thompson, “Multiple sequence alignment with the Clustal series of programs,” Nucleic Acids Res., vol. 31, no. 13, pp. 3497–3500, Jul. 2003. [22] P. A. Fujita et al., “The UCSC genome browser database: Update 2011,” Nucleic Acids Res., vol. 39, no. Suppl. 1, pp. D876–D882, Jan. 2011. [23] T. Hubbard et al., “The Ensembl genome database project,” Nucleic Acids Res., vol. 30, no. 1, pp. 38–41, Jan. 2002. [24] N. M. Cohen, E. Kenigsberg, and A. Tanay, “Primate CpG islands are maintained by heterogeneous evolutionary regimes involving minimal selection,” Cell, vol. 145, no. 5, pp. 773–786, May 2011. [25] P. J. Hastings, J. R. Lupski, S. M. Rosenberg, and G. Ira, “Mechanisms of change in gene copy number,” Nature Rev. Genet., vol. 10, no. 8, pp. 551–564, Aug. 2009. [26] J. Felsenstein, “Evolutionary trees from DNA sequences: A maximum likelihood approach,” J. Mol. Evolut., vol. 17, pp. 368–376, 1981. [27] T. C. Bell, J. G. Cleary, and I. H. Witten, Text Compression. Englewood Cliffs, NJ: Prentice-Hall, 1990. Luís M. O. Matos was born in Caracas, Venezuela, in January 1985. He received his M.S. degree in computer and telematics engineering from the University of Aveiro, Portugal, in July 2009. He is enrolled in the MAP-i Doctoral Programme. Currently, he is working with the Signal Processing Laboratory of the Institute of Electronics and Telematics Engineering of Aveiro (IEETA), which is associated with the Department of Electronics, Telecommunications and Informatics (DETI) of the University of Aveiro. His main research interests include biomedical imaging, data compression and image/video coding.
Diogo Pratas was born in Aveiro, Portugal, in February 1986. He received the Information Technology and Communications degree from the University of Aveiro, Portugal, in 2008. He worked as network services and communications manager at Nextiraone, in 2008, and as developer of linux-based servers at IPortalMais, in 2009. He is currently a student of the MAP-i Doctoral Programme and a Researcher at the Signal Processing Laboratory of the Institute of Electronics and Telematics Engineering of Aveiro (IEETA). His main research interests include information theory, bioinformatics, computational biology and computer security.
Armando J. Pinho (S’87–M’95) was born in Lisbon, Portugal, in July 1964. He received the electronics and telecommunications engineering degree from the University of Aveiro, Portugal, in 1988, the Master degree in electrical and computers engineering from the Technical University of Lisbon (IST), Portugal, in 1991, and the Ph.D. degree in electrical engineering from the University of Aveiro, in 1996. He is currently an Associate Professor at the Department of Electronics, Telecommunications and Informatics (DETI), University of Aveiro, and a Researcher at the Signal Processing Laboratory of the Institute of Electronics and Telematics Engineering of Aveiro (IEETA). He is also the current director of IEETA. His main research interests include image and video coding and analysis, data compression and computational biology.