Available online at www.sciencedirect.com Available online at www.sciencedirect.com
Procedia Engineering
ProcediaProcedia Engineering 00 (2011) 000–000 Engineering 29 (2012) 1314 – 1318 www.elsevier.com/locate/procedia
2012 International Workshop on Information and Electronics Engineering (IWIEE)
A Computation Method for Continuity Shou-quan Wanga*,b,Xiao-fang SHAOa b
a QingDao Branch of N AAU,QingDao,266041,, China College of Automation Engineering of NUAA,Jjiangsu,Nanjing,210016,China
Abstract This paper puts forward a mathematical method for computing the continuation extent of a specific curve—a specific instance of the Gestalt law of continuum. The method explores the curvature property of a curve to measure its continuation extent and experimental results show that the method is consistent with the human perception interpretations.
© 2011 Published by Elsevier Ltd. Selection and/or peer-review under responsibility of Harbin University of Science and Technology Open access under CC BY-NC-ND license. Keywords: Gestalt theory,law of continuum,curvature
1. Introduction Gestalt psychology explores the regularities of the brain to organize the perceptual elements. The Gestalt effect refers to the form-forming capability of our senses, particularly with respect to the visual recognition of figures and whole forms instead of just a collection of simple lines and curves. The Gestalt theory started in 1921 with the Max Wertheimer founding paper [1]. The Gestalt Bible Gesetze des Sehens by Wolfgang Metzger gave in its last edition in 1975 a broad overview of the extension and the results of the research. The fundamental principle of gestalt perception is the law of prägnanz (German for pithiness) which says that we tend to order our experience in a manner that is regular, orderly, symmetric, and simple. Gestalt psychologists attempt to discover refinements of the law of prägnanz, and this involves writing down laws which hypothetically allow us to predict the interpretation of sensation, what are often called "gestalt laws"[2]. Yet there is still no quantification model for all of Gestalt laws. Among previous related
*
* Corresponding author. Tel.: +86-013793235036. E-mail address:
[email protected].
1877-7058 © 2011 Published by Elsevier Ltd. Open access under CC BY-NC-ND license. doi:10.1016/j.proeng.2012.01.133
1315
Shou-quan Wang and Xiao-fang SHAO / Procedia Engineering (2012) 1314 – 1318 Shou-quan Wang/ Procedia Engineering 00 (2011)29000–000
2
works only Agnes Desolneux etal.[3] pointed out the problem of how to compute the “Gestalt properties” and investigated the rule for image pixels forming lines from the statistics point of view. In this paper we design a mathematical method for computing how smooth a curve’s continuity is apperceived, which is a part of the computation model for Gestalt law of continuum. The paper is organized as follows: In section Ⅱ the basic idea for computation is described; the quantification method for continuity measure is presented by section Ⅲ; section Ⅳ gives some experimental verifications before concluding in section Ⅴ. 2. The mathematical foundation Let QMGes denote the quantification method of a certain Gestalt law. Firstly a parameter space P is selected, then a function mGes(.) is constructed so that ∀p, q ∈ P , mGes(p,q) can get the measure for p and q’s “Gestalt property” . Sometimes mGes(p,q) needs to compute the integral of m2Ges(p,q). over P ,so it is 2 2 required that mGes ∫ ( p, q)dpdq exists and be limitary. We can use L (P) to represent a function space with such requirements. In L2(P), ∀m, n ∈ L2 ( P ) , if the inner-product is defined as: m, n = ∫ m(ξ )n (ξ )dξ
Then the norm is
(1)
P
m =
m, m
(2)
Correspondingly the measure for distance can be defined as d ( m ( p ), m= ( q ))
m( p ) − m( q)
(3) 2
In summary, the key to the quantification model is the construction of m Ges(p,q). Once it is determined, we can use equation (2)(3) to compute the measure for Gestalt property where m2Ges(p,q) satisfies the following three conditions: mGes (⋅) ∈ L2 ( P) (4) mGes (⋅) ≤ 1
(5)
mGes ( p ) ≥ 0 , ∀p ∈ P
(6)
3. The computation method for continuity In reality the surfaces or boundaries of objects often change smoothly. The perception of curves or contours is also apt to detect continuous spatial elements. Therefore the visual elements lying on a line or smooth curve are always clustered together, and two jointed curves will be seemed as one if they jointed each other smoothly compared with other curves. Many objective facts proved that continuity play an important role in perception and typical examples are some visual psychological experiments: Beck [5] found that it would take longer time to detect a line if the points on the line are moves away randomly; Field[6]proved that continuity makes a big difference in grouping random dots when there is no proximity cue . Existing quantitative work on good continuation has used dots, line-segments and Gabor patches as primitives. Smits and Vos [7]put forward a filter model based on CODE; Field [6] designed the
1316
Shou-quan Wang and Xiao-fang SHAO / Procedia 29 (2012) 1314 – 1318 Shou-quan Wang/ Procedia Engineering 00Engineering (2011) 000–000
3
“association fields” to simulate the continuation’s influence; Kellman & Shipley [8]focused on the contour formation and relatability and their work is extended later[9][9]. In this paper we aim to present a computation method for continuity which can be used to compute a curve’s continuous extent generally. The basic principles underlying our method are listed as follows because a collection of elements is most likely to be detected and grouped by continuity cue when: 1) The dotted line is long; 2) The density of the dots along the dotted curve is larger than the background relatively; 3) The local change of angle along the dotted curve is minimal, favoring linear contours; 4) The local properties of the dotted curve, such as its orientation and location, are known to the observer; 5) “Good continuity” can be interpreted as “smooth” in most cases. Based on the analysis mentioned above, we adopt the idea of curvature change minimization to set up the quantitative function. The input is a planar curve or some points on a curve, and the ratio of curvature change to arc length is used to measure the continuity of the curve. Given a curve denoted by cl, let y = f ( x ) be its mathematical function,and we set
x ∈ [ a, b] ,and
the step length be s = b − a (N is a constant that satisfies s ≤ 1 ),then the curvature of x represented by N
κ ′( x ) can be calculated by Equation(7): 3 3 2 ⎧⎛ 2 2 2 2⎞ ⎪⎜ f ′′( x + s) ⎣⎡1 + ( f ′( x + s)) ⎦⎤ − f ′′( x) ⎣⎡1 + ( f ′( x)) ⎦⎤ ⎟ ∃f ′′( x), x ∈(a, b − s) κ ′( x) = ⎨⎝ ⎠ ⎪ ∞ otherwise ⎩
(7)
Therefore the continuity measure of cl can be computed by the following function: N −1 ⎛ N −1 ⎞ mContinuity ( cl= ) exp ⎜ − ∑ s ⋅ κ ′( a + m ⋅ s ) ∑ 1 + f ′( a + m ⋅ s ) ⎟ = ⎝ m 0=m 0 ⎠
(8)
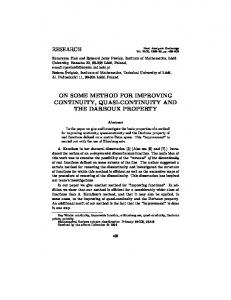
4. Experiments We test the quantification function represented by equation (8) by comparing the computation measure with the human perception results. The human perception results are obtained from the questionnaires which are filled by one hundred students of our department. The test data are drawn by computer and demonstrated by Fig. 1, which is composed of twelve curves and the quizzes are required to write down their definition for “good continuity” and the sort order of the continuous extent of different curves. If it takes longer time to memorize the connection orderliness of a curve from the start point to the end, the curve is judged as less smooth. 74% of the quizzes think a smooth curve should not fluctuate wildly, and the smoothest curve is (c) followed by (d); while 26% of them consider small curvature as good continuation, and the straight line presented in (f) is the smoothest. However, all of them agree that the last two curves are (e)and(l). Among the quizzes, 42% of them consider the order is denoted by Equation(9) ; 35% of them think the curve in (k) is the smoother and the order is presented by Equation(10) ; 16% of them give the description in Equation(11) ; 7% of them bring forward other responses. According our computation method described by Equation (8),we can get the continuity measure listed in Table 1.
1317
Shou-quan Wang and Xiao-fang SHAO / Engineering Procedia Engineering (2012) 1314 – 1318 Shou-quan Wang/ Procedia 00 (2011) 29 000–000
4
h>i> f > j>k >a>b> g k > j>h>i> g >a>b> f f > j>h>k >i>k >a>b
(9) (10) (11)
Although the sort order is different, the order for (e)and(l) is the same, and the for(a)and(b)drops behind. The main difference is demonstrated in the order for(h)(i)(j)(k)(g)(f).
order
Table 1. Continuity measures N −1 N −1 Curve’s s ⋅ κ ′( a + m ⋅ s ) ∑ 1 + f ′( a + m ⋅ s ) ∑ label = m 0= m 0 (a) 0.7474 (b) 0.7517 (c) 0 (d) 0.0151 (e) 0.7360 (f) 0 (g) 0.3383 (h) 0.7642 (i) 0.9076 (j) 0.4243 (k) 0.5584 (l) ∞
Continuity measure 0.4736 0.4716 1 0.9850 0.4790 1 0.7130 0.4657 0.4035 0.6542 0.5721 0
5. Conclusion We can see from the experimental results that the computation results obtained by our quantification method are consistent with the human perception and can acquire a more fine partition. The main differences are : (1) our method utilize the ratio of curvature change to arc length to compute the continuity extent, while human vision prefer straight line or circular line to be smooth; (2) Most people percept the curvature change by detecting the fluctuations of curves and fluctuations are not the same as mathematically computed curvatures. What’s more, Human eyes can not detect small differences in curvature. How to utilize our method to guide the search of continuous curves and contours in image processing will be our further research work Acknowledgements This research was supported by a Natural science foundation of Shandong province under grant No. 2009BSB02003.
1318
Shou-quan Wang and Xiao-fang SHAO / Procedia 29 (2012) 1314 – 1318 Shou-quan Wang/ Procedia Engineering 00Engineering (2011) 000–000
Fig. 1. Test data
References [1]
W. Ellis.A Source Book of Gestalt Psychology. Routledge and Kegan Paul, London, pp. 71–88, 1938.
[2]
Sternberg, Robert. Cognitive Psychology, Third Edition, Thomson Wadsworth, 2003.
[3]
Agnes Desolneux, Lionel Moisan, Jean-Michel Morel. Computational gestalts and perception thresholds. Journal of
Physiology, 2003, 97(2-3):311–324,. [4]
Xiaofang Shao, Xin Zhang, Cui-juan Sun. A computaion model for orientation similarity, the Sixth International
Conference on Natural Computation (ICNC 2010), IEEE Press, Augest. 2010, p.1940-1942. [5]
J. Beck, A. Rosenfeld, and R.Ivry. Line segregation. Spatial Vision, 1989,.4:75-101.
[6]
D. J.Field, , A.Hayes,and R. F.Hess. Contour integration by the human visual system: Evidence for a local “association
field.” Vision Research, 1993, 33:173-193. [7]
J. T.Smits, P. G.Vos,and M. P. van.Oeffelen. The percep-tion of a dotted line in noise: a model of good continuation and
some experimental results. Spatial Vision, 1985,1(2):163–177. [8]
P.J. Kellman, T.F. Shipley..A theory of visual interpolation in object perception. Cogn Psychol. 1991, 23(2):141-221.
[9]
D.J. Kalar, P. Garrigan, T.D. Wickens, etal. A unified model of illusory and occluded contour interpolation. Vision Res.
2010, 50(3):284-299. [10]
C Fantoni, J.D. Hilger, W. Gerbino, P.J. Kellman.Surface interpolation and 3D relatability. J Vision, 2008, 8(7):1-19.
5