Technical Brief
A Computational Approach for Balancing Competing Objectives in Winegrape Production James M. Meyers,1* Gavin L. Sacks,2 and Justine E. Vanden Heuvel1 Abstract: Operational field targets, such as leaf layer numbers or leaf-area-to-fruit-weight ratios, are often used to guide cultural practices to achieve particular production objectives, including reduced disease pressure, increased yield, and improved fruit composition. However, these targets are not customized to individual producers nor do they account for the need to balance potentially conflicting objectives, such as simultaneously increasing fruit-zone sunlight exposure to reduce disease pressure while minimizing fruit exposure to avoid sunburn or the development of undesirable aroma compounds. The approach here balances multiple production objectives by adapting a multi objective optimization method known as nondominated sorting genetic algorithm. The method was demonstrated in a hypothetical situation where a grower has competing objectives of reducing 1,1,6-trimethyl-1,2-dihydronaphthalene (TDN) precursors in Riesling while concurrently minimizing the amount of active ingredient used in an existing spray program. The demonstration model used two previously quantified responses for cluster exposure flux availability (CEFA) versus TDN precursor concentrations, and one previously quantified response for CEFA versus fruit spray residue. Optimal targets for CEFA and fruit spray inputs were computed that balance minimal TDN potential versus minimal spray active ingredient. A second analysis demonstrated how evolving knowledge of field responses can be used to update vineyard targets to maintain an optimal balance among production objectives. Key words: canopy management, cluster exposure, evolutionary algorithms, NSGA, optimization
Vineyard managers and winemakers use a variety of operational field targets to guide cultural practices, particularly with canopy architecture and canopy management. These targets vary widely in objective (e.g., flavor and aroma influence, vine balance, disease control), scale of applicability (e.g., vine, row, block), and quantitative precision. Broad qualitative targets—such as fruit exposure will improve fruit quality (Reynolds 2010)—are appealing to researchers in that they are easy to communicate and implement without the burden of rigorously tracking quantitative vineyard variables. Conversely, highly specific targets—such as maintaining vineyard canopy surface area at 21,000 m 2/ha to balance yield and fruit exposure (Smart and Robinson 1991)—suggest straightforward strategies that may be appealing to vineyard managers. Yet, because such targets make numerous assumptions regarding vineyard conditions, they are unlikely to be optimal for all sites. Alternatively, target ranges, such as maintaining a leaf-area-to-fruit-weight ratio within a range of 7 to 14 cm 2/g fw to achieve adequate fruit ripening (Smithyman et
al. 1997), imply that some flexibility is allowed or possibly even required (Howell 2001) in vineyard operations. However, should growers choose to use such a semiquantitative target to define operational goals, they must decide what subset of the range is both feasible and ideal for their vineyards. Selection of quantitative vine management targets to achieve production objectives is complicated because such selection is likely to impact compliance with other targets/ objectives. For example, a Cabernet franc grower with objectives of producing fruit with low methoxypyrazines and low incidence of sunburned berries could use an operational target of fully exposing fruit early in the season to reduce methoxypyrazines (Scheiner et al. 2010) but at the expense of increasing the incidence of sunburned berries (Chorti et al. 2010). Thus, optimal vineyard management practices need to identify targets that account for competing objectives. Vineyard managers informally perform this trade-off analysis routinely, but the accurate calculation of an optimal strategy in the presence of multiple competing objectives is beyond the limits of intuition and requires rigorous mathematics or computational optimization tools. Evolutionary algorithms (EAs), a class of computational optimization methods often used in operations research, are well-suited to solving trade-off problems of multiple dimensions (i.e., systems with more than one independent variable) and nonlinear responses (i.e., polynomial responses of degree greater than one) (Deb 2001) and have been purported to outperform other methods of multiobjective optimization in complex agricultural system modeling (Mayer et al. 2001). Evolutionary algorithms are based on a type of optimization known as a genetic algorithm (GA) (Holland 1975),
Department of Horticulture, and 2Department of Food Science, Cornell University, 630 W. North Street, Geneva, NY 14456. *Corresponding author (email:
[email protected]; tel: 914-643-2495; fax: 914-373-4112) Acknowledgments: The authors thank Wagner Vineyards and White Springs Vineyards for use of their vineyards. Manuscript submitted Jun 2011, revised Oct 2011, accepted Nov 2011 Copyright © 2012 by the American Society for Enology and Viticulture. All rights reserved. doi: 10.5344/ajev.2011.11049 1
296 Am. J. Enol. Vitic. 63:2 (2012)
A Computational Approach in Winegrape Production – 297
which solves problems by allowing potential solutions to compete in a simulated Darwinian evolutionary system. The simulation starts with a population of randomly created solutions, or individuals, which represents the first generation of possible solutions. As the simulation runs, the individuals in each generation are evaluated and only the most successful are allowed to survive. The surviving individuals are then used to define the next generation of the population through a process modeled to mirror genetic crossing, in which characteristics of the surviving members of the current generation are swapped and combined to create the next generation of potential solutions. The process repeats until the solutions no longer improve with successive generations. Because this process is computerized, large populations can be rapidly crossed across millions of generations. EAs have previously been applied to a variety of agricultural system optimization problems, including soybean pest control (Cardoso et al. 2009), minimization of nitrogen contamination (Loonen et al. 2006), and vineyard decision support (Meyers et al. 2011), although their application in vineyard management appears to be generally unexplored. Here we introduce a conceptual framework through which EAs are used to find optimal vineyard targets that balance multiple operational objectives. The approach is demonstrated through a hypothetical scenario in which a Riesling grower has two objectives: that precursors of 1,1,6-trimethyl-1,2-dihydronaphthalene (TDN), a compound responsible for “petrol” aroma, be reduced as much as possible and that the amount of fungicide applied to the vines be minimal. In the vineyard, a reduction in TDN precursors can be achieved through a reduction in fruit sunlight exposure (Marais et al. 1992, Kwasniewski et al. 2010). However, a reduction in spray products can be achieved by opening the canopy fruit-zone, reducing disease pressure through increased sunlight penetration, and better spray coverage (Austin et al. 2011, Gubler et al. 1987). In this scenario a trade-off is required: manipulating the canopy to positively impact one objective will negatively impact the other. An approach is presented for combining quantitative viticultural data from multiple, single-variable response studies into a multiobjective decision support model. Studies with complementary response curves, specifically those that are derived from a common independent variable, are used to explore trade-offs among cultural inputs without the need for a fully factorialized response study. Two sets of solutions are presented. First, the trade-offs between TDN potential and spray residue resulting from varying cluster exposure are modeled using previously quantified responses for TDN versus cluster exposure (Meyers 2011, Gerdes et al. 2002) and cluster exposure versus spray residue (Austin et al. 2011). Second, the model is modified to demonstrate how evolving knowledge of field responses can be used to update vineyard targets to maintain an optimal balance between the stated objectives (i.e., TDN precursors and active spray ingredient).
Materials and Methods Model design and variables. The design was guided by the desire to demonstrate the concepts related to nonlinear
trade-off analyses and the application of EAs to establishing vineyard targets with a minimum level of complexity. The model was limited to two dimensions, specifically represented by the response of potential TDN to fruit-zone sunlight exposure and the response of fruit spray residue to fruit-zone sunlight exposure. The model was not intended to predict absolute concentration of TDN precursors with respect to sensory threshold or to predict the efficacy of a spray program with respect to a particular set of diseases but rather to demonstrate the trade-off between TDN potential and fruit spray residue in relative terms. Quantification of responses. The EA optimization model was defined with two objectives, minimization of the concentration of TDN precursors (henceforth called “TDN”) and maximization of fruit spray residue, and two decision variables, cluster exposure expressed as cluster exposure flux availability (CEFA) (Meyers and Vanden Heuvel 2008) and relative spray residue (vs. a baseline practice) expressed as a unitless ratio. TDN response was defined by fitting a polynomial to unpublished raw data reported by Meyers (2011) (Figure 1) conducted to quantify the effect of naturally occurring variable cluster exposure on common Riesling aroma compounds. TDN response was further refined by establishing a 0.20 CEFA sunlight dose-response threshold (Gerdes et al. 2002), such that the TDN concentration for any fruit cluster receiving 0.50) were not considered in the optimization model. Fitting the sunlight versus TDN response data to a quadratic polynomial (R 2 = 0.83) and further constraining it with the 0.20 doseresponse and 0.50 upper-bound empirical range resulted in the following definition for relative TDN concentrations in response to CEFA: [TDN] =
{
28.41 398.2(CEFA)2 – 124.1(CEFA) + 36.9 undefined
(Eq. 1)
where CEFA < 0.20 (first line of Eq. 1), where 0.20 ≤ CEFA ≤ 0.50 (second line of Eq. 1), where CEFA > 0.50 (third line of Eq. 1). Relative fruit spray residue response to postveraison cluster exposure was defined by fitting a polynomial to the unpublished raw data collected in a previous study (Austin et al. 2011) (Figure 1), which quantified the correlation between cluster exposure and fruit spray residue on Chardonnay in a New York State Finger Lakes vineyard. Fitting the sunlight versus spray residue (SR) response data to a linear equation (R 2 = 0.93) resulted in the following equation:
SR = 0.0178(CEFA) + 0.0015
(Eq. 2)
The units are arbitrary because TDN and spray residue responses are used to compare relative values.
Am. J. Enol. Vitic. 63:2 (2012)
298 – Meyers et al.
Model parameters and objective functions. A baseline value for postharvest TDN concentration was defined as the average for the data set from which the response was derived (35.7, expressed without units as a ratio of TDN/internal standard). Solving Equation 1 for CEFA where TDN = 35.7 resulted in a baseline CEFA of 0.31. Subsequently solving Equation 2 for SR where CEFA = 0.31 determined the baseline value of SR to be 0.0069. To facilitate interpretation of the optimization results, the two objective functions were defined such that they would be at 100% when baseline TDN and SR values were used: Objective1(CEFA) = 100% x TDN(CEFA) / 35.7 Objective2(CEFA) = 100% x 0.0069 / SR(CEFA)
(Eq. 3) (Eq. 4)
Objective1 corresponds to the relative concentration of TDN and Objective2 to the inverse of the relative amount of spray residue deposited. The choice of numerator and denominator differs between Equation 3 and Equation 4 because EA optimizations generally require that all objective functions be expressed as a minimization goal (Deb 2001). The specific EA algorithm used for the optimization was nondominated sorting genetic algorithm-II (NSGA-II) (Deb et al. 2002), programmed in MATLAB (Mathworks, Natick, MA) using an open-source NSGA-II utility modified to perform the optimization defined here (available on request from the corresponding author). Two optimizations were performed resulting in two sets of solutions. The first optimization was performed using Equations 1 through 4 as previously specified. To demonstrate tuning of an optimization model in response to new empirical data, a second optimization was performed after substituting a baseline SR value of 0.005 in Equation 4. In this hypothetical example, the updated baseline of SR = 0.005 could have been derived from a field trial in which spray residue was measured and correlated with disease severity, which led the vineyard manager to reduce minimum
SR targets. The model decision variable, CEFA, was evaluated over a range of 0 to 0.50 for both optimizations.
Results Performing the initial optimization over the range of 0 to 0.50 CEFA resulted in a Pareto front (i.e., the demarcation line between solutions that are infeasible and those that are inefficient) (Figure 2). As intended by model design, the point defined by the vineyard baseline targets (TDN = 35.7, CEFA = 0.31, SR = 0.0069) is located along the Pareto front at coordinates (100%, 100%). Optimal solutions to the trade-off analysis are along the Pareto front (i.e., any solution along the front is a valid and optimal solution). The plot space to the right represents suboptimal solutions (i.e., combinations of targets that would lead to unnecessarily high TDN potential and/or spray product use), while the plot space to the left represents infeasible solutions (i.e., would violate the constraints of the model). The underlying CEFA values associated with the baseline and optimal solutions (Figure 2) were calculated by using Equation 3 to solve for TDN (CEFA) and using Equation 1 to solve for CEFA, resulting in Table 1. The optimal solutions suggest that achieving the maximum possible reduction in
Figure 2 Initial solutions for the two-objective optimization of TDN concentration vs. spray residue. B represents the initial baseline (100%, 100%) as defined by the model. The arc of circles represents the Pareto-optimal solutions to the problem within the limits of the model constraints. P1 (80%, 131%) and P2 (188%, 70%) represent two optimal solutions for consideration: P1 favors reduced TDN potential and P2 favors reduced spray product.
Table 1 TDN(CEFA) and CEFA values underlying with the solutions highlighted in Figure 2.
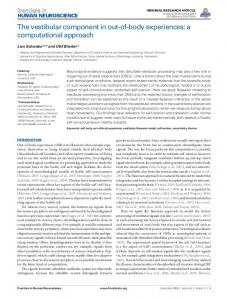
Figure 1 Single-variable responses adapted to define the multiobjective optimization model. Cluster exposure flux availability (CEFA) vs. TDN concentration (open circle: 398.2x2-124.1x+36.9, R2 = 0.83) adapted from Meyers (2011). CEFA vs. fruit spray residue concentration (solid circle: 0.0178x + 0.0015, R2 = 0.93) adapted from Austin et al. (2011).
Optimal solution
Objective1 (% baseline TDN)
Objective2 (% baseline spray)
TDN(CEFA) (arbitrary units)
CEFA
100% 80% 188%
100% 131% 70%
35.7 28.6 67.1
0.31 0.24 0.48
A P1 P2
Am. J. Enol. Vitic. 63:2 (2012)
A Computational Approach in Winegrape Production – 299
TDN (80% of baseline on the x axis) would require that the spray program be adjusted to increase spray residue by ~31% (131% of baseline on the y axis) through droplet size, tank concentration, and so on. That would be achieved by having well-shaded fruit (CEFA = 0.20). Targeting a lower CEFA is suboptimal and would require unnecessarily high spray, since a constant response of TDN versus CEFA was assumed at CEFA < 0.20. Conversely, achieving a 30% reduction in required spray material (70% of baseline on the y axis) through canopy management would lead to an 88% increase in TDN concentration (188% of baseline on the x axis). Performing the optimization with the baseline SR set to 0.005 resulted in a new Pareto front (Figure 3). The revised solutions indicate that the baseline TDN concentrations (100% at CEFA = 0.31) could have been achieved with reduced spray material (point B at x = 100%, y ~ 72%), and that the theoretical physiological minimum TDN concentration, as influenced by sunlight exposure, can now be achieved within the original baseline spray program (point C at x = 80%, y = 95%).
Discussion Optimized decision support. Factorial field treatment experiments have been conducted for hundreds of site-yearcultivar-treatment combinations (Reynolds 2010), yet the process through which grape and wine producers translate research results into practice is often informal and subjective. Quantitative data on the response of TDN potential and spray residue to changing cluster exposure was used to illustrate how response curves based on experimental data can be used to determine quantitative canopy targets that balance competing objectives. The hypothetical trade-off presented here was
Figure 3 Initial and revised solution sets after spray program efficacy is adjusted to reflect new hypothetical empirical findings that the spray deposition is greater than first assumed. The original baseline target (A, 100% TDN when CEFA = 0.31) is now suboptimal compared to the revised solutions. Revised solutions indicate that baseline TDN concentrations (100% of baseline at CEFA = 0.31) could have been achieved with reduced spray material (B at x = 100%, y ~ 72%) and that minimum TDN concentration (80% of baseline at CEFA = 0.24) can now be achieved with a similar amount of spray but lower CEFA (C at Objective1 = 80%, Objective2 = 95%).
not intended to propose specific CEFA or spray residue targets for Riesling producers, but rather to demonstrate how singlefactor quantitative responses can be combined to optimize operations in support of multifactorial goals without the need for a fully factorialized response study. The methods of quantitative optimization can be applied to arbitrary combinations of responses and are independent of the qualitative nature of the underlying response curves. For example, although the demonstrated optimization was guided by a regional model in which severity of diseases such as botrytis (Gubler et al. 1987) and powdery mildew (Austin et al. 2011, Chellemi and Marois 1992) are expected to correlate negatively with fruitzone sunlight exposure, the methods can be similarly applied to a model in which a positive correlation is expected (Latorre et al. 2011). The optimal solutions, as defined by the Pareto fronts (Figure 2, Figure 3), represent a range of best-case trade-off options that are subject to additional operational decisions. Unmodeled variables, such as the practicality or costs of adjusting the spray program to achieve higher levels of active ingredient residue (such as nozzle selection, tank concentration) or achieving the target cluster exposure (such as leafpulling, shoot positioning), must be considered when choosing operational field targets. Alternatively, as new empirical response data become available (e.g., the relationship between spray droplet geometry and pest-specific treatment efficacy; Omar et al. 1991), objective functions could be appropriately modified or added to the optimization model. Basis for broader optimization models. Although the science of optimization offers numerous methods (Fletcher 1987) that are more mathematically rigorous than EAs, many require advanced specialized skills and are not easily adapted to situations involving numerous objectives or nonlinear objective functions (Deb 2001). In contrast, EAs are relatively accessible to researchers and practitioners who are not mathematicians, are well suited for trade-off analyses, and are readily modified to include additional dimensions. The solutions here are limited to two dimensions defined by only two objectives (i.e., potential TDN concentration and spray coverage) and two decision variables (i.e., the parameter CEFA and spray protocol). Although immediately useful in its current form, the model would ideally be expanded into a comprehensive performance model that has been optimized to balance all quantifiable operational objectives including a broader set of vine performance and economic variables. Such a scenario would be highly dimensional, involving numerous operational objectives (e.g., reduced fertilizer use, reduced water used, increased phenolic content) and ecophysiological and cultural parameters (e.g., nitrogen, daytime temperature). Future adaptations of this decision-support model would ideally replace fixed response curves with mechanistic models that account for locally dynamic variables like diurnal radiation, air temperature, and water availability to monitor vine performance and cultural inputs. Such models have been developed for other crops, such as rice (Huang et al. 1996), and there are several examples of mechanistic physiological models for vineyard targets (e.g., operational crop load; Lakso
Am. J. Enol. Vitic. 63:2 (2012)
300 – Meyers et al.
et al. 2008) and estimation of unknown ecophysiological variables (e.g., berry temperature; Cola et al. 2009). Such models could also account for changes in phenological state and allow for adjustments in cultural practices throughout the growing season. For example, the response curves used in this model consider TDN potential as a function of CEFA only at a single time point (just prior to veraison). Since the effects of cluster exposure on TDN potential at earlier or later time points appears to be less consequential (Kwasniewski et.al. 2010), a more robust optimization would model TDN response as both a function of time and CEFA. Further refinements could also parameterize the effects of temperature and nitrogen status.
Conclusion A formal computational approach for quantitatively balancing multiple winegrape production objectives in a hypothetical scenario was demonstrated. Optimal field targets were computed by adapting NSGA-II to analyze the relationships among independently quantified responses (CEFA vs. TDN potential and CEFA vs. fruit spray residue). Results demonstrated that interdependencies among response variables can limit the set of operational field targets which are optimal for a given scenario and that intuitively chosen targets can lead to excessive use of inputs, failure to achieve objectives, or unattainable combinations of objectives. Evolutionary algorithms such as NSGA-II are more approachable than fixed mathematical optimization methods and are well suited to exploring trade-offs in multidimensional production models. These methods have the potential to increase the utility and commercial impact of research data and to align vineyard management practices more closely with overall objectives.
Literature Cited Austin, C.N., G.G. Grove, J.M. Meyers, and W.F. Wilcox. 2011. Powdery mildew severity as a function of canopy density: Associated impacts on sunlight penetration and spray coverage. Am. J. Enol. Vitic. 62:23-31. Cardoso, R.T.N., A.R. da Cruz, E.F. Wanner, and R.H.C. Takahashi. 2009. Multi-objective evolutionary optimization of biological pest control with impulsive dynamics in soybean crops. Bull. Math. Biol.71:1463-1481. Chellemi, D.O., and J.J. Marois. 1992. Inf luence of leaf removal, fungicide applications, and fruit maturity on incidence and severity of grape powdery mildew. Am. J. Enol. Vitic. 43:53-57. Chorti, E., S. Guidoni, A. Ferrandino, and V. Novello. 2010. Effect of different cluster sunlight exposure levels on ripening and anthocyanin accumulation in Nebbiolo grapes. Am. J. Enol. Vitic. 61:23-30. Cola, G., O. Failla, and L. Mariani. 2009. BerryTone–A simulation model for the daily course of grape berry temperature. Agric. For. Meteorol. 149:1215-228. Deb, K. 2001. Multi-Objective Optimization Using Evolutionary Algorithms. Wiley & Sons, Chichester, UK. Deb, K., A. Pratap, S. Agarwal, and T. Meyarivan. 2002. A fast and elitist multiobjective genetic algorithm: NSGA-II. IEEE T. Evolut. Comput. 6:182-197. Fletcher, R. 1987. Practical Methods of Optimization. 2d ed. Wiley & Sons, Chichester, UK.
Carotenoid-Derived Aroma Compounds. P. Winterhalter and R.L. Rouseff (eds.), pp. 262-272. ACS Symp. Ser. 802. Am. Chemical Society, Washington, DC. Gubler, W.D., J.J. Marois, A.M. Bledsoe, and L.J. Bettiga. 1987. Control of Botrytis bunch rot of grape with canopy management, Plant Dis. 71:599-601. Holland, J.H. 1975. Adaptation in Natural and Artificial Systems: An Introductory Analysis with Applications to Biology, Control and Artificial Intelligence. University of Michigan Press, Ann Arbor. Howell, G.S. 2001. Sustainable grape productivity and the growth-yield relationship: A review. Am. J. Enol. Vitic. 52:165-174. Huang, Y., L. Gao, J. ZhiQing, and C. Hua. 1996. A software package for optimizing rice production management based on growth simulation and feedback control. Agric. Syst. 50:335-354. Kwasniewski, M.T., J.E. Vanden Heuvel, B.S. Pan, and G.L. Sacks. 2010. Timing of cluster light environment manipulation during grape development affects C13 norisoprenoid and carotenoid concentration of Riesling. J. Agric. Food. Chem. 58:6841-6849. Lakso, A.N., D. Intrigliolo, and D.M. Eissenstat. 2008. Modeling Concord grapes with “Vitisim”, a simplified carbon balance model: Understanding pruning effects. Acta Hortic. 803:243-250. Latorre, B.A., E.X. Briceñoa, and R. Torresa. 2011. Increase in Cladosporium spp. populations and rot of wine grapes associated with leaf removal. Crop Prot. 30:52-56. Loonen, W., P.S.C. Heuberger, A.H. Bakema, and P. Schot. 2006. Application of a genetic algorithm to minimize agricultural nitrogen deposition in nature reserves. Agric. Syst. 88:360-375. Marais, J., C. Van Wyk, and A. Rapp. 1992. Effect of storage time, temperature and region on the levels of 1, 1, 6-trimethyl-1, 2-dihydronaphthalene and other volatiles, and on quality of Weisser Riesling wines. S. Afr. J. Enol. Vitic. 13:33-44. Mayer, D.G., J.A. Belward, and K. Burrage. 2001. Robust parameter settings of evolutionary algorithms for the optimisation of agricultural systems models. Agric. Syst. 69:199-213. Meyers, J.M. 2011. Computational canopy models for precision measurement and adaptive management of grapevine performance. Ph.D. thesis, Cornell University, Ithaca, NY. Meyers, J.M., and J.E. Vanden Heuvel. 2008. Enhancing the precision and spatial acuity of point quadrat analyses via calibrated exposure mapping. Am. J. Enol. Vitic. 59:425-431. Meyers, J.M., G.L. Sacks, H.M. van Es, and J.E. Vanden Heuvel. 2011. Improving vineyard sampling efficiency via dynamic spatially-explicit optimisation. Aust. J. Grape Wine Res. 17:306-315. Omar, D., G.A. Matthews, M.G. Ford, and D.W. Salt. 1991. The influence of spray droplet characteristics on the efficacy of permethrin against the diamond back moth Plutella xylostella: The effect of drop size and concentration on the potency of ULV and EC-based residual deposits. Pestic. Sci. 32:439-450. Reynolds, A.G. 2010. Managing Wine Quality. Vol. 1. Viticulture and Wine Quality. CRC Press, Boca Raton, FL. Scheiner, J.J., G.L. Sacks, B. Pan, S. Ennahli, L. Tarlton, A. Wise, S.D. Lerch, and J.E. Vanden Heuvel. 2010. Impact of severity and timing of basal leaf removal on 3-isobutyl-2-methoxypyrazine concentrations in red winegrapes. Am. J. Enol. Vitic. 61:358-364. Smart, R., and M. Robinson. 1991. Sunlight into Wine: A Handbook for Winegrape Canopy Management. Winetitles, Adelaide. Smithyman, R.P., G.S. Howell, and D.P. Miller. 1997. Inf luence of canopy configuration on vegetative development, yield, and fruit composition of Seyval blanc grapevines. Am. J. Enol. Vitic. 48:482-491.
Gerdes, S.M., P. Winterhalter, and S.E. Ebeler. 2002. Effect of sunlight exposure on norisoprenoid formation in White Riesling grapes. In Am. J. Enol. Vitic. 63:2 (2012)