A Computational Theory of Complex Problem Solving Using the Vector Space Model (part II): Latent Semantic Analysis Applied to Empirical Results from Adaptation Experiments José Quesada, Walter Kintsch Institute of Cognitive Science University of Colorado, Boulder Boulder, CO 80309-0344 {quesadaj, wkintsch}@psych.colorado.edu
Emilio Gomez Department of Experimental Psychology University of Granada Granada (Spain)
[email protected]
Abstract. The literature of complex problem solving and system control has focused on how to improve the adaptation of operators to new, unpredictable circumstances. The present work reviews the main methodologies and assumptions that are currently being used in complex, dynamic task to answer questions regarding the adaptability problem, i.e. the work on DuressII (Vicente and Collaborators) and on Firechief (Cañas and collaborators). Some methodological problems for Cañas et al. analysis assumptions that could have important consequences in the results obtained are discussed. This study proposes Latent Semantic Analysis (LSA) as an alternative that remedies some of the flaws and adds some interesting new possibilities of analysis, such as coherence measures to assess performance changes in a similar vein as the Within-trial Trajectory Deviation (WTD) used in continuous systems such as DuressII. The study uses an LSA corpus created from the experimental data generated by past experiments in Firechief on adaptation to unpredictable task changes to replicate and extend the results previously obtained. The new LSA approach and results obtained are discussed. The fact that results from both microworlds could be explained by LSA with no modifications in its basic assumptions promises a future common theory and method of complex problem solving.
1. Introduction Theories of human error make contradictory predictions about the reasons that can lead people with excellent performance to err when the environment changes. For
many years now, researchers have been interested in how people adapt to changes in their job environment, which conditions are making this adaptation more difficult, and how systems can be designed to permit a flexible adaptation to new, unexpected conditions (e.g., [1], [9], [18]). A series of experimental studies using dynamic problem solving situations, Cañas and collaborators [2] [15] examined why some new conditions, but not others, tend to impair performance. These studies added evidence regarding the importance of analyzing the strategies people employ, since only environmental conditions that are relevant to the strategy at hand affect performance. Their main point is that research in this area should not aim to identify system features (design) or human features (cognitive limitations and biases) alone, but their interaction. Some system features, when changed, will drastically affect the performance of some people; these same people can be relatively immune to other changes in their environment. The explanation for this phenomenon resides in the strategies that people use to control the system; thus, strategy analysis becomes an important area of study. Cañas et al. [2] use the term ‘strategy’ to refer to different methods participants use to control the system. While intuitively appealing, the concept of strategy is problematic in practice and we are not going to use this term in our discussion. There are two main reasons for this decision: (1) The term strategy is poorly defined, and different researchers interpret it differently. Are we talking about elaborated processes that are systematic, goal-directed, and under explicit conscious control? Are processes that are fast, but nevertheless systematic and goal-directed, considered strategies? Are intuitive or unconscious processes, which are stimulus-driven, not to be considered strategies? How can we set a threshold for strategic and non-strategic behavior [6]? (2) Since we never asked for verbal protocols or control recipes (e.g., [5]) we are working with performance samples, and to infer strategies from performance (defined as a set of rules that can be implemented to control the system) is not straightforward in complex, dynamic settings. Instead of talking about strategies, we prefer to use performance measures, both in terms of process and product. We agree with Vicente and collaborators ([8], [22]) that we need to assess not only how well participants did at the end of the trial – product measure -, but also how they managed to do it – process measure. We review two major approaches to performance description in Complex problem solving: (1) the Abstraction Hierarchy (AH) framework represented by the work done on DuressII 1 by Vicente and collaborators ([8], [22]), and (2) Firechief2 system used by Cañas and
1
DURESS (DUal REservoir System Simulation), a dynamic thermal-hydraulic process simulation [19], consists of two redundant feedwater streams, each consisting of a pump and three valves, which can be configured to supply water to two reservoirs. The system goals are to keep each of the reservoirs at a prescribed temperature, and to maintain enough water in each reservoir to satisfy each of the current externally determined demand flow rates. 2 The Firechief microworld [12] is a task where participants find a screen that simulates a forest where the fire is spreading. Their task is to extinguish the fire as soon as possible. In order to
collaborators ([2], [15]). Both of these have been successful research projects and their basic findings have proven to be replicable. However, the measures used to assess processes in these microworlds are less than satisfactory for various reasons, as discussed below. In their place, we suggest a new process measure based on Latent Semantic Analysis. LSA is a machine-learning system that induces representations of the meaning of words by analyzing the relation between words and passages in large bodies of representative text. LSA has been implemented as a theory and technique to analyze performance in Complex Problem Solving, using actions or states as units instead of words and trials instead of text passages (see Quesada, Kintsch, and Gomez, this issue). The present paper is primarily directed to replicate and extend the results of Cañas et al. [2], using them as an example of how LSA can be successfully applied to complex problem solving in microworlds. 1.1 Measuring Performance in DuressII Vicente and collaborators have developed a process measure of control performance in complex, dynamic situations based on the Abstraction Hierarchy (AH). The AH is an analytical tool that has been proposed to decompose the variability of complex work domains ([16], [18]). Each level of the AH is a model of the same work domain, but the levels differ in abstraction and resolution (part – whole granularity). Thus, each level relies on a different set of attributes or ‘language’ [22]. The defining feature of this hierarchy is that its elements in different levels are connected by means-end links. As an example, consider the game of baseball. Vicente and Wang [20] pointed at five ordered levels of abstraction: (1) Purpose (win the game). (2) Strategies (e.g., score at least 2 runs in this inning) (3) tactics (e.g., advance all by one base or any other alternative tactics) (4) Functions (for example hit and run) (5) Players (e.g., batter, first base runner, and second base runner). More generally, the AH for DuressII contains the following levels: (1) Functional purpose: objects at this level of abstraction correspond to overall system goals. (2) Abstract function: this level can be described in terms of the conservation of mass and energy for each reservoir subsystem. (3) Generalized function: flows and storage of heat and water are described at this level of abstraction. (4) Physical function: the states of system components are described at this level of abstraction. Recently [22], AH has been used as a measure in complex problem solving to analyze process behavior over time, under the dynamic system theory framework. Variability (measured as variance) of raw variable values was used in [22]. That is, the average variance for each individual was compared in different levels of the AH. Participants that showed less variability in higher levels were supposed to be attuned to these levels, having a more abstract representation of the system. However, this measure does not compare pairs of trials, or the development of effects along time.
do so, they can use helicopters and trucks (each one with particular characteristics) that can be controlled by mouse movements and key presses.
As a next step, Hajdukiewicz and Vicente [9] measured the amount of change in control performance using the Within-trial Trajectory Deviation (WTD) method. Since DuressII consists mainly of continuous variables, changes can be calculated by simply subtracting the values of successive variables. Trajectories are plots of the differences between vectors representing the states of the system over time. The bigger the area under the curve, the more different the trials compared are. The basic idea is to compare the trajectory of a target trial to the mean trajectory of a set of previous trials. Hajdukiewicz and Vicente did that by means of a sliding window, that is, each trial was compared with a small window of previous trials. This measure indicates the amount of change in the performance for each trial. While this method works well for continuous variables, a problem arises when systems are described by means of discrete variables. Then the amount of change cannot be expressed as a subtraction of two values at two temporal moments. Since some real systems (e.g., interfaces of machines), and some microworlds (e.g., Firechief) are better defined in terms of discrete states, the WTD measure as Hajdukiewicz and Vicente described it is not directly applicable. 1.2 Measuring Performance in Firechief Cañas and collaborators developed a method for describing performance and analyzing ‘strategies’ in Firechief [2], [15]. First, they designed a set of very simple, simulated theoretical strategies using a production system. These strategies were orthogonal, and were used as factors in a regression analysis applied to every trial to describe performance. The strategies were coded as matrices containing transitions between actions as the unit of analysis. Canas et al.’s measures imposed a–priori, theoretically driven assumptions on their analyses. These assumptions are reasonable and well-motivated, but they may nevertheless bias the outcome of their analyses in unknown ways. (1) They used 'transition between two actions' as their unit of analysis. However, they could have also used three actions, or more, and this change could have had important consequences. (2) To avoid the empty space phenomenon3, they only used part of the information from the log files (type of action); although type of action probably was the most important one, much useful data was lost in this process. (3) They used a multiple regression approach to compare similarity between empirical ‘strategies’ and theoretical ones (factors). This procedure relies on correlation, and this similarity measure has several flaws associated (see Jones & Furnas, [10] for a comparison of similarity measures). (4) To interpret groups and for other reasons, they used a set of simple theoretical, simulated, strategies. The designed strategies were orthogonal in the sense that their matrices did not correlate. However, the selection of theoretical 3
Multidimensional spaces are inherently sparse, and this can affect the mathematical tractability. A common problem is that matrices of transitions between actions are mostly zeros; since any pair of matrices to be compared are sharing a lot of zero cells, correlations are very high, but uninformative (artifactual).
strategies can strongly determine the results: How many of them do we need? Which of them? Even strategies created using task analysis and following the simplicity criterion impose an a-priori, possibly unwarranted theoretical structure on the data. (5) They used a k-means cluster analysis procedure over dichotomous values of significance (0 or 1) of beta values in the multiple regression analysis, further imposing additional structure on their data. This paper introduces an analysis based on LSA that has been designed to overcome these limitations. The LSA-derived method will be applied to the same dataset used in Cañas et al. [2]. We present a coherence measure to assess how participants change their control activities to cope with changes in the simulated environment. This measure resembles Hajdukiewicz and Vicente’s WTD, but the comparisons between the window and the current trial employ LSA cosines to overcome the problem of non-continuous variables. This measure is inspired by the work of Foltz, Kintsch, and Landauer, [7], who were able to predict text comprehension using the average LSA cosine between vectors corresponding to contiguous sentences. They calculated the vector in the LSA space for each sentence, and then the cosine between successive sentences. The average cosine for each text was an indicator of how coherent the text was. Texts with higher coherence were more easily understood. In one of their experiments, they used a data set from McNamara, E. Kintsch, Songer and Kintsch [11] where, in some conditions, word overlap between sentences was minimal. Even in those circumstances, LSA performed well at capturing the coherence of the text. This feature of LSA makes it very interesting for microworld performance comparisons, since the same actions are rarely used, even when the intentions of the participants are quite similar in two trials. The method section below introduces this new process measure, coherence, to assess how participants change their control activities to cope with changes. The results section shows how this measure is put into practice and how it enables some new analyses. Lastly, the discussion and conclusions section argues that this method transcends some of the limitations described before for previous methods and points to future directions for research.
2. Method Participants. 81 participants were asked to play 22 trials each on Firechief [12] in two non-consecutive sessions (not on the same day, though no more than four days apart) the first of an hour and an half and the second approximately an hour. In the first session they played 10 experimental trials and in the second one 12. Each experimental trial lasted 260 seconds. During the first 30 minutes of the first session the experimenter explained the task and ran three practice trials to train participants in the commands and the characteristics of the task. Only trials 13-20 were considered in these experiments (four trials before change, and four trials after the change). Procedure. Participants were assigned randomly to 2 groups with different environmental changes, which were designed to affect systematically two prototypical
‘strategies’ (i.e., patterns of actions) that were found in previous experiments [15]. The first 16 trials were identical for the two groups. On these trials, conditions were held constant in terms of fire distribution, wind direction, appliance characteristics, etc. The last 6 trials introduced a system manipulation. (1) The wind direction change group experienced a progressive, east-to-west wind change. This kind of manipulation is known to affect mainly participants who rely on control fires, which have to be relocated. (2) The appliance efficiency change group experienced a drastic reduction in the extinction power of both helicopters and trucks. Fires of half the size were now impossible to extinguish by dropping water on them. This kind of manipulation is supposed to interfere with the performance of participants who rely on the drop-water command, since the fires are now more difficult to stop this way. The remaining features of the systems were kept exactly the same as in the 16 previous trials. Participants did not know beforehand that a manipulation was going to be introduced. Since microworlds settings are, in general, difficult to describe in the procedure section of a paper in a way that enables perfect replication, the parameter files used are available upon request. LSA corpus creation. LSA is a machine learning procedure that creates a highdimensional semantic space. Once that space has been constructed, items – usually words or sentences, actions here – can be readily compared with each other and their similarity measured quantitatively and automatically. To create such a space, LSA needs a large corpus of observations consisting of items and their context. Typically, items have been words and the paragraphs in which the words appeared served as contexts. To create an LSA space for present purposes, data from experiments 1 and 2 described in Quesada et al. [15] were used as the corpus, plus data from the experiment described in Cañas et al. [2]. The conditions and changes in these experiments were identical to the wind change condition described above. Actions were coded by joining the information contained in one line of the log files. It is important to note that this procedure does not require the experimenter to select part of the information (as in the procedure described in Quesada et al, [15]), but can cope with the whole action description. However, since LSA must be trained on a set of variables that should resemble closely the information that participants use to perform in the task, we asked the participants in the human judgments study described in Quesada, Kintsch, and Gomez (this issue) to describe what features they used to compare trials and to perform in the task. Their comments indicated that they were not using some information, and this information was removed from the test that LSA used to learn the task. The information that participants most probably do not use is (1) appliance number and (2) departure coordinates. These comments reflect closely some empirical findings in spatial attention when to multiple moving targets, most of them reported by Pylyshyn (e.g., [13], [14]). In these experiments, participants had to keep track of up to four items (targets) that moved randomly in a field of eight or more identical items (distractors). After all the items stopped moving, participants point out which ones were the targets. The assumption was that observers who had tracked the targets correctly also had kept track of their individual identities. Thus they should be able not only to identify the objects as members of the target set, but also to recall other identifying information initially associated with them such as
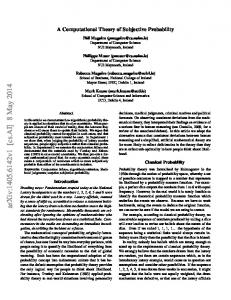
names, colors or place of origin. This experimental situation very much resembles the one that our participants experienced in the human judgments experiment. Pylyshyn found that people can track the items, but not recall their identities; in our case, people should not be able to say whether one truck is truck 1, originally starting in cell (11, 9), or truck 2 which started in cell (4, 11). These variables were removed from the log files that LSA used as input. Thus, instead of 360199 actions in 3441 trials, the reduced corpus had 3627 different actions in 3441 trials. After performing singular value decomposition on the actions by trials matrix (SVD, see Quesada, Kintsch, and Gomez, this issue), we kept 319 dimensions. Grouping participants according to performance before changes. A third independent variable was generated a-posteriori; our basic assumption was that participants with different ways of controlling the system get different results and are not completely comparable in a task with that many degrees of freedom. To alleviate this problem, we cluster participants according to their most commonly used actions. To do so, we used their log files from trials 1-16. In past studies, the ‘strategies’ have been hand-coded, implemented as a production system that is exposed to the same environmental conditions ([2][15]). The log file produced by the simulated strategy was compared to the ones from participants. Two strategies were designed: (1) a drop water strategy, based on movements to the coordinates of the fires, and actions of dropping water over them. (2) a control fire strategy, with movements to areas close to the fire front and actions directed to set up Control fires to prevent the expansion of the fire. In this study, hand coded strategies have been eliminated. Instead, we used a vector obtained by averaging all the relevant actions that appeared in the corpus. A vector for the control-fire strategy was created by averaging all 411 actions containing control-fire, and a vector for the drop-water strategy was created by averaging the 449 actions containing drop-water. These two vectors were unrelated to each other, and their cosine was -.17. Each subject’s vector was then compared to these two pure strategy vectors. Of course, real subjects do more than drop water or control fire, so the over-all cosines between the subject vectors and the strategy vectors are very low. Nevertheless, when these cosines were clustered (via K-means), three distinct and very different clusters emerged, as shown in Figure 1.
average cosine
DROP VECTOR
CONTROL VECTOR
0.08 0.06 0.04 0.02 0 -0.02 -0.04 1
2
3
cluster #
Figure 1 K-mean clusters using cosines to the drop and control strategy vectors. Thirty-one participants that preferred the dropping water actions compose the Cluster 1. Cluster 3 is representing those 19 participants that preferred to make Control fires instead. Cluster 2 is a hybrid, where people performed both actions in roughly equal proportions (33 participants). Design: There were 3 independent variables: (1) environmental change type, with two levels (wind change & appliance efficiency change), manipulated between groups, (2) cluster, with three levels (cluster 1, 2 and 3), manipulated between groups, and (3) before-after change, with two levels (4 trials immediately before change averaged, and 4 trials during the change averaged), manipulated within subject. There were two dependent variables, one product measure and one process measure: (1) Overall performance defined as the sum of all cells that remained safe subtracting the value of all burnt trucks at the end of the trial and was expressed as a proportion of the total area, and (2) Coherence, defined as the similarity of the current trial to a window including several previous trials. The more important the change in how the participant controls the system the lower the coherence becomes. The window size was 4 trials. Different numbers of trials (e.g. 5 or 3) did not change the results significantly. This window size is similar (proportionally) to the one used in Hajdukiewicz and Vicente [9], who used a window of 40 trials for a total of 220 trials. For each trial, the vectors for the four previous trials were averaged, and then compared to the vector of the current trial. The cosine between these two vectors indicated how consistent a participant was in her way of controlling the system; using this coherence measure we were able to detect when a participant has changed her approach to the task, because the cosine would drop noticeably when a change was introduced. Since we wanted to compare the change trials (17,18,19,20) to the ones before change, the sliding window was stopped before the change was introduced: the coherence measure was calculated by comparing the average of 13,14,15 and 16 to trial 17, the average of 13,14,15 and 16, to trial 18, etc. We were interested in knowing how different a participant performance is during the change trials compared to her performance during the no-change trials, and this comparison enabled us to achieve our goal.
Predictions. We predicted a drop in performance when the new environmental conditions were introduced. The drop in performance should be bigger for those participants whose log files did not show any change in their pattern of action, that is, those whose actions under the new conditions still resembled their actions on the previous trials. We also predicted that those participants who did adapt to the changes would exhibit a coherence drop.
3. Results Two mixed ANOVAs (environmental change type, cluster, EG; before–after change, IS) were performed on the two dependent variables. For Overall Performance, the significant main effects were environmental change type, [F(1.77) = 9.00, MSE = .033, p 0.20), the two groups have the same level of performance before the changes were introduced, and their coherence was approximately the same (t(80) = -0.9873, p > 0.30). Third order interactions. Since we grouped participants according to their way of controlling the system (see cluster analysis results), we could check if different clusters behaved differently when the changes were introduced. The third order interactions can answer these questions. For Overall Performance, the third order interaction was significant [ F(2,77) = 10.21, MSE = .0041, p < 0.01 ], participants assigned to different clusters and different environmental changes were affected by changes in a different way. This interaction was not significant when the analysis was performed using the Coherence measure as the dependent variable [F(2,77) = .8790, MSE = . .0061, p < 0.42 ] . However, a closer analysis reveals an interesting pattern of results. Because within-subjects analyses have no unambiguous error term (e.g. Winer, 1991), t-tests were used for this purpose. Figure 3(c) shows that participants located in cluster 3 who experienced the change in appliance efficiency were very much affected in their Overall Performance, (t(10) = 4.3458, p < 0.01). Interestingly enough, Figure 4(c) shows a very stubborn behavior, with no changes in coherence (t(10) = 0.4352, p > 0.60). Figure 4(a) shows that some participants who experienced the change in appliance efficiency were able to adapt to the change. The comparison before–after for cluster 1 participants in appliance efficiency change showed a significant drop in coherence (t(10) = 1.9495, p < 0.05), and no impoverished Overall Performance (Figure 3a) in change situations (t(10) = 1.7652, p > 0.10).
0.90
(a)
(b)
(c)
OVERALL PERFORMANCE
0.85 0.80 0.75 0.70 0.65 0.60 0.55 0.50
before
after
Cluster 1
before
after
Cluster 2
before
after
Change Appliance efficiency Change Wind direction
Cluster 3
Figure 3 Interaction between environmental change type, before–after change, and cluster group using Overall Performance a dependent variable 0.45
(a)
(b)
(c)
COHERENCE
0.40
0.35
0.30
0.25 Change Appliance efficiency
0.20
before
after
Cluster 1
before
after
Cluster 2
before
after
Change Wind direction
Cluster 3
Figure 4 Interaction between environmental change type, before–after change, and cluster group using Coherence as dependent variable .
4. Discussion and Conclusions Our analysis replicates and extends the results obtained in Quesada et al. [15] and Cañas et al., [2]. These previous studies did not compare ‘strategies’ before and after the change is introduced, although this comparison would have been relevant to their conclusions. The main reason is that their methodology provides no continuous measure of similarity between two trials. Their procedure depends on a priori defined strategies, with the similarity to these strategies coded all or nothing, using only significant correlations between matrices. Since this measure does not provide a continuous way of assessing similarity, it is not very meaningful to compare pairs of trials, or even groups of trials (averages) to individual trials. The coherence measure introduced in this paper has proved to be sensible enough to capture differences in participants’ performance before and after the change is introduced. It is informative to compare what LSA can do with the limitations of other methods, which were enumerated in the introduction of this paper. (1) The problem of using transitions between actions as the unit of analysis is that it assumes that actions depend only on the previous (and next) action. This is a strong assumption in a complex system like the ones generated in microworlds. Since LSA uses dependencies among all actions in all contexts to infer the relationships among them, it does not rely on an a-priori selected unit of analysis to represent dependency. (2) The combinatorial explosion that would render the ‘transition between actions’ procedure unusable if more variables were chosen does not affect LSA, because the SVD reduces the dimensionality of the space, making the ‘empty space phenomenon’ less of an issue. (3) The multiple regression analysis that relies on correlation is replaced with the cosine measure, which has been shown to better capture similarity relationships [10]. (4) The selection problem in designing a set of a priori strategies is alleviated, although in this particular replication, not eliminated. An abstract vector that represents, the experimenter’s hypothesis, substitutes the hand-coded, rule-based implementation of ‘strategies’. However, this part of the procedure was kept for replication purposes, and is not a necessary constituent part of the LSA method. Future analysis will not necessarily rely on it. (5) The dichotomy of the significant versus non-significant correlation is replaced by the cosine measure, a continuous one. Note that this is the first time that a method for complex problem solving task analysis enables the experimenter to select and work on the whole action if needed. We removed some of the variables in our analysis for reasons of convenience, not necessity. Furthermore, the variables that were removed were selected on the basis of empirical results (i.e., experienced participants’ comments and the results of experiments on multiple attention allocation). Through the use of LSA participants could be clustered without defining strategies by implementing production systems. This is an important advantage, for two main reasons: (1) It enables experimenters to work with systems that they do not necessarily know well enough to implements their necessities. In real applications (e.g., flying simulators or nuclear power plant control rooms) the knowledge to
implement a production system that performs theoretical strategies is, most of the time, out of reach for the experimenter; the bottom-up approach described here (abstract representation of the actions/states that represent a particular control behavior) can be implemented automatically and overcomes the expertise problem (2) For the same reason, the LSA procedure described here enables researchers to work with bigger, more complicated systems. Our results throw some light on the use of spatial information by the participants in this experiment. The only group that actually improves performance after change is the one formed by participants in cluster 3, subjected to the manipulation wind change (Figure 3c, dashed line). Interestingly enough, this group initially preferred to use Control fires (Figure1) and it adapted to the change in wind direction not by abandoning this strategy and shifting to a Drop water strategy (the Control fire Vector is not significantly different than before the changes, t(7) =1.97, p