QUANTITATIVE RESEARCH
A Data-driven Approach to Setting Trigger Temperatures for Heat Health Emergencies Sarah B. Henderson, PhD, Tom Kosatsky, MD
ABSTRACT Objectives: Unprecedentedly hot weather during the summer of 2009 resulted in considerable excess mortality in Greater Vancouver, Canada. Local municipalities and public health authorities requested a rapid, evidence-based recommendation for the temperature above which emergency action plans should be triggered to reduce potentially-avoidable mortality during future events. Methods: Candidate trigger temperatures were identified by examining the coincidence of extreme mortality days with extreme temperature days, using temperatures observed at two regional airports. Days when the two coincided between 2005 and 2009 were defined as historical heat health emergencies. Forecast and observed temperatures were combined in multiple early warning scenarios to retrospectively test the capacity to predict those heat health emergency dates, and results were expressed in terms of true positive (emergency predicted when one occurred) and false positive (emergency predicted when one did not occur) triggers. Results: Extreme mortality was observed when the 2-day average of maximum temperatures was ≥31°C at the coastal airport and ≥36°C at the inland airport. When observed and forecast temperatures were combined in different early warning scenarios, all historical heat health emergencies were correctly identified in four of twelve cases, with a minimum of two false positive triggers. Conclusions: A heat health emergency should be triggered for Greater Vancouver when the average of the current day’s 14:00 observed temperature and the next day’s forecast high is ≥29°C on the coast and/or ≥34°C inland. This condition provided 19 hours of lead time for preparation and was clearly understood by emergency responders and other users. Key words: Hot temperature; environment; public health; information dissemination La traduction du résumé se trouve à la fin de l’article.
E
xcessive mortality during unusually hot weather has been described for several cities worldwide, including Moscow in 2010,1 Paris in 2003,2 and Chicago in 1995.3 Many cities have developed heat health warning systems to trigger emergency responses and to inform their populations about upcoming episodes.4 Most systems use a two-stage approach, with lower threshold conditions triggering a “heat health advisory” and higher threshold conditions triggering a “heat health emergency”.4 One challenge in developing heat health warning systems is establishing the threshold conditions under which advisories and emergencies are triggered. Hajat et al.5 describe the two principal approaches of synoptic classification and epidemiologic evaluation. In brief, synoptic classification combines multiple meteorological measurements (temperature, humidity, air pressure, etc.) to identify the air masses most associated with excessive local mortality.4 Epidemiologic evaluation assumes that mortality is a smooth function of observed temperatures, and uses time series models to quantify the local effects. Regardless of the underlying methods, most heat health warning systems are developed using observed temperature data and implemented using forecast temperature data, with little consideration of the relationship between them. This has been highlighted as a limitation.5 Here we describe a different, more data-driven approach used to identify the trigger temperatures for heat health emergencies in Greater Vancouver, Canada. An unprecedented period of extreme © Canadian Public Health Association, 2012. All rights reserved.
Can J Public Health 2012;103(3):227-30
hot weather resulted in excessive mortality during the summer of 2009 (Figure 1),6,7 and local municipalities developed comprehensive heat health emergency action plans to mitigate the effects of future events. The plans call for actions such as modifying or cancelling outdoor public gatherings, allowing free access to public pools, opening cooling centres, and asking management of airconditioned buildings (malls, theatres, etc.) to maintain longer hours. Much of this planning was done in collaboration with local public health authorities, and in early 2010 the British Columbia Centre for Disease Control (BCCDC) was asked to provide a rapid, evidence-based recommendation for emergency trigger conditions to be used that summer. Given the human and financial resources necessary to implement the action plans, the stakeholders made it clear that tolerance for false positive events (i.e., calling a heat health emergency during weather that was not unusually hot) would be low. Authors’ Affiliation British Columbia Centre for Disease Control, Environmental Health Services, Vancouver, BC Correspondence: Sarah Henderson, BCCDC, Environmental Health Services, 655 West 12th Avenue, Vancouver, BC V5Z 4R4, Tel: 604-707-2449, Fax: 604-707-2441, E-mail:
[email protected] Acknowledgements: The British Columbia Centre for Disease Control gratefully acknowledges the guidance and contributions of our partners at the Vancouver Coastal Health Authority, Fraser Health Authority, Environment Canada, and Health Canada. Conflict of Interest: None to declare.
CANADIAN JOURNAL OF PUBLIC HEALTH • MAY/JUNE 2012 227
IDENTIFYING HEAT HEALTH EMERGENCY DAYS
Figure 1.
80
Daily mortality in Greater Vancouver during the summer of 2009, showing daily low and high temperatures observed at the Vancouver Airport
Deaths High Temperature Low Temperature
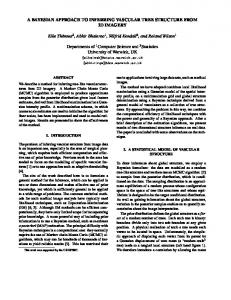
Figure 2.
35
Daily summer (June through August) mortality in Greater Vancouver for the years 2005 through 2009, box plotted by one-degree bins of the 2-day average of maximum temperatures observed at Vancouver (coastal) and Abbotsford (inland) International Airports
30
40 15
99th mortality percentile 99th temperature percentile Candidate trigger
404 days 28 days
13 days
7 days
4 days
1 day
298 days 32 days
29 days
24 days
20 days
23 days
26
27
28
29
1 day
1 day
1 day
8 days
10 days
9 days
2 days
1 day
1 day
2 days
1 day
30
31
32
33
34
35
36
37
June
July 2009
August
0
Temperatures of 34°C at the end of July were the highest on record at this location.
METHODS Data sources Daily all-age, all-cause mortality counts in Greater Vancouver were obtained from the BC Vital Statistics Agency for 2005 through 2009. Daily temperatures were downloaded from Environment Canada for the Vancouver (coastal, 10 km from the city centre) and Abbotsford (inland, 70 km from the city centre) International Airports during the same period. Historically-issued forecasts for Vancouver and Abbotsford were obtained from Environment Canada for the years of 2005 through 2009. Temperature forecasts for today and tomorrow are made by Environment Canada meteorologists using various computer models and output as well as conceptual knowledge of local weather. For metropolitan-area Vancouver in summertime, meteorologists consider whether high temperatures forecast across the city vary by ≥4°C from the waterfront to the inland suburbs. If so, they assign a range in the forecast (near the water and inland), and we used “near water” highs whenever this was done. If not, they assign a single, regional high based on an average of temperatures across the region. A single high value is usually assigned for Abbotsford, where temperatures are less variable [Personal Communication. Lundquist D, Senior Meteorologist, Environment Canada, Kelowna, BC. Telephone conversation (October 21, 2011) with Henderson re temperature forecasting process for Greater Vancouver, BC]. During the summer months (June through August), forecasts were issued three times daily at approximately 05:00, 11:00 and 16:00. The 05:00 and 11:00 forecasts included high and low temperatures for today and tomorrow, while the 16:00 forecast included high and low temperatures for tomorrow only. Average temperatures were not forecast.
Identification of candidate triggers Candidate triggers were identified by examining the coincidence of extreme regional mortality days (≥99th percentile of all mortality between June and August) with extreme temperature days (≥99th percentile of all temperatures between June and August, evaluated separately for each airport). The dates on which they coincided were defined as historical heat 228 REVUE CANADIENNE DE SANTÉ PUBLIQUE • VOL. 103, NO. 3
Abbotsford
5
Daily Deaths
10
20
0
Vancouver
20
Temperature (C)
Deaths
25
Daily Deaths
60