A Data Mining Approach to Identify Key Factors in Dependability Experiments Gergely Pintér1, Henrique Madeira2, Marco Vieira2, István Majzik1, András Pataricza1 1
Budapest University of Technology and Economics, Department of Measurement and Information Systems 2 CISUC, University of Coimbra {pinterg, pataric, majzik}@mit.bme.hu,
[email protected],
[email protected]
Abstract. Our paper presents a novel approach for identifying the key infrastructural factors determining the behavior of systems in the presence of faults by the application of intelligent data processing methods on data sets obtained from dependability benchmarking experiments. Our approach does not rely on a-priori assumptions or human intuition about the dominant aspects enabling this way the investigation of highly complex COTS-based systems. The proposed approach is demonstrated using a commercial data mining tool from IBM on the data obtained from experiments conducted using the DBench-OLTP dependability benchmark. Results obtained with the proposed technique identified important key factors impacting performance and dependability that could not have been revealed by the dependability benchmark measures.
1 Introduction It is widely recognized that the evaluation of dependability features in computer systems is a complex task. Traditional techniques based on analytical and simulation models have to be complemented with experimental approaches based on measurements taken from prototypes and (when possible) from real systems in the field. These experimental techniques, including fault injection, robustness testing, and field measurements, have been extensively used to evaluate specific fault tolerance mechanisms, validate robustness of software components, or to assess the general impact of faults in systems. In spite of the big diversity of techniques and tools now available, all the experimental dependability evaluation approaches share a common problem: they tend to produce a large amount of raw data that have to be processed to obtain the desired dependability measures or to get useful information on how the target systems behave in the presence of faults. Very often the analysis of the experimental data is quite complex, as it has to take into account many aspects of the experimental setup such as the target system architecture and configuration, the workload, the type of faults involved, the environmental aspects, etc. Surprisingly, the problem of coping with the large size of the experimental data sets and the high complexity of the data analysis has received less attention in the dependability research effort. Researchers have fo-
cused on the development of fault injection and robustness testing tools and on the mitigation of problems such as experiment representativeness, intrusiveness and portability of tools, just to name some of them, and only a few papers deal with experimental data analysis, e.g. [Pataricza 2001, Pintér 2003, Madeira 2003]. In fact, many dependability evaluation tools such as fault injection and robustness testing tools have been proposed (e.g., Ferrari [Kanawati 92], Mafalda [Rodríguez 99], Xception [Carreira 98], Balista [Koopman 97], NFTAPE [Stott 00], GOOFI [Aidemark 01]) but all these tools either provide rudimentary means to analyze data or, more frequently, just store the raw results in a spreadsheet format. Although this approach can be acceptable for very specific (and simple) analysis, it is clearly not enough when the analysis required is complex or when the amount of raw data is very large. A recent newcomer to the bag of experimental dependability evaluation techniques is the dependability benchmarking family. This new approach actually represents an attempt to standardize experimental techniques with the goal of comparing dependability features of different systems or components. This research effort has already caught the attention of companies such as Sun Microsystems [Zhu 2003a], IBM [Lightstone 2003] and Intel [Constantinescu 2003], and lead to many dependability benchmark proposals, covering domains such as transactional systems [Vieira 2003b, Buchacker 2003, Mauro 2004], web servers [Durães 2004b], and operating systems [Kalakech 2004]. Even topics such as human faults [Brown 2004] or hardware maintenance [Zhu 2003] have already been subject of dependability benchmark proposals. Dependability benchmarks represent a new and important source of raw experimental data but the problem of analyzing that data has been even more neglected than in traditional fault injection and robustness testing. In fact, dependability benchmarks rely on a typically small set of measures and the data collected during the benchmark runs is just used to calculate the measures defined in the benchmark specification. Furthermore, dependability benchmarking (and traditional fault injection as well) relies on a-priori assumptions about what are the measures we would like to improve (response time, throughput, availability etc.) and the benchmark performer should know what are the infrastructural attributes that determine these measures (e.g., CPU performance, disk bandwidth, operating system), as her/his goal is to tune the system under benchmark to deliver the best performance and dependability. Although this approach has been beneficially applied for improving systems of relatively low complexity it does not scale well to complex systems actually used in real applications. In order to overcome this issue an automated mechanism is needed that supports the identification of key infrastructural factors by highlighting the potentially interesting phenomena in the large experiment database. On one hand this approach eliminates the need for a-priori human knowledge; on the other hand it avoids some bias coming from some human belief. Our paper proposes a novel approach for identifying the key infrastructural factors determining the behavior of systems in the presence of faults by the application of intelligent data processing methods that have already been successfully applied in the business field for extracting previously unknown knowledge from large databases. The key idea of our approach is to perform benchmarking experiments on multiple configurations by applying different implementations of the same COTS component (e.g., different hardware setups, operating systems) and record as much information as
possible about the infrastructure and the delivered performance and dependability attributes. On the basis of this information data mining experiments are carried out to identify which infrastructural factors were really relevant enabling the developers to improve the system without a-priori assumptions. The structure of the paper is as follows: after providing an overview about data mining (Sect. 2) we briefly describe the experiment setup and the key benchmark components acting as the source of experimental data investigated in our work (Sect. 3). Sect. 4 discusses how to apply data mining for identifying the key factors that determine the behavior of systems in the presence of faults. Our observations in case of the DBench-OLTP experiment are discussed in Sect. 5. Finally Sect. 6 concludes the paper and outlines the directions of future research.
2 Background on data mining Data mining is usually defined as an interdisciplinary field bringing together techniques from machine learning, pattern recognition, statistics, databases, and visualization to address the issue of extracting previously unknown, valid and actionable information from large databases to be used for making crucial business decisions [IBM 1999]. Our approach aims at porting data mining from the business field to the dependable computing domain for exploiting its benefits for automatic identification of key factors that determine specific performance and dependability attributes of systems in presence of faults. Methods of data mining can be grouped in three families: • Predictive modeling resembles the human learning experience, where we learn how to classify real-world objects into abstract categories by identifying the essential underlying characteristics of phenomena amongst the possibly high number of less important attributes. For example young children learn how to classify animals as cats and dogs by realizing that however animals are characterized by very large number of attributes (size, color, body structure, etc.) and many of them are not specific to any classes (e.g., there are cats and dogs of the same color, size) there are some key factors that can be used for assigning them to classes (e.g., the voice, body structure). The goal of predictive modeling is to build similar models by analyzing a teaching data set and identifying the attributes and their relations that represent the key factors for classifying database records using statistical methods. A typical business situation for building predictive models is when a company is interested in understanding the key aspects of customer behavior (e.g., which customers are going to leave the company) by identifying the dominant attributes (age, purchased products etc.) [IBM 1999]. • Database segmentation aims at partitioning a database in segments of similar records i.e., ones that share a number of properties and so are considered to be homogeneous. A typical business application of database segmentation is the identification of typical customer groups (e.g., highly paid urban women, male university students) to be addressed appropriately. • The goal of link analysis is to establish links (associations) between individual records or sets of records in the database. In business applications link analysis is
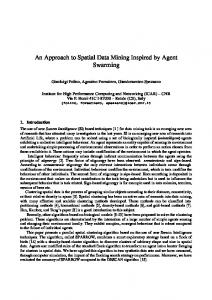
typically used for identifying products that tend to be sold together (market basket analysis) or for understanding long-term customer behavior for planning timely promotions etc. Since our goal is to automatically identify key factors that determine specific attributes of systems in presence of faults, we selected the classification method, which is an implementation of the predictive modeling technique. Classification aims at establishing a specific class for each record in a database. The class must be one from a finite set of possible and predetermined class values. The input of the method is a teaching data set that presents the correct answer for some already solved cases; the output is a decision tree where leaves are the predicted classes and the internal nodes are atomic decisions (i.e., very simple predicates involving a single attribute e.g., “the color of the persons hair is black”, “the age of the person is below 14”). The key attributes identified by the algorithm are this way in the predicates of the atomic decision nodes. A typical business application example [IBM 1999] is depicted in Fig. 1. an insurance company interested in understanding the increasing rates of customer attrition. A predictive model has determined that the two attributes of interest are: the length of time the client has been with the company (Tenure) and the number of services that the client uses (Services). The decision tree presents the analysis in an intuitive way. Having built the decision tree on the basis of previously experienced behavior, the company can use it to predict the future behavior of its current customers and try to convince the ones who are likely to leave to stay with the company with special advertisement campaigns etc. It is important to highlight that although the usual business application of the classification method is to predict future behavior, our goal is somewhat different: we don’t want to predict anything (i.e., to use the algorithm built by the method) but we are interested in the classification algorithm itself. We will use the tree built by the method to recognize dominant factors (i.e., the attributes in the decision nodes).
Fig. 1. Decision tree built by the classification method
Technically speaking a decision tree corresponds to a graph of SQL SELECT commands on the teaching set. Each SELECT divides the actual data set in two subsets. Classes are assigned to the resulting subsets by identifying the most frequently
occurring value of the predicted attribute (e.g., performing the SELECT corresponding to the “Services < 3” predicate on the data set selected by the “Tenure