Oct 13, 2009 - [1] Luc Vincent and Soille Pierre, âWatersheds in digital spaces: An efficient algorithm based on immersion simu- lations,â IEEE Transactions of ...
Lawrence Berkeley National Laboratory
Title: A DELAUNAY TRIANGULATION APPROACH FOR SEGMENTING CLUMPS OF NUCLEI Author: Wen, Quan Publication Date: 10-13-2009 Publication Info: Lawrence Berkeley National Laboratory Permalink: http://escholarship.org/uc/item/02z6p6s2 Keywords: nuclear segmentation, Delaunay triangulation, geometric grouping. Abstract: Cell-based fluorescence imaging assays have the potential to generate massive amount of data, which requires detailed quantitative analysis. Often, as a result of fixation, labeled nuclei overlap and create a clump of cells. However, it is important to quantify phenotypic read out on a cellby-cell basis. In this paper, we propose a novel method for decomposing clumps of nuclei using high-level geometric constraints that are derived from low-level features of maximum curvature computed along the contour of each clump. Points of maximum curvature are used as vertices for Delaunay triangulation (DT), which provides a set of edge hypotheses for decomposing a clump of nuclei. Each hypothesis is subsequently tested against a constraint satisfaction network for a near optimum decomposition. The proposed method is compared with other traditional techniques such as the watershed method with/without markers. The experimental results show that our approach can overcome the deficiencies of the traditional methods and is very effective in separating severely touching nuclei.
eScholarship provides open access, scholarly publishing services to the University of California and delivers a dynamic research platform to scholars worldwide.
A DELAUNAY TRIANGULATION APPROACH FOR SEGMENTING CLUMPS OF NUCLEI Quan Wen1,2 , Hang Chang1 , and Bahram Parvin1 1
2
Lawrence Berkeley National Laboratory, Berkeley, CA 94720 School of Computer Science & Engineering, Univ. of Electronic Sci. & Tech. of China ABSTRACT
Cell-based fluorescence imaging assays have the potential to generate massive amount of data, which requires detailed quantitative analysis. Often, as a result of fixation, labeled nuclei overlap and create a clump of cells. However, it is important to quantify phenotypic read out on a cell-by-cell basis. In this paper, we propose a novel method for decomposing clumps of nuclei using high-level geometric constraints that are derived from low-level features of maximum curvature computed along the contour of each clump. Points of maximum curvature are used as vertices for Delaunay triangulation (DT), which provides a set of edge hypotheses for decomposing a clump of nuclei. Each hypothesis is subsequently tested against a constraint satisfaction network for a near optimum decomposition. The proposed method is compared with other traditional techniques such as the watershed method with/without markers. The experimental results show that our approach can overcome the deficiencies of the traditional methods and is very effective in separating severely touching nuclei. Index Terms— nuclear segmentation, Delaunay triangulation, geometric grouping. 1. INTRODUCTION Responses of tissues and cell-based assays are often heterogeneous, which require a large collection of samples to be imaged. The main advantage of the cell-based assays is in a large number of readouts, where every individual cell can be considered as a single sensor responding to the environmental perturbation. Therefore, it is necessary to delineate each cell from its surrounding populations. However, there are a significant number of technical and biological variations. Technical variations can be as a results of sample preparation, fixation, seeding density, and staining. On the other hand, biological variations often originate from different cell types, cells being in a different states, spatial organization of the cells, and the fact that cells respond differently to perturbations and This work was partially supported by the Department of Energy, Office of Biological and Environmental Research, and National Institute of Health under contract number DE-AC02-05CH1131 with the University of California.
their microenvironment. These coupled variations can lead to an overlap of cellular compartments, thus requiring advanced segmentation methods. In this paper, we focus on the segmentation of fixed cells, stained for their nuclear compartments, which sometimes form a clump as a result of seeding density or morphological properties. Our model-based method, assumes that each nucleus is almost convex, and infers convex regions by grouping points of maximum curvature along the contour of clump. The main thesis is that points of maximum curvature provide islands of saliency that help partition a clump of nuclei. This formulation has the potential to be computationally expensive; however, since only neighboring points of curvature can be grouped to form a hypothesis, the search space can be significantly reduced. Furthermore, by using Delaunay triangulation, the search space can be methodically constructed in the absence of any heuristic by automatically inferring neighborhood configuration while reducing the number of free parameters. The spatial organization of the Delaunay triangulation enables the additional application of geometric constraints for inference of convex regions. The rest of the paper is organized as follows. A literature review is presented in Section 2. The details of our approach are introduced in Section 3, and the experiment and comparison results are discussed in Section 4. Conclusions and future work are given in Section 5. 2. PREVIOUS METHODS Current techniques in segmentation of clumped nuclei can be partitioned into model-free and model-based methods. An example of the model-free approach is the watershed method coupled with distance transform [1]. On the other hand, model-based methods can be parametric (e.g., Hough transform) or nonparametric. A few examples of modelbased nonparametric methods are reviewed below. In [2], the segmentation problem was initially constrained by inferring seeds corresponding to nuclear regions through iterative radial voting [3]. These seeds corresponded to an approximate location of the center of mass for each nucleus, thus partitioning the regions between the seeds through Voronoi tessellation for further refinement. In [4], the segmentation problem was expressed by detecting convex regions that are
3. APPROACH
0.7 0.6
Curvature k
partitioned from points of maximum curvature along the foreground. Our proposed method is an extension of the method proposed by Raman [4], where grouping of the points of maximum curvature is derived from higher-level Delaunay triangulation. As a result, (i) an exponential computational complexity is reduced to an almost linear complexity; (ii) the number of free parameters is drastically reduced; and (iii) a more complex clump can now be decomposed, which was almost impossible do during our previous implementation. An important step of the segmentation process is to identify points of maximum curvature along the boundary of the clump. Previous methods have also suggested convex hull [5] and polygon fit as precursors for detecting points of maximum bend. We suggest that by computing curvature along the contour more robust and accurate results can be archived.
0.5 0.4 0.3 0.2 0.1 0 −0.1 0
1000
1500
1986
Boundary Point
(a)
(b)
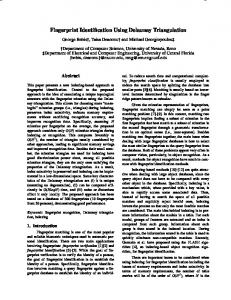
Fig. 2. Curvature profile on the boundary. The detected points of positive maximum curvature are marked with red plus signs. Points of the outer and inner boundaries are in the range [1, 1986] and above 1986, respectively. �� � ��
� � � ���
Start
500
��
� �
Segmenting image into foreground and background Detecting points of maximum curvature along the contour Triangulating points of maximum curvature by Delaunay triangulation Applying geometric constraints for edge inference
End
Fig. 1. Flow chart of our approach. Our approach consists of several steps as illustrated in Fig. 1. First, the original image is segmented into foreground and background by an iterative threshold selection method. Then points of maximum curvature are computed along the object contour, followed by the Delaunay triangulation of these points. Finally, geometric constraints are applied through edge inference to get the final segmentation results. The details of major steps are presented in the following subsections. 3.1. Detection of Points of Maximum Curvature 0 00 0 00 x , where The curvature is computed by using k = (xx02y+y−y 02 )3/2 x and y are coordinates of the boundary points. The derivatives are computed by convoluting the boundary with Gaussian derivatives. An example of detected points of maximum curvature whose k values are larger than threshold λk are shown in Fig. 2(a) and Fig. 2(b). We denote the ith point of local maximum curvature as vi , and the set of point of maximum curvature of one connected
Fig. 3. Geometric attributes of points of maximum curvature of every hypothesis edge. component as V = ∪M i=1 vi , where M is the total number of point of maximum curvature of this connected component. 3.2. Delaunay Triangulation of Points of Maximum Curvature 3.2.1. Size of Hypothesis Space It should be clear that the size of hypothesis space for potential edge configuration is very large. In this section, we examine the size of this space in order to justify triangulation and exploiting inherent locality. As shown in Fig. 3, let eij be the edge connecting two points vi and vj . We then characterize it by (Ti , Tj , βij , βji ), in which (i) Ti and Tj are unit vectors representing the contour tangent directions at vi and vj , and (ii) βij and βji are the angles formed by Ti , Tj and eij . Furthermore, the set of all edges are then denoted as E = ∪eij for i, j ∈ {1, · · · , M }. Let θ ∈ E be a decomposition of the configuration space Ω. The number of possible decomposition in this space is |Ω| = 2M . Our aim is to recover a decomposition of θ ∗ that best fits a set of geometric constraints. For an inferred edge eij and its attributes, these constraints are: (i) that it must be inside the clump; (ii) that the angle between Ti and Tj should be maximized (e.g., they should be antiparallel); (iii) that βij , βji should be as close as possible to π/2; and (iv) that it must not intersect other edges. If more than one θ pass the geometric constraint test, then the hypothesis with the best metric for convexity is accepted, P where convexity is defined as C = −N + N φ i=1 i /π. Here,
(a) Delaunay triangulation
(c) Edge pruning
(a)
(b)
(c)
(d)
(b) No background edges
(d) Edge inference
Fig. 4. Edge refinement through the constraint satisfaction network.
Fig. 5. Results of synthetic data. (a) is the synthetic image. (b), (c), and (d) are results of watershed, marker-guided watershed, and our method, respectively. 3.3.2. Edge Set Selection by Inference
φi is the sum of the tangent angles formed along the contour of the ith partition, and N is the total number of decomposed partitions of the clump. 3.2.2. Delaunay Triangulation for Hypotheses Generation The DT approach is applied to hypothesize potential edges. Its following properties are suitable for our purpose: (i) edges in DT do not intersect with each other, and (ii) the Euclidean minimum spanning tree (EMST) is a subgraph of DT. As can be seen in Fig. 4(a), DT (V ), the DT of point set V , is able to provide meaningful edge information with less redundancy than Ω for further processing. Furthermore, the number of edges is reduced from M (M + 1)/2 to less than 3(M − 2) with a computation complexity of O(M log M ). 3.3. Enforcement of Geometric Constraints 3.3.1. Edge Set Pruning Using Geometric Constraints DT edges provide a natural way of perceptually grouping the points of maximum curvature to cut the clump without considering geometrical properties at each point. Nonetheless, its size can still incur high computational costs to find θ ∗ . Therefore, based on the attributes of each edge, DT (V ) can be further reduced by using the following three additional edge pruning rules: (i) deleting edge crossing the background; (ii) deleting edge eij if (TiT · Tj ) > λT ; and (iii) deleting edge eij if max(|TiT · eij /|eij ||, |TjT · eji /|eji ||) > λβ . Here, λT and λβ are thresholds. Pruning rules (ii) and (iii) are corresponding to geometric constraints (ii) and (iii) mentioned in Section 3.2.1, respectively. The results from applying the first pruning rule and additional results from the other two rules are shown in Fig. 4(b) and Fig. 4(c), respectively.
After edge pruning has been applied, the resulting edge set becomes sparse and ready for the application of simple inference rules to get θ ∗ . Denoting the input and output edge sets as Ein and Eout , with point set Vin and Vout , respectively, and deg(vi ) as the degree of point vi in the edge set, the algorithm for edge inference is summarized as follows: 1. Let Ein be the edge set after edge pruning, and Eout← ∅. 2. While Ein 6= ∅ (a) In Vin , if deg(vi ) = 1, then Ein ← Ein \ eij and Eout ← Eout ∪ eij . (b) In Eout , if eij ∈ Eout , then Ein ← Ein \ei∗ \ej∗ , where ∗ stands for vertices. (c) If eij ∈ Ein , ejk ∈ Ein , and eki ∈ Ein , with deg(vi ) = 2, deg(vj ) = 2, and deg(vk ) = 2, then Ein ← Ein \ eij \ ejk \ eki , and Eout ← Eout ∪ eij ∪ ejk ∪ eki . 3. For vi ∈ V with no ei∗ ∈ Eout . Use its tangent normal direction to generate an edge into Eout . 4. For eij ∈ Eout , ejk ∈ Eout , and eki ∈ Eout , with deg(vi ) = 2, deg(vj ) = 2, and deg(vk ) = 2, choose the two edges which produce the minimum convexity after decomposition, and delete the remaining one from Eout . In the case where |V | = 1, Ein is set to be ∅. For the case where |V | = 2, we set Ein = {e12 } if e12 passes the edge pruning test, and Ein = ∅ if not. As shown in Fig. 4(d), the connected component is correctly decomposed into convex regions by the final edge set θ ∗ = Eout . 4. EXPERIMENTAL RESULTS We have (i) examined the behavior of the method with synthetic data; (ii) validated the technique with real data; and
(a)
(b)
(c)
were acquired. Each image has roughly 100 cells. Again, the watershed method suffered from oversegmentation while the marker-based approach reduced the amount of oversegmentation. However, the marker-based approach did not decompose some of the touching nuclei. In contrast, our method consistently performed better than the marker-based approach. Comparative results for three different images are shown in Fig. 6. 5. CONCLUSIONS AND FUTURE WORK
(d)
(e)
(f)
(g)
(h)
(i)
In this paper, we proposed a new approach for segmenting clumps of nuclei by using the points of maximum curvature as a basis for Delaunay triangulation. Triangulation provides a set of hypotheses for boundary completion through a constraint satisfaction network. We have defined a set of geometric constraints that facilitates hypothesis verification. Additionally, the proposed method was compared with markerbased watershed segmentation to demonstrate an improved performance profile. Our continued research focuses on incorporating (i) learning and (ii) automatic selection of parameters for clump decomposition. Learning enables additional filtering of false positive segmentation, and automatic parameter selection removes ambiguities associated with parameter selection (e.g., threshold for curvature maxima). A potential methodology will be to place the segmentation step in a feedback loop for improved performance and usability. 6. REFERENCES
(j)
(k)
(l)
Fig. 6. Results of real data. The original image, watershed results, marker-guided watershed results, and our method results are in the first, second, third, and forth rows, respectively.
(iii) compared the performance of the method with a leading method in the literature. The parameter settings are λβ = 0.9, λT = −0.15, and λk = 0.1, which are set empirically. With respect to comparison with the previous literature, we have opted to test the watershed method with distance transform [1], since it is widely used by the microscopy community. In the synthetic test, objects were generated randomly, and noise was added, as shown in Fig. 5(a). This experiment shows that the marker-guided watershed reduces oversegmentation as compared with the original watershed method. Nonetheless, the result lacks smoothness along inferred edges, and there is an inherent loss of accuracy. In contrast, our proposed method partitions the clump along the expected locations (e.g., points of maximum curvature) while eliminating oversegmentation. In the case of real data, a set of 10 DAPI-stained images
[1] Luc Vincent and Soille Pierre, “Watersheds in digital spaces: An efficient algorithm based on immersion simulations,” IEEE Transactions of Pattern Analysis and Machine Intelligence, vol. 13, no. 6, pp. 583–598, June 1991. [2] Hang Chang, Qing Yang, and Bahram Parvin, “Segmentation of heterogeneous blob objects through voting and level set formulation,” Pattern Recognition Letters, vol. 28, pp. 1781–1787, 2007. [3] Bahram Parvin, Qing Yang, Ju Han, Hang Chang, B. Rydberg, and M.H. Barcellos-Hoff, “Iterative voting for inference of structural saliency and characterization of subcellular events,” IEEE Transactions on Image Processing, vol. 16, no. 3, pp. 615–623, March 2007. [4] Sree Raman, Christopher A. Maxwell, Mary Helen Barcellors-Hoff, and Bahram Parvin, “Geometric approach to segmentation and protein localization in cell culture assays,” Journal of Microscopy, vol. 225, no. 1, pp. 22–30, 2007. [5] Qing Yang and Bahram Parvin, “Chef:convex hull of elliptic features for 3d blob detection,” in Proceedings of the International Conference on Pattern Recognition, Qubec, Canada, Aug 11-15 2002, vol. 2, pp. 282–285.


![[inria-00485915, v1] Delaunay Triangulation of ...](https://m.moam.info/img/260x300/inria-00485915-v1-delaunay-triangulation-of-_5b85cc58097c47b73c8b45fc.jpg)


