A Diagnostic Tool for Tree. Based Supervised. Classification Learning. Algorithms. Geoffrey Holmes and Leonard Trigg. Department of Computer Science.
A Diagnostic Tool for Tree Based Supervised Classification Learning Algorithms Geoffrey Holmes and Leonard Trigg Department of Computer Science University of Waikato Hamilton New Zealand {geoff,trigg}@cs.waikato.ac.nz
Abstract The process of developing applications of machine learning and data mining that employ supervised classification algorithms includes the important step of knowledge verification. Interpretable output is presented to a user so that they can verify that the knowledge contained in the output makes sense for the given application. As the development of an application is an iterative process it is quite likely that a user would wish to compare models constructed at various times or stages. One crucial stage where comparison of models is important is when the accuracy of a model is being estimated, typically using some form of cross-validation. This stage is used to establish an estimate of how well a model will perform on unseen data. This is vital information to present to a user, but it is also important to show the degree of variation between models obtained from the entire dataset and models obtained during crossvalidation. In this way it can be verified that the cross-validation models are at least structurally aligned with the model garnered from the entire dataset. This paper presents a diagnostic tool for the comparison of tree-based supervised classification models. The method is adapted from work on approximate tree matching and applied to decision trees. The tool is described
together with experimental results on standard datasets.
1. Introduction In practical applications of machine learning and data mining it is often important to present interpretable output to users and to demonstrate the credibility of what has been learned by careful evaluation. Many practitioners present users with a model of their data constructed from the entire dataset for them to interpret, and use cross-validation as the method of choice for evaluation. The process of developing applications in machine learning and data mining is widely recognised as being iterative (Aha and Riddle, 1995). Between iterations new training data may be added, different attribute selections may be included for consideration, or the method of deriving specific attributes may change. The changes introduced to the models built will often be of as much interest to the users as differences in model performance. Currently, developers use error rate as the main means of comparing models on the assumption that classification accuracy is of primary concern. Procedures that seek to enhance the classification accuracy of a learning algorithm such as boosting, bagging and stacking reinforce this assumption at the cost of effectively rendering the model a black box. This situation is the result of placing too much emphasis on classification accuracy (Provost, Fawcett and Kohavi, 1998) and a paucity of diagnostic tools for evaluating the knowledge contained in multiple models. The emerging standard in machine learning for estimating the error rate is to use stratified tenfold cross-validation. The data is divided randomly into ten parts, in each of which the class is represented in roughly the same proportion as in the entire dataset. Each of the ten parts is held out in turn while the learning scheme builds a model from the remaining nine parts. The holdout part at each iteration is used for testing which results in an error
estimate. The ten error estimates are averaged to produce an overall estimate of error. Many practitioners go beyond a single ten-fold cross-validation to obtain a better error estimate by reducing the random variation that can occur in choosing the parts. Although there is no consensus in the field, a common practice is to repeat this single ten-fold crossvalidation ten times, giving rise to the construction and evaluation of one hundred models. Given this approach, a user might legitimately ask questions about how representative the model obtained from the entire dataset is when compared to the individual models constructed during cross-validation, and how much variation there is between the cross-validation models themselves. For general supervised classification learning this is a problem. However, many classification methods are based on ordered trees (Quinlan, 1993) and advances in approximate tree matching (Zhang and Shasha, 1989) provide an opportunity to explore this question. This paper presents a diagnostic tool for comparing two decision trees and demonstrates its application in evaluating the variation in trees constructed under crossvalidation. The tree matching algorithm is briefly described in Section 2. The algorithm employs an edit-distance approach and as such there is a requirement to assign penalties to various mismatches between trees; these are covered in Section 3. Section 4 presents an experimental evaluation on standard datasets where we estimate the variation of models constructed from the entire dataset with models constructed during cross-validation and the variation of the models at each iteration. Section 5 concludes with a discussion of the results and the prospects for future work on this problem.
Algorithms exist for both exact (Hoffman and O'Donnell, 1982) and approximate tree matching (Wang, et al, 1994). Applications for these techniques include the retrieval and extraction of information from databases of tree-like structures such as RNA structures in molecular biology (Shapiro and Zhang, 1990), lexical dictionaries in natural language processing (Kai, 1979), and intermediate code representations in programming language research (Aho et al, 1989). In what follows, we briefly illustrate the main ideas behind tree matching. A complete treatment of the topic can be found in (Zhang and Shasha, 1989). The main principle is to view tree comparison as an editing procedure. Given two trees T1 and T2, we fix one tree, T1 say, and then attempt to transform T2 by a series of edit operations so that it matches T1. Each edit operation incurs a cost, and the minimum cost edit sequence that transforms one tree to the other is referred to as the edit distance between the two trees. A common use of edit distance is for string matching, where the edit operations are to change (or relabel) a character, insert a character, or delete a character. Each of these operations has a counterpart in tree matching. The relabel operation simply changes the label associated with a node. An insert operation adds a node as a child of another, possibly between the parent and an existing child. A delete operation removes a child of a node, and any of its children are raised to become children of the parent node. Title: ExampleTree Creator: dot version uwin97 (4-15-97) Preview: This EPS picture was not saved with a preview (TIFF or PICT) included in it Comment: This EPS picture will print to a postscript printer but not to other types of printers
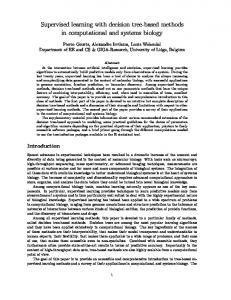
2. Tree Matching Figure 1: Two example trees
Figure 1 illustrates the principle with two simple trees whose nodes and leaves contain single characters. In order to transform the tree on the left into the tree on the right we must perform one of each of the edit operations in the sequence: delete node D (which raises node E to be an immediate child of A), relabel node F as G, and insert node D above node A. If each edit operation incurs a unit cost then the edit distance between these two trees is 3. The edit distance can be calculated using dynamic programming and this leads to a time complexity of O(|T1| × |T2| × min(depth(T1), leaves(T1)) × min(depth(T2),leaves(T2))) where leaves(T1) is the number of leaves in T1. This time complexity makes the algorithm eminently suitable for applications in machine learning and data mining.
3. Matching Decision Trees To adapt the basic tree matching algorithm to decision trees we need to carefully consider the node label representation and assign costs to each of the edit operations. In the following section we consider the decision trees produced by C4.5 (Quinlan, 1993) with default settings, although the differences produced by other options (such as making nominal attribute splits binary rather than multi-way) or other algorithms can easily be accommodated. 3.1 Node Structure Decision trees have attribute tests at interior nodes and attributes can be either nominal or numeric. In both cases the test outcomes are usually associated with the branches emanating from the node rather than the node itself—the node merely states the name of the attribute. For nominal attributes a new child node is created for each of the possible values and the equality test is associated with each of the child branches. For numeric attributes only two branches are created, one for values less than or equal to a split value (the left child) and one for values greater than the split value.
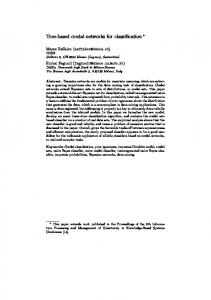
This format has to be re-worked to fit in with the matching algorithm which associates all activity with a node (not its branches). For nominal attributes we simply match on the attribute name, assuming that the ordering of child nodes is consistent between trees, and that the number of child nodes for a particular attribute test is constant between trees. For numeric attributes we match the attribute name and its split value, assuming the ordering that values less than or equal to the split value will go down the left child and values greater than the split value will go down the right child. Figure 2 illustrates the format for numeric attributes. 3.2 Edit Operations Insert and delete operations both incur a unit cost as in the general case, however, relabeling involves four cases: 1. A leaf of class c1 compared with a leaf of class c2. 2. A leaf compared with an attribute test. 3. An attribute test on a1 compared with an attribute test on a2. 4. An attribute test on a1 with value v1 compared with an attribute test on a1 with value v2. We consider case 1 to be an operation that should be performed when all other options have failed and accordingly assign a cost of 2. Cases 2 and 3 have unit cost as they are straightforward relabeling operations. Case 4 occurs in the comparison of range splits on numeric attributes. In this case we would like a cost varying between 0 and 1 which favours small differences between the two values. As attributes may have vastly different scales we normalize the split value difference by the range of the tested attribute, giving the formula: | v1 - v2 | cost = max a1 -min a1 Figure 2 illustrates the problem for case 4 with an example taken from the familiar iris dataset. The minimum cost edit sequence to
transform the tree on the left involves deleting the non-root Petal width nodes and their rightmost leaf nodes (giving a cost of 4). We are left with two trees with the same structure but with different tests associated with the Petal length node. The tree on the left has a split value of 4.9 while the tree on the right has a split value of 4.7. The observed Petal length values range from 1.0 to 6.9. In this case we 4 . 9 - 4 .= 7 |0.03, adding would compute a cost of | 6.9-1.0
Title: J48Tree Creator: dot version uwin97 (4-15-97) Preview: This EPS picture was not saved with a preview (TIFF or PICT) included in it Comment: This EPS picture will print to a postscript printer but not to other types of printers
negligible cost to the complete transformation.
Figure 2: Two example decision trees for classification.
4. Experimental Results In order to evaluate the performance of the tree matching algorithm on a diverse set of data, experiments were performed using twenty
Dataset anneal audiology autos balance-scale breast-cancer colic glass heart-c heart-h hepatitis hypothyroid iris labor lymphography mushroom sonar soybean vote vowel zoo
Number of instances 898 226 205 625 286 386 214 303 294 155 3772 150 57 148 8124 208 683 435 990 101
(%) Missing attributes 0.0 2.0 1.1 0.0 0.3 23.8 0.0 0.2 20.4 5.6 5.5 0.0 3.9 0.0 1.4 0.0 9.8 5.6 0.0 0.0
Numeric attributes 6 0 15 4 0 7 9 6 6 6 7 4 8 3 0 60 0 0 10 1
Table 1: Datasets used in the experiments
Nominal
Classes
32 69 10 0 9 15 0 7 7 13 22 0 8 15 22 0 25 16 3 15
5 24 6 3 2 2 6 2 2 2 4 3 2 4 2 2 19 2 11 7
Dataset anneal audiology autos balance-scale breast-cancer colic glass heart-c heart-h hepatitis hypothyroid iris labor lymphography mushroom sonar soybean vote vowel zoo
Default 23.83 74.78 67.32 54.24 29.72 36.96 64.49 45.54 36.05 20.65 7.71 66.67 35.09 45.27 48.20 46.63 86.53 38.62 90.91 59.41
Cross-val error 1.28 22.39 18.29 22.00 27.34 14.89 31.40 24.42 20.78 20.58 0.49 5.27 20.53 22.57 0.00 26.34 7.97 3.47 20.78 7.33
Relative to full 31.81±4.5 40.09±5.1 68.83±10.3 66.52±1.3 153.00±24.1 45.50±11.1 62.69±6.4 60.38±3.8 59.85±9.1 41.67±4.5 10.34±0.8 9.25±2.4 75.90±9.2 35.23±4.3 2.97±0.8 69.21±4.6 27.14±4.0 7.73±1.7 103.06±3.7 17.00±1.3
Relative between fold 46.18±5.6 51.61±2.9 62.02±5.5 60.37±2.9 250.00±32.8 66.37±13.0 64.18±5.0 69.78±4.2 96.80±11.2 53.54±5.8 16.19±1.0 14.56±3.3 99.45±14.0 50.58±4.2 4.29±1.6 62.05±3.8 37.28±6.4 14.02±3.1 119.50±4.4 25.45±0.8
Distance to full 14.95±2.1 21.65±2.7 47.49±7.1 76.50±1.5 9.18±1.4 2.73±0.7 36.99±3.8 30.79±1.9 5.98±0.9 8.75±0.9 3.00±0.2 0.83±0.2 3.80±0.5 11.98±1.4 0.89±0.2 24.23±1.6 25.24±3.7 0.85±0.2 208.18±7.5 2.89±0.2
Distance between full 21.70±2.6 27.87±1.6 42.80±3.8 69.42±3.3 15.00±2.0 3.98±0.8 37.87±2.9 35.58±2.1 9.68±1.1 11.24±1.2 4.70±0.3 1.31±0.3 4.97±0.7 17.20±1.4 1.29±0.5 21.71±1.3 34.67±5.9 1.54±0.3 241.39±8.9 4.33±0.1
Table 2: Experimental results for J4.8 datasets from the University of California Irvine repository (Merz and Murphy, 1996). The datasets and their properties are listed in Table 1. To determine the effectiveness of the tree matching algorithm we compute a number of different measures during cross-validation. To compare the full tree (that is, the tree built from the full training dataset) to the trees produced during the folds we compute the distance EditDist(T1,T2) and the relative distance EditDistN(T1, T2 ) , where N is the size of the full tree (number of nodes and leaves). This number is expressed as a percentage. These values are averaged to yield the distance and relative distance from the full tree to each fold and the distance and relative distance between each pairwise combination of fold trees. We also compute the default accuracy (the number of values in the majority class in the dataset expressed as a percentage), and the average cross-validation error (this is the average percentage incorrectly classified) in
order to determine any link between average error and average edit distance. The results computing these measures for J4.8 (which is an implementation of C4.5 release 8 in Java (Witten and Frank, 1999)) together with standard deviations for the edit distance measures, in ten ten-fold stratified crossvalidation runs are presented in Table 2.1 Table 2 has a number of interesting features. As expected, there is a strong correlation between the average edit distance to the full tree (column 6) and the average edit distance between the folds (column 7). The correlation is also strong between the relative edit distances (columns 4 and 5). The edit distance metric is therefore stable in these two circumstances.
1
Note that it is possible to generate values greater than 100% when folds consistently produce larger trees than the full tree.
There is a fairly strong correlation (0.74) between the cross-validation error (column 3) and the relative edit distance to full (column 4). High error is likely in cases where there are either many non-pure leaves in the tree or many leaves which cover a very small number of instances. Both of these situations lead to structural instabilities when the distribution of instances changes during cross-validation. In general, models appear to vary with respect to the model obtained from the entire dataset in proportion to their estimated error during cross-validation. In addition, the absence of large differences between the full model and models derived during cross-validation indicates that a dataset contains sufficient data for learning the problem at hand (and the addition of further data will bring relatively small performance gains).
offset the structural instabilities encountered in some of the datasets, by avoiding edit operations on leaves with, for example, zero instances. Leaves such as these are quite common in large C4.5 trees.
The anneal dataset is an interesting counterexample. Here there is low error (1.28) but high relative edit distance (31.81). On closer examination we see that this dataset contains important nominal attributes with many values which, for multi-way splits, will result in highly differentiated trees. This phenomena also applies to breast-cancer, audiology, colic, and vowel}.
6. References
5. Conclusions
Aho, A. V., Ganapathi, M., and Tjiang, S.W.K. 1989. Code generation using tree matching and dynamic programming. ACM Trans. on Programming Languages and Systems, 11, (4), pp. 491-516.
We have presented a diagnostic tool for comparing two decision trees. The algorithm was readily adapted from work on approximate tree matching and has a time complexity that makes it eminently suitable for applications in machine learning and data mining. In practical experiments it was shown that there is a fairly strong correlation between the relative edit distance to the full tree and the cross-validation error except where highly relevant nominal attributes contain many values. At present, no attention is paid to the number of instances that fall to a leaf when comparisons are made. It may be possible to
It is important to maintain transparency in all aspects of the process of developing applications of machine learning and data mining. It is hoped that this tool will be of use to practitioners and researchers as they try to explain their results to users. The tree comparison tool could also be applied to uncover some of the mysteries behind the composite models produced during boosting (Freund and Schapire, 1996) and bagging (Breiman, 1996). This will be a topic for future research.
Aha, D.W., and Riddle, P. (Eds.) 1995. Workshop notes for applying machine learning in practice: A workshop at the Twelfth International Machine Learning Conference (Technical Report AIC-95-023). Washington, DC: Naval Research Laboratory, Navy Center for Applied Research in Artificial Intelligence.
Breiman, L. 1996. Bagging predictors. Machine Learning, 26, (2), pp. 123-140. Freund, Y., and Schapire, R.E. 1996. Experiments with a new boosting algorithm. In Machine Learning: Proc. Thirteenth International Conference. Morgan Kaufmann. Hoffman, C, and O'Donnell, J. 1982. Pattern matching in trees. JACM, 29, (1), pp. 68-95. Merz, C. J. and Murphy, P. M. 1996. UCI Repository of machine learning data-bases [http://www.ics.edu/\~mlearn/MLRepository.h tml]. Irvine Calif.: Univ. of Calif., Dept. of Information Science.
Provost F., Fawcett T., Kohavi, R. 1998. Building the Case Against Accuracy Estimation for Comparing Induction Algorithms. To appear in Machine Learning. Quinlan, J. R. 1993. C4.5: Programs for machine learning. Morgan Kaufmann. Shapiro, L.G., and Zhang, K. 1990. Comparing multiple RNA secondary structures using tree comparisons. Comput. Appl. Biosci., 6, (4), pp. 309-318. Tai, K.C. 1979. The tree-to-tree correction problem. JACM, 26, (3), pp. 422-433. Wang, J.T.L., Zhang, K., Jeong, K., and Shasha, D. 1994. A system for approximate tree matching, IEEE Trans. Knowledge and Data Engineering, 6, (4), pp. 559-571. Witten, I.H., and Frank, E. 1999. Data mining: Practical machine learning tools and techniques with Java implementations. Morgan Kaufmann. Zhang, K, and Shasha, D. 1989. Simple fast algorithms for the editing distance between trees and related problems. SIAM J. Computing, 18, (6), pp. 1245-1262.