Abstract. A dual sensor tomograph for three-component flow imaging has been built at the ..... water density, with an 8 Ã 8 reconstruction grid and 35 ms integration time. 2.3. .... the degree of control of the variables that affect the measurement.
Meas. Sci. Technol. 7 (1996) 297–307. Printed in the UK
A dual sensor flow imaging tomographic system G A Johansen, T Frøystein, B T Hjertaker† and Ø Olsen ´ University of Bergen, Department of Physics, Allegaten 55, N-5007 Bergen, Norway Received 11 July 1995, in final form 30 November 1995, accepted for publication 14 December 1995 Abstract. A dual sensor tomograph for three-component flow imaging has been built at the University of Bergen in cooperation with Christian Michelsen Research AS and Norsk Hydro AS. It utilizes an eight-electrode electrical capacitance tomograph and a γ -ray tomograph with five radiation sources and 85 compact detectors. Embedded transputers using memory-mapped I/O ensure high-speed data acquisition into an Alpha AXP-based on-line processing unit. The first results demonstrate that three-component flow regime identification is possible at rates of about 30 frames per second, provided that sufficient computing capability is available.
1. Introduction Tomographic imaging of multi-component pipe flows provides information that is beneficial in several contexts. One is multi-phase flow modelling, in which improved experimental verification is important. Better understanding of flow processes enables design of more efficient process plants and production lines, including flow instrumentation. The latter is another example in which tomography provides valuable reference data, especially in the design and test phases of flow rate and flow component meters. The need for accurate instrumentation is easily understood from the huge capital involved in fiscal metering within, for example, the oil industry [1]. Tomographic instruments are hence a powerful research tool in different laboratory facilities, but also beneficial in on-site metering systems. This is because many flow-velocity measurement principles can be used on one-component flows only, whereas others can be utilized on multi-component flows provided that there is information on how the components are mixed and how they flow in relation to each other. This is particularly important in process control systems, in which the amount and accuracy of feedback information are crucial for the stability of the control loops. The required output of a flow imaging system, like those of many other tomographic systems, could as a consequence be parameters describing the process rather than tomograms. Such parameters could typically be flow component fractions and codes classifying and describing the flow regime. The objective of this work is to develop a laboratory prototype for imaging three-component flows consisting of gas, oil and water. This should be performed with † Permanent affiliation: ABB Corporate Research Norway, Bergerveien 12, N-1361 Billingstad, Norway. c 1996 IOP Publishing Ltd 0957-0233/96/030297+11$19.50
sufficient spatial resolution to identify the flow regime at rates of at least ten frames per second. The fast response time requirement is a consequence of the flow velocity, which may be several metres per second. If the three components are flowing separately over the pipe cross section, like in stratified flow in long horizontal lines, then the normal approach would be to identify one component parameter that differs sufficiently to enable imaging by only one sensor principle. This, however, requires the conflicting combination of high measurement resolution and fast response. For many tomographic principles these parameters are closely related to each other in the sense that an improved accuracy implies longer measurement time and/or processing time, thereby slowing the response. In addition, it is very likely that at least two of the three flow components are fully or partially mixed, introducing more than three flow phases. A single sensor system will then not be capable of distinguishing the phases. 1.1. The dual sensor tomograph Multi-mode tomography can solve this problem. The simplest multi-mode systems use only one sensor principle which, depending on the actual principle, senses at multiple frequencies, energies and so on, provided that the different components respond differently [2, 3]. This is referred to as inherently multi-mode or multiple modality. The response, however, is reduced in cases in which the multiple sensing cannot be performed simultaneously. Another approach is to identify sensor principles which are sensitive to parameters that provide different flow component information. For three-component flow imaging, a dual sensor system will be sufficient. To allow simultaneous sensing, these sensors should preferably operate fully 297
G A Johansen et al Table 1. Density, ρ, relative permittivity, εr , and conductivity, σ , of flow components and phantoms. Element
ρ (g cm−3 )
Gas ≈0 Crude oil 0.83 Exxsol D100 oil 0.82 Tap water 1.0 Process water 1 Polypropylene 0.91
εr 1.0 2.20 2.08 80 70 3.4
σ (S m−1 ) 10−6 0.0027 5
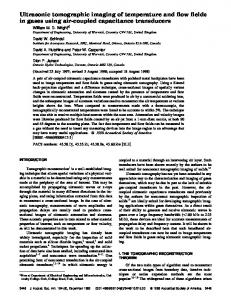
independently of each other over the same pipe cross section. This work describes a dual sensor system consisting of one γ -ray tomograph and one capacitance tomograph. The γ -ray tomograph discriminates between the gas and liquid phases, since these have different densities, or more correctly different photon attenuation coefficient functions [4]. (For flow components with low atomic numbers, the density distribution of a component is proportional to its linear attenuation coefficient distribution, provided that the γ -ray energy is in the range 50 keV to 3 MeV.) The density of a mixture of any components is linearly dependent on the densities and the volume fractions of the components. The capacitance tomograph is sensitive to the permittivity of the components and will in the dual mode system distinguish between oil and gas on the one hand and water on the other [1, 4]. There is a nonlinear relationship between the permittivity of a mixture and the permittivity and volume fractions of the components. This is illustrated in figure 1, in which the theoretical value of a mixture of process water dispersed in crude oil is plotted against water volume fraction. A summary of the parameter values of the different components is given in table 1. The preceding line of reasoning is not meant to indicate that the combination of capacitance and γ -ray technology is superior to all others for this application. The choice is also affected by the knowledge and background of the project participants. Preferably, two hard-field sensor systems should be used to obtain the best image quality. A hardfield system like the γ -ray tomograph is equally sensitive to the parameter it measures in all positions throughout the measurement volume. Its sensitivity is also independent of the distribution of the measured parameter inside and outside this measurement region. For soft-field sensors, like capacitance tomographs, the sensitivity to the measured parameter depends on the position in the measurement volume, as well as on the distribution of the parameter inside and outside this region. The result is blurred images in which contrasts are smeared out when conventional reconstruction methods are applied [7]. In a dual mode system, however, the different sensors often provide some complementary process information. The more accurate hard-field data can then also be used to enhance softfield data in an integrated reconstruction algorithm. The extracted information may in this way be more efficiently utilized to improve the overall image quality. The hardware of the dual sensor system is essentially designed as two separate sensor sub-systems to allow both single and dual mode operation of the tomographs. Hence, 298
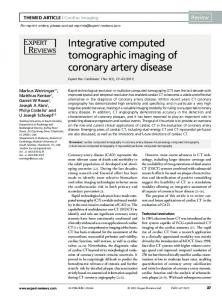
both tomographs have separate data acquisition controllers which may be connected either to one common, or to two separate, processing units. The dual mode sensor head is designed for perspex pipes with maximum 80 mm inner diameter. 2. The γ-ray tomograph 2.1. Accuracy versus safety Capacitance tomography is known as a safe and reliable technology. γ -ray tomography, however, has generally been considered to be hazardous, with the requirement of heavy shielding when measurement accuracy, speed of response and safety are to be maintained [1]. This is a consequence of the random fluctuation in the γ -ray photon emission which causes the ray-sum error to be inversely proportional to the square root of radiation intensity, namely the number of photons per second. This error is minimized by designing the system to obtain an average attenuation close to 86%. Also, the error is reduced by a factor of three for every order of magnitude increase in the number of incident photons [8]. For a given geometry, the latter equals the product of the incident intensity and the integration time. Keeping in mind that the absorbed dose rate to the surroundings is proportional to the intensity, that is, to the source activity, and that the system’s speed of response is inversely proportional to the integration time, provided that the reconstruction time is shorter, the resulting compromise between these three parameters is understandable. There is, however, room for improvement here, and the key is the radiation energy, namely the quantum energy of each γ -photon. The attenuation coefficient and thereby the penetration depth of each photon are determined by its energy, not by the radiation intensity. Traditionally the 137 Cs source with principal γ -ray emission at 661.6 keV is used in various densitometry applications within the process industry. This relatively high energy is necessary since it enables clamp-on metering of, for example, flows inside steel pipelines. In such systems, however, the major attenuation occurs in the pipe walls since these have substantially higher density than oil and gas, for example, resulting in poor contrast for the flowing media. Thus, by using low-density pipe materials at the measurement location, it is possible to apply radiation of lower energies such as that from 241 Am with principal γ -ray emission at 59.5 keV and to obtain better contrast. At this energy and with perspex pipe walls, the pipe diameter needed to obtain 86% average attenuation is about 100 mm. More importantly, the measurement accuracy is maintained while the radiated dose rate is reduced by four orders of magnitude even when the lead shielding thickness is reduced from 100 to 3 mm! This, which is evident from the theoretical prediction plotted in figure 2, emphasizes the strong dependence of safety on radiation energy. To get a better quantitative understanding of the term absorbed dose, it may be useful to know that the daily dose radiated from the human body is about 1 µSv and that two or three dental x-rays result in an effective dose of about 100 µSv [8, 4]. The dose from the γ -ray tomograph presented in this work is discussed in section 7.1.
A dual sensor flow imaging tomographic system
Figure 1. The theoretical relative permittivity of an oil-continuous homogeneous mixture of crude oil and process water, as a function of the water content at 100 kHz frequency. The calculation is based on a corrected version of the Ramu and Rao formula [5, 6] and the values given in table 1.
There is another advantage of reducing the radiation energy since the reduced radiation penetration depth also enables the use of smaller and more compact detectors. This is important in γ -ray tomography because the detectors need to be tightly stacked in arrays [9]. For this reason CdZnTe semiconductor detector technology, which also has undergone substantial improvements in recent years, was used in this project [10, 11]. Finally, it is worthwhile noting that the reduced risk involved with the 241 Am isotope in comparison to that with 137 Cs, for example, may simplify the process of approval in various industrial applications. 2.2. Geometry and design Medical CT scanners utilize a rotating x-ray source and circular detector arrays. This concept has also been suggested for flow imaging purposes [12, 13]; however, here a system involving a rotating radiation source is far from ideal because of the flow dynamics. In order to avoid making inconsistent density measurements, all the measurements should be carried out simultaneously. This also improves the measurement accuracy at a given speed of response. For these reasons it was decided to utilize a system incorporating several fixed γ -ray sources, each of which faces an array of detectors on the opposite side of the pipe cross section. The number of so-called views in such a system hence equals the number of sources and the number of ray-sums in each view equals the number of detectors in each array. It has been shown that a circular object can be reconstructed exactly on an n × n grid, when 2π n equispaced views, each consisting of 2n + 1 error-free raysums, are available [14]. In addition the reconstruction grid has to be sufficiently fine to represent the true features of the object accurately. This is a rather disconcerting requirement for a multi-source system since even an 8 × 8 grid requires 50 sources and at least 850 detectors in total. However, CT theory also predicts that objects exhibiting some symmetry and homogeneity properties can be reconstructed successfully from very few views [14]. To investigate the influence of the number of views on the reconstruction precision, considerable effort was put
Figure 2. The estimated absorbed dose rate at 1 m distance as a function of lead shielding thickness for four commonly used γ -ray point sources with 3700 MBq (100 mCi) activity. This calculation is based on spherical (point source) geometry. The radiated dose rate is therefore inversely proportional to the square root of the distance to the source and proportional to the intensity and exposure time [8].
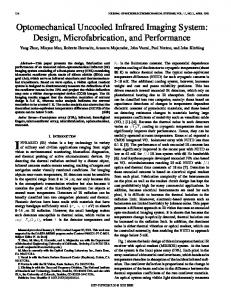
into system modelling and the development of a simulator. This was used to determine the most desirable system configuration with different flow regimes as input [15, 16]. The result, which is a compromise between complexity (cost) and performance, shows that a system consisting of five views each with 17 ray-sums enables flow regime identification in an 80 mm inner diameter perspex pipe [15]. Based on this work a γ -ray tomograph prototype with five 500 mCi 241 Am γ -ray sources and five detector arrays, each with 17 CdZnTe detectors, was designed. The geometry of the so-called sensor head is shown in figure 3. A collimator system consisting of several lead blades is installed in front of each detector array to stop scattered radiation, thereby reducing the measurement error and the maximum count-rate with which each detector has to cope. The area of each detector was chosen to be 10 mm × 10 mm as a compromise between spatial resolution, which is ultimately limited by the width of the detectors, and ray-sum error, which decreases with increasing detector area. Furthermore, 2 mm detector thickness was chosen to provide close to 100% radiation stopping efficiency. The density resolution of each reconstruction pixel is determined by the statistical uncertainty of the ray-sum measurements, reconstruction errors and errors caused by ‘broad-beam’ effects and Compton scattering. The latter are minimized by the collimator system; however, compensation algorithms also can be used. The total error will normally be dominated by the statistical uncertainty and the reconstruction error. Based on this assumption the density resolution of each pixel in the described system is estimated to be roughly 8% of full scale, which is the water density, with an 8 × 8 reconstruction grid and 35 ms integration time. 2.3. Read-out electronics In each detector module the 17 CdZnTe detectors and charge-sensitive pre-amplifiers are stacked side by side in a linear array, see figure 4. The detectors are packed in silicon rubber to reduce microphonics, that is acoustic 299
G A Johansen et al
Figure 3. A cross sectional view of the γ -ray tomograph with five pairs of radiation sources and detector arrays (A, B, C, D and E). For dual mode operation, the capacitance tomograph sensor head is attached in the centre hole as shown in figure 8 later.
Figure 4. One of the five detector modules with the front plate removed. The detectors are packed in silicone rubber to minimize microphonics. The detector modules are manufactured by eV Products, Saxonburg, USA.
noise. Since each detector, as defined by the system geometry and source activity, must be able to cope with count rates of 2.5 × 10⁵ counts (events) per second (C s−1 ), a filtering technique called delay-line shaping is used to reduce noise and obtain short output pulses with rapid base-line restoration [11]. This is crucial to enable highspeed counting. One of the 85 detector channels, all of which are identical, is shown in figure 5. The noise is about 10 keV FWHM when the time constants and delay in the circuit are adjusted to obtain a output pulse duration of 500 ns. The margin between the resulting 2 MC s−1 count-rate capability and the required one of 300
250 kC s−1 is necessary because of the random emission of the γ -ray photons. The output pulse of each delayline amplifier is fed through a discriminator, where it is converted into a digital pulse and counted if its amplitude exceeds a certain threshold. The outputs of all the 85 counters are sampled simultaneously at intervals which define the integration time. This interval and the 85 discriminator thresholds, which may be individually set, are programmably controlled through the data acquisition system by the data processing unit. This enables automatic calibration of the 85 detector channels and a flexible choice of integration time.
A dual sensor flow imaging tomographic system
Figure 5. An outline of the read-out electronics of the 85 γ -ray tomograph channels. The detectors (1) and pre-amplifiers (2) are located in the modules on the sensor head, whereas the signal conditioning (3), the discriminator (4) and the counter and the digital interface electronics (5) are located in a double-height 19 inch rack which also contains the data acquisition system.
Figure 6. The sensor head of the eight-electrode capacitance tomograph with the screen partially removed. This unit fits into the centre hole of the γ -ray tomograph, see figure 8 later.
3. The capacitance tomograph In capacitance tomography there is a trade-off between the electrode size and number, and the sensitivity and speed of response of the read-out electronics. This dual mode system utilizes eight 100 mm long electrodes each with 35◦ angular width. These are simply attached onto the pipe and covered by a metal screen (Faraday box) as illustrated in figure 6. 3.1. The read-out electronics There are several capacitance measurement principles that could be used for the sensor configuration described here. It is, however, also desirable with flexibility to reduce the electrode length and use driven guard electrodes on each longitudinal side of the measurement electrodes. The readout electronics then have to meet strict requirements on sensitivity, noise and speed of response. For this reason, eight circuits based on the phase-sensitive ‘ratio-armbridge’ principle are used for simultaneous measurements at all the detecting electrodes. The operational principle of each channel is shown in figure 7. The unknown
capacitance, Cx , between the actual electrode pair is excited by a sinusoidal voltage, Ee . The measured voltage, Ex , is balanced against an adjustable sinusoidal excitation voltage over a fixed reference capacitor, Cref . This voltage is a product of the output of a digital-to-analogue converter and a fixed reference sinusoidal voltage, Eref , generated by the signal generator, and is 180◦ out of phase with Ee . The signal generator also has a square wave output which is used by the phase detector (demodulator). The phase of this square wave is adjusted to compensate for signal propagation delay between the output of the sine wave generator and the input of the phase detector. The balancing is done by successive approximation logic controlled by an EPLD (erasable programmable logic device). The electrodes are configured for excitation or detection through a set of solid-state switches at the input of each electronics channel. The excitation sequence is conducted by the data acquisition controllers. The use of multiple solid-state switches and virtual earth input circuits enables stray-immune capacitance measurements. An analogue signal generator, also shown in figure 7, has to be used to obtain the desired noise performance. The standard deviation of the circuit is less than 100 aF when the 301
G A Johansen et al
Figure 7. The ratio-arm-bridge circuit used for all the eight electrodes. In this example one of the other electrodes is connected to the 100 kHz excitation voltage, Ee , from the common signal generator shown inside the broken rectangle. The whole system, including the data acquisition controller, is assembled in a 19 inch rack.
maximum measurement value is 2.5 pF; that is, the signalto-noise ratio is about 90 dB. The corresponding time required to perform the 28 capacitance measurements, which is the data set for one image, is 35 ms. This measurement time can be reduced by increasing the bandwidth of the bandpass filter, but at the expense of increased noise. There are several precautions that need to be taken to reduce noise, with respect both to the design and to the lay-out of the circuitry. To prevent the use of solid-state switches which generates additional noise, the low-noise input amplifier has to withstand the full excitation signal at the input when the electrode is configured for excitation. Furthermore, the EPLD clocking is synchronized with the phase detector to enable the latter to sample in ‘silent’ periods with no digital noise. 4. The data acquisition controllers The γ -ray and capacitance sensor systems each have their own dedicated transputer-based data acquisition controllers, as shown schematically in figure 9. Data are latched simultaneously at the sensor electronics outputs and transferred by memory mapping to the control unit’s built-in memory. In this way the data transfer rate is increased from about 2 MB s−1 when the transputer’s serial link is used, to about 33 MB s−1 [17]. Data are further transferred to the processing unit independently of the sensor electronics operation. This pipeline structure prevents dead-time which is undesirable in real-time imaging systems. The data acquisition controllers are designed to interface either to computers with conventional backplane buses through a standard parallel interface, or to a transputer network through the standardized Inmos serial link [17]. 5. Data processing and image reconstruction Computing requirements are closely related to the reconstruction algorithms utilized, as well as to how rapid measurement and reconstruction must take place. Initially, transputer technology was selected for this project to achieve a well-defined, reasonably priced and flexible interface to the sensor electronics with built-in links to a high-performance parallel data-processing system based 302
on IMS T9000 transputers. However, due to the long delay in the introduction of the T9000 transputers onto the commercial market, an Alpha AXP system will be used as data processing and reconstruction unit when real-time operation is required. The interface to the data acquisition controllers will then be through the parallel interface. The reconstruction algorithms are implemented on a DEC C++ compiler running under Windows NT. This will be a costeffective solution, though not with the same processing power as several T9000 transputers running in parallel. For these first experiments traditional image reconstruction algorithms are used. For the capacitance tomograph this means the LBP algorithm (linear back projection) [18] since the high-accuracy reconstruction algorithms designed for hard-field sensor systems, such as medical x-ray CT, cannot be used. The applied algorithm incorporates a socalled sensitivity matrix which compensates for the inhomogeneous sensitivity over the image cross section [7]. For the γ -ray tomograph the ILST algorithm (iterative least squares technique) is used; several other fast and accurate algorithm alternatives are available [14]. The ILST algorithm produces images without making any assumption about the density distribution inside the pipe, thus providing a fast and general means of reconstruction. 6. Testing and characterization of tomography systems It is worthwhile noting that the transition between what tomography systems recognize as phases on the one hand and as separated components on the other is determined by the spatial resolution of the systems. Gas bubbles with physical dimensions less than the spatial resolution will, as an example, not be identified as gas bubbles, but as a mixture of gas and the surrounding medium. In other words it will be interpreted as a phase. Moreover, for dual sensor systems it is seldom correct to refer to one single spatial resolution since the characteristics of each system define two different resolutions. These characteristics are primarily the system geometry and the number of independent measurements. Equally important to the spatial resolution is the resolution of the parameter being imaged, which in the case of a γ -ray tomograph is the
A dual sensor flow imaging tomographic system
Figure 8. The sensor head of the dual mode tomograph mounted on a support bracket for operation on horizontal flow.
density resolution of each pixel. The parameter and spatial resolutions, which loosely are referred to as the image quality, are, however, closely linked since the parameter resolution is determined by a combination of reconstruction errors and measurement errors. The quality of any test and characterization procedure for measurement systems is ultimately dependent on the degree of control of the variables that affect the measurement. The most accurate test procedure applicable to the flow imaging system described in this work is the use of phantoms, the permittivities and densities of which are accurately known and as close as possible to the real values listed in table 1. This allows quantification of both spatial and parameter resolutions and predicts the real-time performance of the system when the data acquisition and reconstruction times also are taken into account. 7. The first experimental results 7.1. The γ-ray tomograph The first experiments with the γ -ray tomograph were carried out with polypropylene phantoms simulating various gas/oil flows. The reconstructions in figure 10, which show slug ‘flow’ with two gas bubbles, clearly indicate that there is only a marginal difference in the image quality when the
integration time, τ , is reduced from 1000 to 40 ms. This means that the liquid and gas phases can be accurately identified in flow regimes at rates of at least 25 frames per second. The reconstruction time for a 32 × 32 pixel image is about 160 ms on a HP9000/720 work station, however, faster computers are available and the speed of the reconstruction algorithm may be increased. The frame rate is hence limited by the integration time rather than by the reconstruction time. The results presented in figure 11 demonstrate the γ -ray tomograph’s ability to resolve three non-mixed components. Note that there is still room for improvements in all these results because no correction is made for scattered radiation. Concerning safety, the radiation from the five 241 Am γ -ray sources in the tomograph is confined to the volume inside the two 13 mm thick stainless steel plates. The dose rate to the surroundings is less than 0.1 µSv h−1 at 1 m distance. This is far below the recommended maximum value of 7.5 µSv h−1 at 1 m distance [19] and the dose rate from natural background radiation [8, 4]. 7.2. The capacitance tomograph The first experiments with the capacitance tomograph were carried out on a 45 mm diameter three-phase flow rig at Norsk Hydro Research Centre Porsgrunn [4, 20]. 303
G A Johansen et al
Figure 9. Outline of the transputer-based data acquisition controller. The only hardware difference between the capacitance and γ -ray tomograph versions is the interface units to the sensor electronics shown in figures 5 and 7. The interface to the processing unit can be either a parallel port (DEC DRV 11J) or a serial (Inmos) link. The two optional links enable a master–slave configuration of several controllers and programming of the control unit when it is not booted from the EPROM and operated as a stand-alone system.
Figure 10. Results of polypropylene/air imaging with the γ -ray tomograph at two integration times, τ . Seven iterations and a reconstruction grid of 32 × 32 pixels were used. No compensation was made for scattered radiation.
Known quantities of water were mixed with the crude oil at several flow rates. It quickly became evident that, when the electrodes were mounted on a hydrophilic pipe material, such as glass (borosilicate 33), then moisture clinging to the interior surface of the pipe wall partly short-circuited the electrical field, even at very small water fractions. However, when the electrodes were mounted on a hydrophobic material, such as PVC, the water fraction could be increased to about 20% before any short-circuiting problems arose. The conclusion is, as expected, that this measurement principle requires the water to be fully dispersed in the oil, avoiding continuous water paths between electrodes. 7.3. The data acquisition controllers The performance of the data acquisition system was verified in the capacitance tomograph experiments described in the previous section. Here a 60 MHz Pentium PC with PCI local bus graphics card was used as processing unit. The time required to perform the LBP reconstruction and to display one 256 pixel image is 220 ms. This corresponds to an image rate close to five frames per second. Data could, however, be stored in real time at a rate of 28 frames per second, showing that the ultimate image rate is confined by the sensor’s data acquisition time. The same is true for the γ -ray tomograph which uses an identical data acquisition controller. A real-time imaging system with dual mode 304
reconstruction is now being implemented on an Alpha AXP system with native 32-bit software. 7.4. The dual sensor tomograph It is difficult to find static flow phantoms with the correct combination of permittivity and density to represent the possible phases (for example water dispersed in oil). For this reason the first experiments with the dual mode system were performed with a phantom which does not represent any realistic flow regime, but which reveals some of the system’s performance. The geometry of the water/polypropylene/air phantom and the results are shown in figure 12. Note that the full scale calibrations of both tomographs were carried out with polypropylene. In a realistic case in which the water component is dispersed in oil, the full scale calibration for the capacitance tomograph would be about εr = 15, as can be seen from figure 1. This would improve the contrast between the water component and the other components. The easiest way of producing a dual mode tomogram is to combine the two single mode tomograms through image processing. The image quality is then directly determined by the quality of the two single mode images. If this is done to the single mode tomograms in figure 12, it is, as expected, obviously the capacitance tomogram that limits the total image quality. This is even more apparent when quantitative information is to be extracted [7]. However,
A dual sensor flow imaging tomographic system
Figure 11. Results of air/oil/water imaging with the γ -ray tomograph at two integration times, τ . Five iterations and a reconstruction grid of 16 × 16 pixels were used. No compensation for scattered radiation was made.
Figure 12. Results of air/polypropylene/water imaging with the dual sensor tomograph. Both reconstructions use 256 pixel grids. Five iterations and 1 s integration time were used for the γ -ray tomograph. No compensation for scattered radiation was made. The diameter of the water and air holes is 27 mm.
dependent on the full scale calibration, the capacitance tomogram may contain some information about the air component. Similarly, the γ -ray tomograph could indicate the water component. This is evident from the preliminary results of air/oil/water imaging shown in figure 11. This demonstrates that dual mode image reconstruction needs to be far more sophisticated than pure image processing in order to utilize the available data fully. 7.5. Discussion The major complaints against the technology used in this dual sensor system are speed of response and safety for the γ -ray tomograph and sensitivity to water and image quality for the capacitance tomograph. The first results show that a γ -ray tomograph can be made safe and that its speed of response satisfies the requirements defined by flow imaging. The prototype will undergo further tests and attempts will be made to improve the image quality by incorporating compensation algorithms for scattered radiation. The
influence of scattered radiation can be determined by system modelling or by systematic calibration measurements with only one radiation source present at a time. It is clear that the capacitance tomograph requires hydrophobic wall material inside the pipe at the measurement location to help prevent the electrical field being short-circuited by water films. For industrial applications this is of particular importance since it has now become economically feasible to produce crude oil from old North Sea wells where the water content is 80% and higher. Theoretically the capacitance sensors stop working when the oil/water mixture becomes continuous water and the measurement frequency is less than the critical frequency [21]. This is approximately 1.2 GHz for North Sea process water, namely far above the frequency used in this system. This is now being investigated experimentally. Short-circuiting of the field between a few electrodes does not imply that capacitance tomography is useless. Data from all affected electrodes can be ignored in the back projection, but can be used to indicate the presence of 305
G A Johansen et al
a continuous water phase between those electrodes. This is of particular relevance in the dual sensor system where water as a continuous phase affecting several electrodes will probably be identified by the γ -ray tomograph as well. This and that the two systems often provide complementary information demonstrate the need for an integrated and adaptive reconstruction algorithm if the available information from the two systems is to be utilized fully. Such an algorithm can also incorporate the proposed scheme of flexible field excitation in capacitance tomography [22]. Here the electrical field is shaped by variable excitation of several electrodes simultaneously. This may be repeated several times so the final image is a result of several measurements. An adaptive algorithm may also include model-based reconstruction with flexible parametrization of the flow [7, 23]. These improvements in reconstruction technology will of course have impacts on the hardware requirements. Higher processing power is one obvious consequence, but this seems to be within reach thanks to the rapid development within conventional, large-volume computer technology. Improved sensor control is another important issue which arises within capacitance tomography. This means that system operation parameters such as excitation configuration and voltages should be programmable from the processing unit [22]. Another improvement is to increase the number of electrodes to obtain a higher degree of flexibility when measurements are skipped due to continuous water phases. This, which also improves the spatial resolution slightly, is particularly important when field shaping by flexible excitation is to be implemented. Altogether this requires sensor electronics with improved speed of response and preferably also better sensitivity to allow smaller electrodes. Recent studies on VLSI implementation of capacitance sensor electronics showed that this is feasible by using the Delta-Sigma modulator principle [24]. This also allows the measurement time, and thereby the noise level, to be chosen dynamically. VLSI technology also has the advantages of better stability and less power consumption, which is important for applications in explosive zones. It is also less space-consuming. That is particularly interesting for the γ -ray tomograph because a double-height 19 inch electronics rack and power supplies could be replaced with integrated electronics on the sensor head. The characterization of the dual sensor system reported here will continue with focus on the relationship between hardware noise and image quality for different reconstruction methods. Further development will be concentrated on integrated image reconstruction for dual sensor operation and on developing a system model for the γ -ray tomograph. Alternative principles for capacitance tomography will also be considered to make measurements on flows with water continuous phases possible. 8. Conclusion The first results from the dual sensor tomograph show that the sensor system enables three-component flow regime identification at rates of about 30 frames per second. This 306
required processing power, which is roughly 30 Mflops for conventional reconstruction algorithms, is available through conventional RISC-based computer technology. The first results also demonstrate that integrated reconstruction of data from the capacitance and γ -ray tomographs is required for optimal image quality. This is because the two systems also provide complementary flow information which will be sub-optimally utilized in a merged image generated by single mode reconstructions and image processing. This integrated algorithm should be adaptive; that is, it should allow the actual measurement conditions to determine the reconstruction method. For example, parts of the electrical field generated by the capacitance system may be shortcircuited by a continuous water phase and therefore require special reconstruction. Acknowledgments This project was funded by the Research Council of Norway, Norsk Hydro AS and the University of Bergen. The authors appreciate the good cooperation with W Q Yang at UMIST, UK, K Parnham and B Glick at eV Products, USA and R B Sch¨uller and A Valle at the Norsk Hydro Research Centre in Porsgrunn. We would also give special thanks to our colleagues at Christian Michelsen Research and the University of Bergen, especially the engineers. References [1] Plaskowski A, Beck M S, Thorn R and Dyakowski T 1995 Imaging Industrial Flows – Applications of Electrical Process Tomography (Bristol: IOP) [2] Abouelwafa M S A and Kendall E J M 1980 The measurement of component ratios in multiphase systems using γ -ray attenuation J. Phys. E: Sci. Instrum. 13 341–5 [3] Etuke E O, Waterfall R C, Dickin F and Beck M S 1995 Applications of multi-frequency excitation for electrical impedance Proc. ECAPT ’95 (Manchester: UMIST) pp 241–6 [4] Johansen G A, Frøystein T, Hjertaker B T, Isaksen Ø, ˚ Olsen Ø, Strandos S K, Skoglund T O, Abro E and Hammer E A 1995 The development of a dual mode tomograph for three-component flow imaging Chem. Eng. J. 56 175–82 [5] Hammer E A 1983 Three-component flow measurement in oil/gas/water mixtures using capacitance transducers, CMI Report 831251-2 (open) PhD Thesis University of Manchester, Institute of Science and Technology [6] Ramu T S and Rao Y N 1973 On the evaluation of conductivity of mixtures of liquid dielectrics IEEE Trans. Electr. Insul. 8 [7] Isaksen Ø and Nordtvedt J E A 1993 New reconstruction algorithm for process tomography Meas. Sci. Technol. 4 1464–75 [8] Johansen G A 1994 Safety considerations for gamma-ray densitometry and tomography Rev. Proc. ECAPT ’94 (Manchester: UMIST) pp 107–13 [9] Johansen G A and Frøystein T 1994 Gamma detectors for tomographic flow imaging Flow Meas. Instrum. 5 15–21 ˚ [10] Abro E and Johansen G A 1996 Low noise gamma-ray and x-ray detectors based on CdTe-based materials Nucl. Instrum. Methods A at press
A dual sensor flow imaging tomographic system ˚ [11] Johansen G A and Abro E 1995 A new CdZnTe detector system for low energy gamma-ray measurement Digest of Technical Papers, Transducers ’95, Eurosensors IX, Stockholm, June 26–9 vol 2, pp 156–9; 1996 Sensors Actuators A to be published [12] Schlosser P A, De Vouno A C, Kulacki F A and Munschi P 1980 Analysis of high-speed CT scanners for non-medical applications IEEE Trans. Nucl. Sci. 27 788–94 [13] De Vouno A C, Schlosser P A, Kulacki F A and Munschi P 1980 Design of an isotopic CT scanner for two phase flow measurements IEEE Trans. Nucl. Sci. 27 814–20 [14] Natterer F 1986 The Mathematics of Computerized Tomography (New York: Wiley) [15] Frøystein T 1992 Gamma-ray flow imaging MSc Thesis Department of Physics, University of Bergen [16] Frøystein T 1993 Gamma-ray flow imaging Proc. ECAPT ’93 (Manchester: UMIST) pp 213–16 [17] Hjertaker B T 1994 A transputer-based data acquisition controller for a dual mode process tomograph Rev. Proc. ECAPT ’94 (Manchester: UMIST) pp 318–25 [18] Xie C G, Huang S M, Hoyle B S, Thorn R, Lenn C and Beck M S 1992 Electrical capacitance tomography for flow imaging – system model for development of reconstruction algorithms and design of primary sensors
IEE Proc. G 139 89–98 [19] The Radiation Protection Institutes in Denmark, Finland, Iceland, Norway and Sweden 1992 Nordic Recommendations on Radiation Protection for Radionuclide Gauges for Permanent Installation [20] Johansen G A, Frøystein T, Hjertaker B T, Olsen Ø, Isaksen Ø, Hammer E A and Valle A 1995 Three-component flow visualization by dual mode tomography Rev. Proc. 3rd Int. Symp. on Fluid Flow Measurement, San Antonio, Texas, March 19–22 (Gas Research Institute) [21] Hammer E A, Tollefsen J and Olsvik K 1989 Capacitance transducers for non-intrusive measurement of water in crude oil Flow Meas. Instrum. 1 [22] Yang W Q 1995 A flexible electric field excitation and measurement technique for electrical capacitance tomographic systems, UK patent pending [23] Isaksen Ø 1994 A novel approach to reconstruction of process tomography data Doctoral Thesis Department of Physics, University of Bergen [24] Ullaland K 1994 The design of a VLSI mixed analogue and digital modular processor for capacitance tomography Doctoral Thesis Department of Physics, University of Bergen
307