USING SIMULATION SOFTWARE CALIBRATION TESTS AS A CONSUMER. GUIDE â A .... used for assessing lighting computer programs in artificial ..... Once a lighting simulation is certified as being accurate ... Architectural Science Review.
Proceedings: Building Simulation 2007
USING SIMULATION SOFTWARE CALIBRATION TESTS AS A CONSUMER GUIDE – A FEASIBILITY STUDY USING LIGHTING SIMULATION SOFTWARE Michael Donn1, Dan Xu1, David Harrison1, Fawaz Maamari2 1
2
School of Architecture, Victoria University of Wellington, Wellington, NZ Dr Fawaz Maamari, Soft Energy Consultants, 4 Place Jean Chorel, 69100 Villeurbanne, FR There are two goals for lighting simulation:
ABSTRACT This project investigated the feasibility of using existing software test cases to provide reliability scores for lighting simulation software. Estimation of lighting levels is a key element in commercial building design. And, many lighting programs claim to render light accurately. However, there is little published information on their accuracy. In thermal simulation, the IEA BESTEST (Judkoff et al), recently adopted by ASHRAE as Standard 140 (ASHRAE 140), certifies the acceptability of a thermal simulation code. (e.g. NZS4218) The CIE Technical Committee TC 3.33 (CIE) developed BESTEST-like tests for light simulation. This current project concluded that a ‘consumer guide’ must be broader than just these tests. There are four major areas of interest: more qualitative realistic visualization; more quantitative – the TC3.33 tests; more efficient; and easier to use. The delivered product is a proposal for a Web 2.0 (O’Reilly, 2005) delivery mechanism for building a ‘consumer guide’ to light simulation software.
KEYWORDS Daylight Simulation, BESTEST, TC 3.33, CIE, Light simulation, Quality Assurance
INTRODUCTION This project examines how standardized accuracy tests such as the CIE Technical Committee TC 3.33 (CIE) suite of lighting simulation program tests might form the basis of a ‘consumer guide’ to light simulation software. This is a pre-cursor to development of guides to other simulation programs.
To produce a photorealistic representation of the design.
•
To produce an accurate photometric model of the design.
visual
If the second model is done well, it is assumed to imply the first – photometric accuracy should ensure photorealism. The photorealistic model dominates much of the architectural graphics world where the goals are to create ‘good’ computer pictures. As the practice of architecture and lighting design has become increasingly computerised, there seems to be a lack of information about the usability and reliability of recently developed lighting programs. At the same time more and more lighting programs (e.g. MentalRay, Brazil, VRay) claim to render accurately the physical properties of light. Not only better images but also quantitative data for designers to meet particular design goals (lux levels, glare etc). However there is little currently published or accessible information on how well existing computer packages function. This lack of information can lead to potential users not having information to choose a proper tool for their needs. The CIE (Commission Internationale De L’Éclairage) established Technical Committee TC 3.33 to investigate and report on the accuracy of computer programs used in the estimation of lighting levels for the interior spaces of buildings. The objective of this committee is to offer a set of reference test cases against which users can assess the accuracy of a lighting program. The test cases address different aspects of lighting propagation:
The goal was to develop a guide that ensured that lighting analysts select the right tool. It was to go beyond the simple matrix of tool capabilities of most software reviews to a score or scores based on the tool capabilities as revealed by these tests. Lighting design can reveal or disguise the form and magic of the completed building. Predicting the outcomes of lighting design, simulating light, allows architects or lighting designers possibly to achieve better design and probably to avoid mistakes.
•
•
light source description (luminaire or daylight) and direct lighting calculations;
•
light transfer through openings and window components or around obstructions;
•
Inter-reflections between different types of materials with different photometric properties.
The description of these test cases (Maamari et al, 2006) includes the geometry, the light source, and a set of values to be used as a reference to assess the accuracy of a lighting simulation. These reference
- 1999 -
Proceedings: Building Simulation 2007
values have been obtained by simple theoretical calculation for analytical scenarios or by measurement in the experimental cases. The test cases provide a comparison between the lighting program outcomes and the corresponding reference values, providing a clear idea where the program respects physical laws and where it doesn’t.
3DS Max 7.0 is used to quickly create professional quality 3D models, photorealistic images and film quality animations. The program supports a radiosity renderer related to Lightscape, as well as a standard ray-tracing algorithm and the mental ray renderer. In this research, the radiosity renderer was evaluated as it allowed physically based photometric analysis.
To this extent, these tests are the lighting equivalent of the IEA BESTEST (Judkoff et al) / ASHRAE 140 (ASHRAE 140) suite of tests for Thermal Simulation software. In time, the TC 3.33 suite of tests may well be used by writers of codes and standards in a similar manner to the BESTEST suite: if thermal simulation software passes the BESTEST process then it is deemed to provide an acceptable standard of prediction for code purposes. The New Zealand standard (NZS 4218) on the thermal insulation of houses has quoted the BESTEST (and now ASHRAE 140) since 1996. Typically, at present the BESTEST suite is used by code developers for quality testing of their simulation code.
Rayfront is a platform independent toolkit that provides a graphical user interface to the lighting simulation software Radiance. Radiance is an industry standard physically based, backwards ray tracing render engine.
Using the TC 3.33 suite on individual software programs could also enable users to verify if a particular program is compatible with their needs. This is part of their stated purpose (Maamari, et al, 2005). With more widespread publication of the results of the application of these tests to several lighting programs, this suite also allows comparisons between different programs as would be sought in a ‘consumer’ guide to light simulation software.
THE TEST CASES
BACKGROUND Ideally a consumer test system would be able to provide some direct quantitative evidence about the accuracy of various lighting computer packages predicting illuminance/luminance levels. However, there are many problems to overcome if we aim to estimate the lighting properties inside a building space. These problems mainly relate to the photometric properties of the light sources and the objects in the scene. The TC 3.33 suite systematically examines a package’s photometric accuracy.
Lumen Designer was developed specifically with ease of use by lighting designers. There are two rendering options in the software: In this project, the photometric analysis was based on its radiosity solution. Lightscape was developed in the early to mid 1990’s as a hybrid radiosity plus ray-tracing renderer, specifically for architectural applications.
In the BESTEST methodology, there are three types of test: analytical tests, empirical tests and comparative tests. The CIE TC3.33 test cases are in two sets: an analytical set; and an empirical set. Analytical Test Cases The analytical TC 3.33. test cases are theoretical situations able to be subject to a simple ‘mathematical’ solution. They assume physically extreme photometric situations to allow simple formulae to be used to reach an ‘analytical’ solution of the Global Illumination (GI) calculation. The analytical suite comprises tests of: •
Sky Component (SC) of the illumination from an IES sky under a roof glazed opening with uniform sky luminance
•
Sky Component and Externally Reflected Component (ERC) (off the ground) for a facade unglazed opening with sky luminance
•
SC+ERC for a facade glazed opening with sky luminance
•
SC+ERC for a facade unglazed opening with a continuous external horizontal mask with sky luminance
•
SC+ERC for a facade unglazed opening with a continuous external vertical mask with sky luminance
Tested software
•
Simulation of point light sources
In this project, a number of packages commonly used by architects and lighting designers were tested and formed the content of the consumer test system.
•
Simulation of area light sources
OVERVIEW OF LIGHTING SOFTWARE Despite the large number of lighting programs claiming to model light with “Physically accurate full global illumination solutions” (VRay), only a small number of global illumination algorithms are typically used. These approaches include Ray Tracing, Radiosity and Photon Tracking techniques. All necessarily make approximations to physical reality because of the complexity of light distribution in a space.
- 2000 -
Proceedings: Building Simulation 2007
o
Luminous flux conservation transmittance of clear glass
•
Direct
•
Light reflection over diffuse surfaces
Luminaire Positions
•
Diffuse reflection with internal obstructions
•
Internal reflected component calculation of diffuse surface
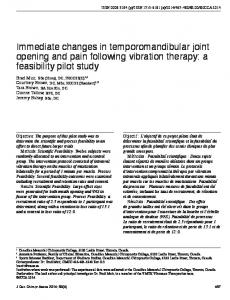
Four luminaires are positioned in a regular 2 x 2 grid with a spacing of 3.39 m in the X-direction and 3.36 m in the Y-direction.
•
Component for a roof unglazed opening and the CIE general Sky types
The floor is dark brown 0.06+/-0.01 The walls are matt grey 0.41+/-0.02
- Luminaire 1 was positioned at the top left with respect to Figure 2 (X=1.695m, Y=1.680m) - Luminaire 2 at the bottom left (X=1.695m, Y=5.040m)
Most lighting programs simulate artificial lighting luminaires by using a photometric file representing the intensity distribution of this luminaire. At a minimum, the software should handle North American IESNA and the European Elumdat photometric intensity distribution files.
- Luminaire 3 at the top right (X=5.085m, Y=1.680m) - Luminaire 4 at the bottom right (X=5.085m, Y=5.040m)
A simplified standard photometric distribution for a luminaire is provided for use in the TC 3.33 process.
The height of the luminaires is at 3.14m
Luminaire photometry
All luminaire C0 axes are parallel with the Y axis and point towards the wall nearest to luminaires 2 and 4 (Y=6.72m)
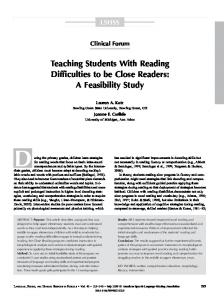
For the point light source test case the light source has a Lambertian (even in all directions) intensity distribution and an output flux of 3142 lm Luminaire Position The point light source is positioned 3m above the centre of the horizontal surface.
Luminaire photometry The luminaires used in this test are compact fluorescent lamps (Bare 32W Philips PL-T/ 840/ 4P lamps) with Huco 32W TC-T electronic ballasts. The total lumen output from each luminaire:
Measurement points
- Luminaire 1: 2182 lm
The direct illuminance at the measurement points A to J of the horizontal surface (as shown in Figure 1) is calculated and presented in tabular form in the TC 3.33 report.
- Luminaire 2: 2196 lm - Luminaire 3: 2203 lm - Luminaire 4: 2182 lm
Empirical Test Case
Measurement points
Test case 1-A: Gray wall – CFL lamp
The measurement points are defined at a regular 7 x 7 grid with half spacing at the edges (see Figure 2). The measurement plane is at 0.80m above the floor level.
This test case is based on the CIBSE TM 28/00 report, which describes the experimental protocol that has been used in a measurement campaign under artificial lighting scenarios. The report includes the results of this campaign as a benchmark data to be used for assessing lighting computer programs in artificial lighting predictions. Geometry Description The test room measures 6.78 m in the X-direction and 6.72 m in the Y-direction as shown in Figure 2. The ceiling height is 3.24 m. Materials photometry No Bi-directional Reflection Distribution Function (BRDF) measurements are available for different surfaces. The ceiling is white acoustic tiles of reflectance 0.70+/-0.01
Prediction of errors The total error (total measurement error and total expectation of error) is estimated based on the different interfering errors. The estimated total measurements error is +/-6.7% for point illuminance and +/-3.8% for average illuminance. (See Table 2) The estimated total expectation error including the potential simulation errors is +/-10.5% for point illuminance and +/-6.3% for average illuminance. (Table 3) Room average illuminance For the room average illuminance at the measurement plane, the reference values are presented by means of upper and lower limits (measurement +/- 2x6.3%) defining a band of values including the total expectation errors.
- 2001 -
Proceedings: Building Simulation 2007
RATING SOFTWARE Articles comparing or describing the performance and features of individual software packages appear regularly in the lighting press, computer graphics publications and architectural journals. These seldom are able to rate the software quantitatively in the ways that the TC 3.33 tests do. No single reviewer can be sufficient an expert in the use of all at a level to run them ‘through their paces’. What use of the TC 3.33 suite offers is the potential to score software in a manner that is fair, independent and repeatable. EXISTING SOFTWARE REVIEWS If the TC 3.33 suite of tests is to form part of a consumer guide to light simulation software then it must supplement the type of information already provided in lighting design programs reviews. Precedents for this type of guide include: i) a study (Aizelwood 1998) from the IEA Task 21 validation program that investigated the accuracy of Radiance, Genelux and SuperLite;. ii) a comparative evaluation (Susun Ubbelohde & Christian Humann) investigating the performance of four different lighting software packages in terms of the time and difficulty of learning to use the software, the ease of building an input file, the run time and the accuracy of illumination predictions as well as rendered visualisation; iii) a comparative study (Geoffrey Roy 2000) of computer packages focusing on the accuracy and the user assessment of their usability. Data Presentation The first lesson from this review was that the data in each of the reviews of rendering software presented in the tables and figures is for a particular time. Given the rapid, often less than a year, cycle of versions (3DS Max 6, 7, and 8 in the timeframe of the TC3.33 working group – now version 9) the focus here was on a web-accessible and updateable database of test results. The goal was to make the software tests able to be routinely updated. As more data is gathered in such a database, a comparative rating of all programs and their versions can be constructed. This would allow the differences between program simulation results to be used as a scale of what is and is not a reasonable variance from the standard defined by the suite of tests. The comparative rating would allow consumers to choose the ‘best’ program for their needs as the one fitting within the band of ‘reasonable’ values documented in the database. A website also allows the possibility of independent submission of tests for different programs – not just the manufacturer/proponent. A wiki-based submission system, with ebay-style trust scores for the submitters, permits the development of a scoring system that is not dependent on the developers of the software for the score values, but is focused on the
needs of the user community. There are other advantages for a website such as ease of access to the data, links to other useful information, etc.
USABILITY TEST: PRINCIPLES The early intention of this project was merely to provide an interactive web site where the results of the implementation of the TC3.33 tests on a range of software could be compared. However, trial presentations of the technical information to industry groups (Xu, 2005) lead to the conclusion that the technical tests of specific properties of these programs is largely beyond the interest and expertise of most architects and lighting designers. The TC 3.33 data alone is at present too esoteric to assist them in choosing lighting software. Also, the distinction between ‘accuracy’ (close enough to the truth that a decision can be made) and ‘precision’ (to what number of decimal places the answer is reported) is a distinction that needs to be explained each time numerical test results are different than the test standard. The Illuminating Engineering Society of North America (IESNA) publishes an annual software survey in Lighting Design + Application, as an extensive matrix which categorises the features of each package, including price, addresses of vendors and computer hardware requirements. The IESNA work and the Ideal Rendering Package defined by Ashmore and Richens (2001) formed the basis for the following checklist of features / headings under which a software package should be rated. These headings reveal quickly the inadequacy of the TC 3.33 tests alone as a consumer guide. Modelling Modelling in the tool itself – For quick analysis of simple designs in-tool modelling ability is essential. Importing other geometry - It should be straightforward to import models from a wide range of CAD sources. Portability of model - Models should be easy to move about between computer programs. Materials Library available - Inclusion of a basic materials library would be useful to most users. Accurate material properties are often difficult to obtain. Provenance of material properties guaranteed – the software needs to be compatible with quality systems for the publication of material information. A quality system for distributing material information does not just publish reflectivities, transmissivities, BRDF’s and BTDF’s for a range of materials. It includes in the data file format itself a record of the authors of the material properties, the type(s) of test apparatus
- 2002 -
Proceedings: Building Simulation 2007
used, and the trustworthiness of their laboratory. With such meta-data appended – the provenance of the material information – the simulation software can produce reliability scores for its output. Customising in language that is normal in lighting – Material descriptions in the software should be simple to understand and enter into the software. Mapping scaling / uvw coordinates - Simple mapping techniques can be useful to users to define material properties. Exposure or brightness controls that assist users to scale the output so that it provides as genuine as possible an impression of how a space might appear are also essential. Luminaires Ease of use of all types of standard (IESNA / ELUMDAT etc) data - Photometric data is essentially numeric, but to be useful it should be available not just as numeric values, but a 3D array on a predefined grid of points, compacted into isoluminance contour maps. Sky models - A wide variety of sky conditions should be supported. (Mardaljevic, 2007; CIE 2003) More than the standard CIE or IES models of clear and overcast skies must be able to be included. A database of sky data for specific locations would be useful. The unobstructed sky luminance default should be a sensible value for the given time and location, not a generic single value. As new sky models become available these should be able to be accessed from simulation packages. An open system of incorporating sky models is as necessary as the ‘open system’ of accepting material data. As with material properties, the provenance of sky models is essential documentation. Simple interface for defining daylight - Any interface for setting the sky parameters needs to allow the user to simply define North, Altitude and Azimuth of sun: based on time / geography / solar colour / sky clarity Ease of placement / aiming - Luminaires should be easy to locate and aim on all surfaces. Different icons also can help users to identify different light sources. Additional lights should be easy to add and simple to scale and not require a deep knowledge of the Global Illumination (GI) algorithms being used. Simulation Setting up - Render settings should be easy to set up and there should be the minimum of controls. Those controls that are there should be easily understandable in terms that communicate the implications for render accuracy, not the details of the mathematics used to solve the GI problem. Cameras and viewpoints – these should be easy to set up. They should also be easy to save and to return
to. Once set up they should not change unless explicitly requested by the user. Creating the working plane - The ability to mark isocontours or luminance/illuminance on a working ‘plane’ is essential. Ideally, a single mouse click would create a grid of readings across any surface. Speed of calculation - The rendering should be sufficiently fast to permit interaction with the user. This will assist prevention of errors. Progressive algorithms with continual display are preferable as they allow the user to see trends in the results quickly and adjust to cope. Stability – It may not be possible to avoid the simulation crashing, but error messages that relate to the users’ understanding of the world not to the mathematics of the GI algorithms are essential. Output Display of illuminance / luminance – It is desirable to be able to measure the light levels at a point selected by mouse click on a surface in a resultant picture output – (keyboard co-ordinate entry extraction of this data is also useful). Maximum, minimum and average illuminances for a particular mouse click patch or for the working plane are also useful. Image display - The display of images on a screen, or printed on paper/film, requires a range of value judgements to set appropriate brightness levels and the dynamic ranges which can be represented on the particular display device. All too often with this type of value judgement based on the appearance of the image, the viewers desires, rather than an accurate model of reality influence the results. High Dynamic Range images based on the calculated light distribution in the space, which can be post analysed in terms of glare, human perception or interesting imagery may well be the solution to this representation issue. The results of the simulation should be available in a number of forms to allow them to be saved for later redisplay, as well as for importing into other analysis packages. Visual Scaling of glare / luminance - It would be particularly useful to the understanding of the real brightness of a scene if a control value, such as an accurate model of a computer monitor with reading task displayed on it with an accurately specified screen luminance was able to be placed in the scene. Accuracy CIE TC 3.33 analytical tests – these individually rate the software’s ability to model light. They are primitive abstractions of light flow designed to interrogate the software and reveal its fundamental light simulation properties, item by item. The suite of cases can be grouped into natural and artificial lighting functions; into indirect and direct light models; into reflection and distribution models.
- 2003 -
Proceedings: Building Simulation 2007
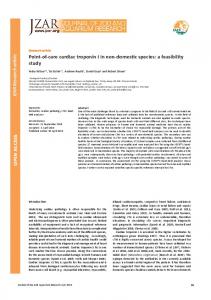
Reducing these to a single score – e.g. a weighted rating such as is often used in rating computers or in consumer software reviews – could be attempted, but would hide these individual scores. CIE TC 3.33 empirical tests – the measured data provides a single benchmark. It only measures the ability of the software to model a single artificially lit room. But it is at least that reality ‘touchstone’ – a first step towards empirically testing the software. Real cases – The TC 3.33 suite of tests is insufficient to provide essential information for the potential user on the ability of the software to handle non-trivial geometry, and to provide some real world scale in terms of render times. Annual simulation scripts – Software that only predicts the performance at certain specific times of the day and year is of little practical use. All light simulation software that works with daylight must have calculation systems for dealing with the stochastic nature of natural light. The key issue with the use of a suite of tests like the TC 3.33 tests is illustrated by presentation of the results of running 3DS Max, Rayfront and Lumen Designer (LD) through the TC3.33 tests (Figure 3): The LD output matches almost exactly the results of the TC 3.33 analytical solution for each point A through J in Figure 2. Initial impression: Perhaps this is an indication that the analytical solution is the basis of the LD simulation? The numbers for Rayfront and 3DS Max are far more of a concern. Rayfront numbers are almost exactly 20.5% less than each of the corresponding analytical figures – the standard deviation of the difference between these 10 numbers and their analytical equivalents is 0.05%. For 3DS Max the average difference is 15.5%, with a standard deviation of 22% - in other words a wide range from 43% less to 28% more than the analytical solution. The principal issue with this test, as it turns out to be with the whole suite of tests is separating the effect of the user from the accuracy of the software. The user in this case had two years experience simulating lighting performance with each of Rayfront and Lumen Designer. However, while he had over a year’s experience with rendering with 3DS Max, he had no prior experience of using this program to predict lighting intensity. Immediately these differences in the user’s experience with each package are noted, the results are interpreted differently. Initial impression: there appears to be a systematic problem with the computer rendering model in Rayfront causing the light distribution pattern to be exactly the same as the analytical solution, just 20.5% smaller. In light of the user’s experience this becomes possibly (probably?) a user error.
Initial impression: 3DS Max does not contain a light level reporting module. The reason the 3DS Max numbers are so wildly varying may be because ‘measuring’ light levels means taking ‘spot measurements’ on dummy surfaces in 2D renderings of spaces. This issue is not scrutinised because of the user’s relative lack of experience with 3DS Max. Tests of the type in the TC 3.33 suite, are very useful software development tools for ensuring that newer versions of rendering software still perform as the previous versions did. To use them for scoring the capability of software requires repetition of the tests by people other than the software developer. It requires a careful scoring not only of the software but of the experience and reliability of the scorer so that an aggregate and an average score weighted by experience and self interest can be developed.
AUTOMATE THE SCORING? Using the TC 3.33 suite to develop a database of software performance scores contributed to by a wide group of users via web services, makes it possible to automate the process of looking up these benchmarks. With the process automated, verification checkers could be added to render image viewers. However, to achieve this goal, the database requires more than one complete set of tests. The IEA Task 31 experience of an online uploading system for software test results is that very little uploading occurs if the uploading process requires reporting about the test. However, the ability to upload numbers from a spreadsheet in order to generate web reports automatically is increasingly possible with Web 2.0 (O’Reilly) applications. In addition, the provenance of the data must be documented and probably scored: who is the author of the tests; what is their relationship to the software developer; what are others’ reliability assessments of this person (this is equivalent in traditional publishing, to ranking reliability by Citation scores and relevant refereed publications). Finally, an aggregate score is needed for each piece of software from each of the scores submitted on a page like that in Figure 5. The percentage difference between the TC 3.33 standard number and the simulation result for each individual test is a starting point; then these can be combined into scores related to handling of daylight or artificial light. Then, each data point from each test contributor needs to be combined into a single aggregated score for each test where the contribution of the individual is weighted by the provenance ‘score’. A tool scoring system based on the approach outlined in this paper is being built onto the IEA Daylight Research Group wiki-based ‘Daylight Design Roadmap’. (IEA-SHC, 2006)
- 2004 -
Proceedings: Building Simulation 2007
CIE
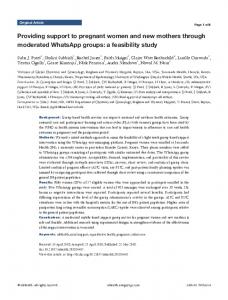
THE FUTURE? With a reliable and trusted tool scoring system based on the TC 3.33 suite available, the next step is for training institutes and for offices to use the suite to calibrate users. A test of the ability of the user to operate a simulation program adequately would be to have them complete the TC 3.33 suite. Automated uploading of the results at the end of this user calibration exercise begins the certification of the user’s trustworthiness and adds to the database. With a web server of this type, the next logical step would be to develop a means of assessing real simulations of buildings. In the background, software on the client and server would determine the best set of tests and comparisons to perform on the model. Simulations would be examined against indexed results assembled from previous users. End user ease of use is the overriding motivation. Completed simulations would be uploaded with a single click. An analysis of the lighting simulation model would be returned to the user. Software on the local client computer would present this data in the most comprehensible form for the user – probably bands of acceptability / trust (Figure 5). Three different sets of tests are required to evaluate and to certify lighting simulations. These three tests are illustrated in Figure 6. The first two reading from left to right are the TC 3.33 suite of tests. The third represents complex real-world applications. Once a lighting simulation is certified as being accurate the user would have the option of submitting the certified results into the system’s database. These results would act as a reference for further comparisons. Again, submissions would be graded on the credibility of the simulation’s creator. Experienced technicians would receive a higher credibility rating than the first time novice. This would minimize ambiguities and disruption within the system’s knowledge base.
“Spatial Distribution of Daylight - CIE Standard General Sky Joint ISO/CIE Standard” ISO 15469:2004 (E) / CIE S 011/E:2003 http://www.cie.co.at/publ/abst/s011.html (Last accessed March 2007)
Fontoynont M., Laforgue, P., Mitanchey, R., Aizlewood, M., Butt, J., Carroll, W., Hitchock, R., Erhorn, H., De Boer, J., DirksMöller, M., Michel, L., Paule, B., Scartezzini, J-L., Bodart, Mand Roy G.,1999, “Validation of daylightingcomputer programs”, IEA SHC Task 21/ ECBCS Annex 29, Nov. Geoffrey G. Roy, (2000) A Comparative Study of Lighting Simulation Packages Suitable for use in Architectural Design, School of Engineering, Murdoch University IEA-SHC http://www.iea-shc.org/task31 (Last accessed March 2007) or http://aecsimqa.net IESNA. 1997. “1997 IESNA Software Survey.”Lighting Design + Application, J A Clarke, P P Yaneske & A A Pinney BEPAC Research Report: The Harmonization of Thermal Properties of Building Materials. Maamari, Fawaz et al. Test Cases to Assess the Accuracy of Lighting Computer Programs Publication CIE 171:2006 ISBN 3 901 906 47 9 Mardaljevic, John. Thesis extract on sky models http://www.iesd.dmu.ac.uk/~jm/zxcvthesis/thesisD.pdf (Last accessed March 2007) Mental Ray Products information at http://www.mentalimages.com/2_1_0_mentalray /index.html (Last accessed March 2007) M. Susan Ubbelohde and Christian Humann, (1998) Comparative Evaluation of Four Daylighting Software Programs, University of California,Berkeley, CA
Ashdown, I. 1993. “Virtual Photometry.” Lighting Design +Application, 23 (12): 33-39.
Vray product information athttp://vrayinfo.vismasters.com/catalog/viewpro duct.aspx?product=1463 (Last accessed March 2007)
Ashdown, I. 1994 “Radiosity: A Programmer’s Perspective” John Wiley & Son.
Sullivan, A. C. 1996. “Photorealistic Light Simulation,” Architecture, 85 (10): 177-79
Ashdown, I. 1996. “Lighting for Architects.” Computer Graphics World, 19 (8):38-46.
Ubbelohde, M. S., J. Weidt, J. Johnson. 1989.Daylighting Software Evaluation Project Report.
REFERENCES
Ashmore J. and Richens P., 2001, “Computer Simulation in Daylight Design: A Comparison”, Architectural Science Review. Brazil renderer plugin for 3DS Max at http://www.splutterfish.com/sf/WebContent/B4 Max (Last accessed March 2007)
Ward Larson, G. and Shakespeare R. 1998,“Rendering with Radiance”, Morgan Kaufmann, San Francisco. Xu, Dan A study of developing a consumer test systemfor lighting programs; BBSC Honours
- 2005 -
Proceedings: Building Simulation 2007
research report Victoria University Wellington, 2005
Figure 4 Simulation Evaluation Integrated into Existing Software
Figure 1 Description of luminaires with intensity distribution files test measurement positions Source: (CIE TC 3.33 Technical Report 2005)
Figure 2 Empirical Test case 1 – A: Gray wall –CFL lamp
Figure 5 Simulation Evaluation Results within Application
Analytical 3DS Max Rayfront Lumen Designer
12
10
8
6
4
2
0 A
B
C
D
E
F
G
H
I
J
Figure 3 Intensity distribution files test result
Figure 6 Light Simulation Evaluation and Quality Assurance Tests
- 2006 -