Reliability of Wind Turbine Fluid Power Pitch Systems ... known to the authors is the Handbook of Reliabil- ..... Reliability based design of fluid power pitch.
Feasibility Study of a Simulation Driven Approach for Estimating Reliability of Wind Turbine Fluid Power Pitch Systems Jesper Liniger & Mohsen Soltani Department of Energy Technology Aalborg University, DK-6700 Esbjerg, Denmark.
Henrik C. Pedersen Department of Energy Technology Aalborg University, DK-9220 Aalborg East, Denmark.
Nariman Sepehri Department of Mechanical Engineering University of Manitoba, Winnipeg, MB R3T 5V6, Canada.
ABSTRACT: Recent field data indicates that pitch systems account for a substantial part of a wind turbines down time. Reducing downtime means increasing the total amount of energy produced during its lifetime. Both electrical and fluid power pitch systems are employed with a roughly 50/50 distribution. Fluid power pitch systems generally show higher reliability and have been favored on larger offshore wind turbines. Still general issues such as leakage, contamination and electrical faults make current systems work sub-optimal. Current field data for wind turbines present overall pitch system reliability and the reliability of component groups (valves, accumulators, pumps etc.). However, the failure modes of the components and more importantly the root causes are not evident. The root causes and failure mode probabilities are central for changing current pitch system designs and operational concepts to increase reliability. This paper presents a feasibility study of estimating pitch system reliability based on a failure rate prediction method for generic fluid power components. Special attention is given to the use of computer simulations for assessing working conditions such as flow, pressure, work cycle, fluid contamination concentration etc. The fluid power pitch system is co-simulated with the 5MW NREL wind turbine implemented in the FAST software. The estimated failure rates is compared to field data and comments are given to the correlation and discrepancies based on the uncertainties of the simulated conditions.
1
INTRODUCTION
Pitch systems are today employed on all modern multi-megawatt turbines and enable the turbine blades to rotate along their longitudinal axis in order to facilitate aerodynamic braking. This is used at wind speeds above rated and also for enabling safe emergency stopping of hub rotation. Multiple studies on turbine reliability and downtime have indicated the pitch system to be the most unreliable sub-system of the turbine (Wilkinson and Hendriks 2010, Carroll et al. 2015). Contributing to over 20% of total downtime, pitch systems not only introduce high risk, they also cause a significant loss of power production during the lifetime of turbines. Typically modern turbines use either electrical or fluid power pitch systems, where this paper focus on reliability estimation of the latter. Currently, the most
detailed publicly available field data on pitch system failures show the failure rate distribution among system components such as valves, pump, accumulators, cylinders, etc. (Carroll et al. 2015). Yet, the failure modes and root causes are not evident. Such information is crucial in order to identify critical areas of the system and to enable development of more reliable and safe concepts. Also, precise reliability estimates of system components allow for strategic maintenance planning which potentially reduces maintenance time and costs. In an attempt to reveal the highrisk areas of the pitch system, Liniger et al. conducted a systematic qualitative study on identifying critical components (Liniger et al. 2017). While the study showed promising results, the occurrence of failure modes was qualitatively determined using expert knowledge of generic fluid power systems. Thus,
actual failure rates and operational dependent failure mechanisms of the pitch system in a wind turbine was not directly considered. Two quantitative studies have been conducted with the purpose of modeling fluid power pitch system reliability (Yang et al. 2011, Han et al. 2012). While these studies have aimed at creating the model basis for calculating reliability, both the origin of failure modes and failure rates has not been fully covered. The only publicly available source of failure rate estimation for fluid power components known to the authors is the Handbook of Reliability Prediction Procedures for Mechanical Equipment (Jones 2011). This source presents failure rate models as functions of component dimensions, material properties and operating conditions. The main contribution of this paper is a feasibility study of estimating pitch system reliability using the empirical failure rate models of (Jones 2011). Estimation of failure rates has the potential to close the gap in knowledge between the qualitative and quantitative studies while also incorporating turbine operating conditions into the framework. Operating conditions are generated using a simulation model of a fluid power pitch system and the 5MW National Renewable Energy Laboratory (NREL) wind turbine implemented in the Fatigue, Aerodynamics, Structures, and Turbulence software (FAST). The estimated failure rates are compared to the most detailed and recent field failure rates available.
Pitch bearing
C1
H4
H5
V10 V7 V8 V6
A1 A2 u
s
V5 V5
H3
Connection to remaining pitch circuit
H2
A3
R1
V1 V4 QV2
V2
Pp
2
PITCH SYSTEM DESCRIPTION
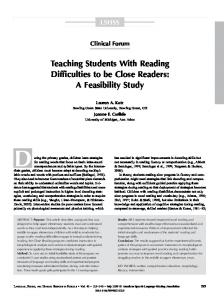
The pitch system configuration used in this analysis is depicted in figure 1 and component label description is found in table 1. The system consists of a supply located in the nacelle of a turbine and the actuation located in the rotating hub. The supply consists of a fixed displacement fixed speed pump where pressure and flow are conditioned by dump valve V2 and relief valve V1. The supply connects to the rotating hub through rotary union R1. The actuation is a conventional fluid power cylinder drive, where cylinder position is controlled closed-loop and flow is metered by the proportional valve V6. Accumulators A1 and A2 stores energy which is used for extending the cylinder C1 in the event of an emergency shutdown. The fluid power pitch system presented in figure 1 is very similar to the system analyzed in the previous qualitative study (Liniger et al. 2017). The results of the previous study showed to correlate well to field failure data which indicates that the system presented here is similar to the real-life systems which are confidential. Note that conventional fluid power pitch systems also employ a locking circuit for keeping the blade pitch angle fixed when the turbine is shut down. The locking circuit and all system transducers are omitted in this analysis as their failure rates are negligibly small compared to that of the other system components (Carroll et al. 2015).
Pt H1
M
P1
V3
F1
Figure 1: Fluid power pitch system diagram with indication of supply and actuation circuit locations in the wind turbine.
3
WIND TURBINE SIMULATION MODEL
A simulation model of the fluid power pitch system operating in a wind turbine is utilized for generating operating conditions subsequently used for reliability estimation. The wind turbine model is based on the open-source data for a 5MW NREL turbine implemented in the FAST software (Jonkman and Buhl 2005). The main specification are given in table 2. Table 1: Description of component labels. Label Description V1 Relief valve V2 Solenoid dump valve V3,V4 Check valves V5,V7-V10 Solenoid valves V6 Proportional solenoid valve C1 Differential cylinder H1-H5 Flexible hoses A1,A2 Emergency accumulators A3 Pump accumulator P1 Fixed displacement pump
Type Cartridge, poppet Cartridge, poppet Cartridge, poppet Cartridge, poppet Module, spool Gas charge, piston Gas charge, piston Internal gear
Table 2: Main data for the wind turbine and pitch system simulation model. Turbine data Value Nominal power 5 [MW] Nominal hub speed 12 [RPM] Tower height 90 [m] Blade length 63 [m] Wind speed (Rated) 11.4 [m/s] Turbulence model Normal Turbulence Model (NTM) Pitch system data Pitch cylinder (Rod/Piston/Stroke) Ø90/Ø140/1350 [mm] Pump flow (Rated) 20 [l/min] System pressure (Rated) 250 [bar]
4
OPERATING CONDITIONS
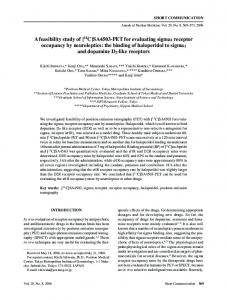
The operating conditions for the real-life turbines used in this feasibility study are unknown. Thus, the simulated system is operated under a wide range of conditions which are considered to fully cover the conditions of the real-life turbines. The considered range of operating conditions is mean wind speed, turbulence intensity, ambient temperature and fluid temperature. The full-field wind is generated using TurbSim (Jonkman 2009) and based on the IEC614001 wind turbine design standard Design Load Case (DLC) 1.2 (IEC 2006). This load case is used for evaluating fatigue loads of wind turbines during normal operation. While the pitch system is used for both stopping and starting the turbine, normal operation constitutes the majority of the system lifetime. Based on the availability of the real-life turbines (Carroll et al. 2015) and considering out-of-range wind speeds, the utilization percentage can be assumed to be 90%. The mean wind speed is normally described using the Weibull probability density distribution which can be described by a shape and scale parameter (Hansen 2008). A 20-year baseline distribution shown by blue bars in figure 2 from the Østerild location near the Danish shore is selected for the study. The black bars show the range of wind speed distributions considered by selecting shape and scale parameters ±20%
Probability density
It is noted that power capacity of the simulated turbine is above the 2-4MW range covered by the field data. The simulated operating loads may, therefore, be larger than those found in the real-life systems and possibly yielding higher estimated failure rates. The dynamical model of fluid power pitch system is based on the layout described in the previous section and is developed in a previous study by the authors (Pedersen et al. 2015). The dynamical model is implemented in Matlab/Simulink and co-simulated with FAST. The model incorporates the compressibility of fluid in the cylinder chambers, proportional valve dynamics and kinematics of the cylinder-blade coupling. The pitch angle is controlled closed-loop using a gainscheduled PI-compensator. The main specification for the pitch system is given in table 2.
Rated wind speed
0.3
0.2
0.1
0 3
5
7
9
11
13
15
17
19
21
23
25
Mean wind speed bins [m/s]
Figure 2: Mean wind speed distribution used in simulations. The black bars indicate the considered range.
from the baseline values. The wind distribution is discretized in twelve wind bins from cut-in to cut-out wind speed of the 5MW NREL turbine. To simplify the analysis, the wind direction is assumed to be ideal, that is, orthogonal to the turbine. Estimated failure rates for each wind bin is multiplied by the probability density and summarized to yield values comparable to the field data. According to the DLC 1.2, turbulence intensity is categorized in either high (class A, 16%), medium (class B, 14%) and low (class C, 12%) for the Normal Turbulence Model (NTM). All three turbulence intensity classes are considered in the feasibility study. The pitch systems are located in the hub and nacelle of the turbine which in most modern turbines is conditioned to be within a desirable operating temperature interval. Operating temperatures considered are Tamb = [0 20 60]◦ C. Lastly, the fluid temperature is controlled during normal operation of the pitch system However, it is not uncommon for the fluid temperature to be locally different than the desired value. Tf luid = [30 50 70]◦ C is selected to cover the expected range of temperatures. 5
FAILURE RATE ESTIMATION
Failure rates are estimated using the Handbook of Reliability Prediction Procedures for Mechanical Equipment (Jones 2011). The failure rate models are constructed such that an empirically determined base failure rate, λB , for a generic component is multiplied with several non-dimensional factors, C1 , C2 , C3 ..., describing both material, dimensions and operating conditions for estimating the failure rate. Some failure rates estimations are dependent on operating temperature. The operating temperature for components with direct fluid contact is set to the fluid temperature. Solenoids are if they are operated, set to the ambient temperature plus a constant offset accounting for joule heating. The offset is 100◦ C for valves that are continuously on during normal operation. Valve V2 is operated intermittently, thus reducing the temperature offset to 70◦ C. The temperature offsets are confirmed from measurements (Liniger et al. 2018). Failure rate estimates are influenced by the amount
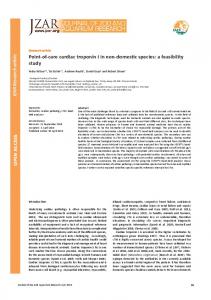
of allowable leakage for seals and valves in the system. For pitch systems, external leakage is in most cases much more critical than internal leakage due to environmental contamination hazard of the turbine surroundings. External leakage is generally set to a very low value of 2 · 10−7 l/min corresponding to a few drops a month. Allowable internal leakage is set to 10−4 l/min for seat valves and seals. Proportional spool type valves are normally associated with higher internal leakage, and the allowable limit for valve V6 is therefore set to 2l/min. Operating cycles of the valves, cylinders and accumulators are used for assessing the failure rates. Operating cycles for on/off valves are simply determined from the number of activations during normal operation. For proportional valve V6, cylinder C1 and the accumulators, the operating cycles are determined using rain-flow counting and a minimum travel threshold. The minimum threshold for C1 and the accumulators is selected to 2mm. For valve V6, the minimum threshold is 0.2mm. Due to the uncertainty of the threshold values, a sensitivity study is conducted in the results section 5.2. Contamination concentration in the fluid is also considered in the failure rate estimation. The contamination concentration at each component N10 is determined by the particles generated from upstream components according to the rates specified in (Jones 2011). Additionally, a particle filtration size of Cn = 3µm for filter F1 is utilized in the calculations. To simplify the description, the details for failure rate estimation of one component are given in the following section. The cartridge poppet type valve V2 is selected since valves are the most used component type in the system. Also, the failure rate estimation procedure for the parts in valve V2 is similar to most of the remaining components. All component specifications are similar to those found in actual pitch systems working in turbines with similar power capacity as for the real-life systems. 5.1 Cartridge Poppet Valve V2 Cartridge Valve V2 is shown in figure 3. Valve V2 consists of several parts where dimensions, material and specifications are given in table 3. All notations follow (Jones 2011) and pressures and flows are denoted according to the diagram in figure 1. The operating time tH is given in hours and NV 2 denote the operating cycles of valve V2. Note that both the factors for surface finish (roughness) for the seat valves and Young’s modulus for O-rings increase with time. The estimated failure rates for these parts are therefore increasing with time. As an example, the multiplication factors for the main poppet are given in table 4 and values are determined from a nominal operating scenario. The nominal operating scenario covers one calendar year of operation at ambient temperature Tamb = 20◦ C, fluid temperature Tf luid = 50◦ C, rated wind speed and tur-
Outer o-ring
Pilot poppet
Duo Dio Dm Dp
Solenoid
Spring
Ds
Inner o-ring
Main poppet
Figure 3: Cartridge poppet type valve V2 with part dimensions.
bulence class B. The pressure and flow rate multiplication factors depend on simulated pressure and flow time series. Multiplication factor values Cp and Cw represented in table 4 are mean values. Due to length limitations, the time series are not shown but can be found in the work by Pedersen et al. (Pedersen et al. 2015). The multiplication factors Cp , Cq , Cv , Cn , Cs , Cw are seen to cover operating conditions for pressure and flow. Cf , Cdt , Csw depend on the dimensions and manufacturing of the valve. The main poppet failure rate for the nominal operating scenario is determined according to: NV 2 λV 2,m = λB,SV Cp Cq Cf Cv Cn Cs Cdt Csw Cw (1) tH The main poppet and remaining part failure rates of valve V2 are given in table 5. Clearly, the solenoid contributes with the highest failure rate of the valve. The lowest failure rate exists for the inner o-ring. The main and pilot poppet and the spring are seen to yield similar failure rates. 5.2 Results The feasibility study of the described estimation method is performed by comparing estimated failure rates to field failure rates. The field failure rates are divided into six component groups, namely accumulators, valves, pump, cylinder, rotary union, and hoses. The system presented in fig. 1 is likewise divided in the six component groups. The accumulator group consists of A1-A3. The valve group cover V1V10 and the hose group is constructed from hoses H1H5. Each estimation case utilize all combinations of wind speed profiles as given in figure 2 and turbulence intensity classes A, B and C. Figure 4 shows the comparison between the estimated and field failure rates for a range of ambient temperatures. The black error bars indicate the variation due to the considered wind speeds, turbulence intensities and wear models. The colored bars are mean values for each estimation case. Feasible failure rates estimation means that the field data must fall within the error bars. From figure 4, the estimated failure rates are seen to be at least an order of magnitude larger than the field failure rates for component groups other than hoses. Increasing the ambient temperature slightly reduces the estimated failure
Table 3: Cartridge poppet type valve V2 data related to failure rate estimation.
Value 0.44
Allowable leakage
Cq = {
3.72
Surface finish Fluid viscosity
m Cf = 353 Cv (Tf luid ) SAE 10 fluid look-up table �3 � F Rm Nm10 · 3.79 Cn = C10O
0.024
Contact pressure Seat diameter
Cs = 0.26 ·
Cdt = 1.1 · Dm · 0.04 + 0.32
0.97
Land width
Csw = {
2.0
l ta To
H
os
n un io
es
1 R
1 C ry ot a R
Field data T = 30 °C fluid
T
10
1
T
fluid
= 50 °C
fluid
= 70 °C
100
10-1
ta l To
es os
io un y
H
n
rC
R
1
1
10-2
de
ar
rates. The only component group to fall within the estimated range is hoses. The estimated failure rates for varying fluid temperatures are seen in figure 5. Generally, the estimated failure rates increase with increasing fluid temperature. A significant change is seen for the failure rates of valves. At lowest value, the estimated failure rate of the rotary union covers the field data. The travel threshold for counting operating cycles is associated with a high degree of uncertainty. Thus, the effect of three threshold levels are analysed. The low levels are described in section 5. Medium and high thresholds are double and triple w.r.t. the low values. Increasing the threshold lowers the operating
102
ot
Table 5: Part failure rate for valve V2 under nominal operating conditions. � � Part Failure rate failure hour Main poppet λV 2,m = 2.4 · 10−7 Pilot poppet λV 2,p = 1.9 · 10−7 Spring λV 2,sp = 1.5 · 10−7 Outer o-ring λV 2,uo = 1.0 · 10−8 Inner o-ring λV 2,io = 2.7 · 10−9 Solenoid λV 2,so = 1.2 · 10−6 Valve V2 λV 2 = 1.8 · 10−6
Figure 4: Component group failure rates for varying ambient temperatures. Other conditions are fluid temperature Tf luid = 50◦ C and low travel threshold.
R
cycle 33 hour
de r
s or at um ul
1.0
s
Operating cycle rate
NV 2 tH
10-2
or
Cw = 1 +
0.25�for Dmw >1.34·10−2 QV 2 2 F Rm
0.31
at
Flow rate
�
10-1
ul
2 3 3.55−0.97·Dmw +73·Dmw −86·Dmw
100
Ac c
9000 3·∆Pm ·1.5·10−4
�1.5
0.46 0.47
T amb = 60 °C
m
�
)1.65
T amb = 20 °C
cu
(39.4·F
101
Ac
4.2−4.8·103 ·Qmf
Failures pr. year
Fluid contamination
9·10−4 ·Qmf for Qmf >4.9·10−4 l/min
Field data T amb = 0 °C
Failures pr. year
Description Cp = (4.8 · 10−3 · ∆Pm )2
cycle hour
102
Table 4: Failure rate estimation and multiplication factors for main seat valve in V2 under nominal operating conditions. Factor name Pressure
NV 2 tH
P1
Insulation class-H
in
NBR-70
yl
Duo = 28mm Duoø = 1.78mm
in
Inner diameter O-ring diameter
yl
Inner o-ring Solenoid
p
NBR-70
C
Dio = 30mm Duoø = 2.62mm
Na = 7 CL = 5mm λB,SS = 2.4 · 10−6 failure hour Quof = 2 · 10−7 l/min ∆Puo = Pp − Patm [bar] EN BR70 = 59 · 10−6 · tH + 6.2 [MPa] Fuo = 0.8µm Qiof = 10−4 l/min ∆Pio = Pp − Pt [bar] λB,S = 2.77 · 10−6 failure cycle ◦ Tcoil h= Tamb i + 70 [ C]
P1
Inner diameter O-ring diameter
cycle hour
p
Outer o-ring
NV 2 tH
Operating cycle rate Active coils Compression length Seal base failure rate (static) Allowable leakage Seal pressure drop Youngs modulus Mating surface finish Allowable leakage Seal pressure drop Solenoid base failure rate Coil temperature Operating cycle rate
C
Steel
m
Dsw = 2mm
s
Wire diameter
Steel
Pu m
Dp = 5mm Dpw = 0.5mm Ds = 15mm
Pu
Seat diameter Seat width Coil diameter
λB,SV = 1.4 · 10−6 failure cycle ∆Pm = Pp − Pt [bar] F Rm = 140l/min Qmf = 10−4 l/min −5 V 2 +0.2[µm] for NV 2 4000 cycles F Rp = 1l/min Qpf = 10−4 l/min λB,S h= 23.8i · 10−6 failure hour
ve
Pilot poppet Spring
Specification Seat valve base failure rate Seat pressure drop Rated flow Allowable leakage Surface finish Rated flow Allowable leakage Spring base failure rate
Va l
Material Steel
es
Dm = 15mm Dmw = 2mm
lv
Dimension Seat diameter Seat width
Va
Part Main poppet
Figure 5: Component group failure rates for varying fluid temperatures. Other conditions are ambient temperature Tamb = 20◦ C and low travel threshold.
cycles which in figure 6 is seen to have a minor decreasing effect to the failure rates. At a low threshold value both the valves and cylinder C1 failure rates are increased significantly. The results are generally not satisfying, and the large discrepancy between estimated and field values is either related to wrongful modeling assump-
102 Field data
Failures pr. year
Low threshold
101
Medium threshold High threshold
100
10-1
al To t
on
H os es
R 1
1 un i ar y
p
in de rC R ot
P1
C yl
es Va lv
Pu m
Ac cu
m
ul
at o
rs
10-2
Figure 6: Component group failure rates for varying travel thresholds. Other conditions are Tamb = 20◦ C and Tf luid = 50◦ C.
tions or non-describing field data. Reasons for the estimated failure rates being larger than the field data could be a consequence of the simulated wind turbine being 5MW rather than the 3-4 MW range of the real-life systems and non-modeled repair or replacements of components. Also, over 30% of field failures are known to be insufficiently documented and therefore not considered in this comparison (Liniger et al. 2017). On the other hand, the real-life systems are known to contain more components than presented in figure 1 which potentially could further increase the estimated failure rates. In spite of these facts, the large discrepancies are most likely caused by the estimation procedure being over-conservative. This is indicated by the tendency seen in figure 6 for low threshold, where the failure rates for all component groups except hoses follow the field data with an offset. As evident from the references in the Handbook of Reliability Prediction Procedures for Mechanical Equipment (Jones 2011), the empirical base failure rates date back to the late 1960’s. Latest developments in manufacturing processes, component design, and fluid properties are therefore not considered in the estimation procedure. A suggestion for increasing the precision of the estimation procedure could, therefore, be to adjust the base failure rates to more current data and evaluate if the multiplication factor can be used as is. 6
The estimated failure rates were over-conservative in relation to the field failure rates for accumulators, valves, pump, cylinder and rotary union. The method yielded feasible results only for failure rates of hoses. While being over-conservative, the estimated failure rates followed the same tendency of the field data for accumulators, valves, pump, cylinder and rotary union. The similar tendency indicated that the base failure rates are incorrect for components in modern pitch systems and should be updated using more recent test data.
CONCLUSION
A feasibility study of estimating fluid power pitch system reliability has been conducted using an estimation procedure for generic fluid power components. The estimated values were determined based on operating conditions obtained from a simulation model of a pitch system in normal operation in a turbine. The estimated failure rates were compared to failure rates of real-life turbines. Large parameter variations related to wind speed, turbulence intensity, and system temperatures were performed since the operating conditions of the real-life turbines were unknown.
REFERENCES Carroll, J., I. Dinwoodie, A. McDonald, & D. McMillan (2015). Quantifying O&M savings and availability improvements from wind turbine design for maintenance techniques. 9. Carroll, J., A. McDonald, & D. McMillan (2015). Failure rate, repair time and unscheduled O&M cost analysis of offshore wind turbines. Wind Energy, 1107–1119. Han, X., H. Zhang, Y. Chen, X. Zhang, & C. Wang (2012). Fault diagnosis of hydraulic variable pitch for wind turbine based on qualitative and quantitative analysis. World Congress on Intelligent Control and Automation (WCICA), 2012 10th , 3181–3185. Hansen, M. O. (2008). Aerodynamics of wind turbines (2. ed.). earthscan London. IEC (2006). Wind turbines part 1: Design requirements (IEC 61400-1:2005). Jones, T. L. (2011, May). Handbook of Reliability Prediction Procedures for Mechanical Equipment. West Bethesda, Maryland 20817-5700: Naval Surface Warfare Center NSWC. Jonkman, J. (2009, August). TurbSim user’s guide: Version 1.50. Technical Report NREL/TP-500-46198, National Renewable Energy Laboratory, 1617 Cole Boulevard, Golden, Colorado 80401-3393. Jonkman, J. & M. L. J. Buhl (2005, August). FAST user’s guide. Technical Report NREL/EL-500-29798, National Renewable Energy Laboratory, 1617 Cole Boulevard, Golden, Colorado 80401-3393. Liniger, J., M. Soltani, H. C. Pedersen, J. Carroll, & N. Sepehri (2017, June). Reliability based design of fluid power pitch systems for wind turbines. Wind Energy 20(6), 1097–1110. Liniger, J., S. Stubkier, H. C. Pedersen, & M. Soltani (2018). Early detection of coil failure in solenoid valves. Submitted to: IEEE/ASME Transactions on Mechatronics. Pedersen, H. C., T. O. Andersen, & J. Liniger (2015, October). Investigation of load reduction possibilities in wind turbines using a fluid power pitch system. In Proceedings of the ASME/BATH 2015 Symposium on Fluid Power & Motion Control. American Society of Mechanical Engineers. Wilkinson, M. & B. Hendriks (2010). Reliability-focused research on optimizing wind energy system design, operation and maintenance: Tools, proof of concepts, guidelines & methodologies for a new generation. Collaborative Project: Large Scale Integrated Project, FP7-ENERGY-2007-1-RTD. Yang, X., J. Li, W. Liu, & P. Guo (2011). Petri net model and reliability evaluation for wind turbine hydraulic variable pitch systems. Energies 4(6), 978–997.