Aug 16, 2013 ... There are several tools (e.g., Shart, TFN, TFN2K, Trinoo, etc.) that ... in Table 1.
The packet-level information includes time stamp, source IP ... UTC.canon.pcap.
2009- ..... To simplify network traffic without losing general characteristics .....
1700. 1900. 0. 10. 20. 30. 40. 50. 60. Mbp s. Time (Seconds). 2009-01.
Electrical & Electronic Systems
Hu, J Electr Electron Syst 2013, 2:2 htp://dx.doi.org/10.4172/2332-0796.1000110
Research Article Research Article
OpenAccess Access Open
A Fluid-Based Approach for Modeling Network Activities Yen-Hung Hu* Department of Computer Science, Hampton University, Hampton, Virginia 23668, USA
Abstract Network traffic traces provide valuable information for researchers to study behaviors of normal and malicious network activities. Although traffic traces are enough to reveal packet-level and connection-level details of most network activities, identifying specific malicious network activities is still a huge challenge: many malicious network activities are able to hide themselves behind normal activities with forged packet and connection information. In practice, mechanisms that are able to effectively extract malicious network activities from raw traffic traces are emerging and will benefit network security and other related communities as well. In this paper, a fluid-based approach for modeling simulated normal and malicious flooding-based denial of service network activities is developed. To approach this goal, several raw traffic traces gathered by the Cooperative Association for Internet Data Analysis (CADIA) are analyzed and investigated.
Keywords: Network activities; Denial of service Introduction The Internet has merged into our daily life because of its usage and enormous size: it is estimated that at least 8 x 10⁸ documents and links covering almost every categories that we need [1]. Since the increasing number of fixed and mobile Internet-enabled devices, economic value of the Internet grows as well. In 2009, the Internet contributed about 3.8 % of the United States (U.S.) Gross Domestic Product (GDP) and the U.S. has led the Internet supply ecosystem [2-4]. Due to its popularity and financial capability, the Internet has become a target of many criminals and terrorists. In the first quarter of year 2012, there were 83 million pieces of malware including 8 thousand mobile malware; more than 1 trillion messaging threats (e.g. email spam); more than 4 million messaging botnets; huge number of network threats (e.g. Remote Procedure Call (RPC), SQL injection, Browser, cross-site scripting, etc.); and about 8 million websites hosting malicious downloads or browser exploits. The U.S. was almost at the top of every listed attack category [5]. Meanwhile, the number of cyber-attack on U.S. critical infrastructures (e.g. dams, energy, water, and cross-sector) increased sharply from 2009 to 2011 (from 9 incidents to 209 incidents) [6]. The report [7] conducted by Ponemon Institute in August 2011 revealed that average financial impact of every victim (private company) due to cyber-crime is in the range from 1.5 million to 3.6 million U.S. dollars and is about 56 percent increase from their last year’s report. This report also indicated there is more than 1 successful attack per company per week and such a number is 44 percent increase compared to their last year’s report. Paolo Passeri [8] presented monthly reports in cyberattacks statistics. His observation indicated that Denial of Service (DoS) attack is the top three attack techniques affecting the stability of the Internet. Since flooding-based DoS attack could be launched with very less effort comparing with other attacks, it has been widely adopted to flood resources of victims and cause service disruption. There have been many approaches proposed to reduce Internet threats [9-23]. In this paper, we are interested in flooding-based DoS attack since its simplicity. We develop a fluid-based approach for modeling simulated normal and malicious flooding-based DoS network activities. To achieve objectives of this paper, we first analyze raw traffic traces and calculate statistical data of them. We then, mimic normal and malicious flooding-based DoS network traffic and depict a fluid-based model to study network activities. Our approach is based on an observation that malicious floodingJ Electr Electron Syst ISSN: 2332-0796 JEES an open access journal
based DoS network activities are not isolated, but related as different stages of a series of cyber-attacks. Intuitively, their traces could be caught even though they are carefully hidden behind normal network activities and have forged footprints. For example, the distribution of inter-arrival time of a series of malicious requests on a web-server could be identified even through those malicious requests implemented with forged IP headers. In order to launch a successful flooding-based DoS attack, the hacker has to make large enough requests to overwhelm the target’s service capacity. Therefore, such malicious service requests are tended to be intensive and follow best-effort approach. The remainder of this paper is organized as follows: Section 2 reviews related work. Section 3 covers background of flooding-based DoS attack. Section 4 introduces the simulated normal and malicious traffic. Section 5 describes characteristics of the selected network traffic captured by CADIA. Section 6 explains fluid-based approach on a single congested network. Section 7 discusses performance of our model under the simulated normal and malicious traffic. Section 8 concludes this paper and points out future work.
Related Work Several literatures have studied and addressed strategies for mitigating cyber-attacks. Lobo et al. [9] studied attacks and countermeasures of the Windows Rootkits: software that is used to hide malicious activities and permit hackers to take control of victims. Several suggestions were issued to the Microsoft and research communities for developing future Windows operating systems. Shafi [10] surveyed security challenges in Cyber-Physical Systems (CPS). Agresti [11] proposed four distinct forces that will shape the future evolution of cybersecurity. Michael et al. [12] emphasized the importance of integrating legal and policy in cyber-preparedness. Eom et al. [13] developed an active cyber-attack model for accessing network vulnerabilities. Yu et al. [14] discussed models and countermeasures for
*Corresponding author: Yen-Hung Hu, Department of Computer Science, Hampton University, Hampton, Virginia 23668, USA, E-mail:
[email protected] Received May 29, 2013; Accepted August 14, 2013; Published August 16, 2013 Citation: Hu YH (2013) A Fluid-Based Approach for Modeling Network Activities. J Electr Electron Syst 2: 110. doi:10.4172/2332-0796.1000110 Copyright: © 2013 Hu YH, et al. This is an open-access article distributed under the terms of the Creative Commons Attribution License, which permits unrestricted use, distribution, and reproduction in any medium, provided the original author and source are credited.
Volume 2 • Issue 2 • 1000110
Citation: Hu YH (2013) A Fluid-Based Approach for Modeling Network Activities. J Electr Electron Syst 2: 110. doi:10.4172/2332-0796.1000110
Page 2 of 8 attacks that aim at Internet threat monitors. Wang et al. [15] focused on developing a mechanism to gather digital evidences that could be used to defend against cross-site script attack. Tejay et al. [16] analyzed performance of existing information system security countermeasures. Leland et al. [17] presented a result of Ethernet traffic: “aggregating streams of such traffic typically intensifies the self-similarity instead of smoothing it”. Several other researchers adopted the concept of selfsimilarity as well to propose their approaches for detecting cyberattacks such as traffic anomaly [18], intrusion [19], spam [20], and Distributed DoS (DDoS) attack [21]. In 1998, Defense Advanced Research Projects Agency (DARPA) and Air Force Research Lab (AFRL) funded a research in MIT Lincoln Laboratory to create large-scale intrusion detection database as the first standard set for measuring performance in terms of false alarm for each intrusion detection system under test. Most intrusion detection systems use signatures of known attacks to detect attacks. Many of these systems suffer high false alarm rates and poor detection of new attacks. Despite its increasing role in intrusion detection system, network traffic analysis approach remains premature: lack of effective malicious patterns and heavy increase of computational overhead [22,23].
Flooding-Based Denial Of Service Attack An easy way to cause service denial to normal requests is by congesting the target links though high-rate unresponsive malicious flows. Flooding-based DoS attack [24-26] is the most prevalent among all cyber-attacks. It induces attack traffic from a sufficient number of compromised hosts to carry out congestion and cause most packets from normal flows to be dropped at the routers or service stacks. Most of the approaches in literatures for dealing with congestion are dedicated to providing fairness [27-31] to all active flows or rejecting malicious packets before they reach the service stacks [25-29]. Those approaches may not reduce impacts of malicious flows since they are sharing the same bandwidth with normal flows. The most common way to introduce flooding-based DoS attack is to disrupt connections between victims and legitimate users. For instance, in TCP SYN flooding attack [29], a large number of TCP SYN packets with spoofed source addresses are sending to service ports of the victim to request for establishing new connections. The victim responds those requests with SYN-ACK packets and waits for ACK packets from those requests. Since source addresses in those TCP SYN packets are spoofed and unreachable, these SYN-ACK packets will never reach their destinations. And then the victim is forced to retransmit SYNACK packets for each request several times before giving up and could not establish regular connections for legitimate requests. An alternative way to cause flooding-based DoS attack is to drain the bandwidth of all incident links of the victim to force the nearest router to drop most incoming packets of the victim. Attackers could do this by generating a heavy load of UDP-like unresponsive best-effort traffic (e.g., UDP, ICMP, TCP SYN, etc.) to exhaust bandwidth of the victim. For instance, attackers can broadcast ICMP Echo packets with victim’s IP address in the source field [28]. And then huge amount of ICMP Echo replies will be triggered and aim at the victim. These replies would overwhelm the victim’s network and consume most of its bandwidth and cause denial of service. There are several tools (e.g., Shart, TFN, TFN2K, Trinoo, etc.) that could conduct flooding-based DoS attack easily and automatically by using the existing network protocols such as TCP, ICMP, UDP, or mixture of them. Those DoS attacks can either consume all connections or network bandwidth to cause denial of service. J Electr Electron Syst ISSN: 2332-0796 JEES an open access journal
Analyzing Existing Network Traffic Traces Existing network traffic traces provide clues for researchers to study scenarios and patterns of packets and connections. Researchers can simply derive statistical data regarding to packets, connections, and network resources for conducting complicated simulations. In our research, we first gather knowledge from existing network traffic traces. 4 network traffic traces (Table 1) provided by the CAIDA (www.caida.org/data) have been analyzed. They were all captured by the “Equinix San Jose A” monitoring point equipped with OC-192 optical link and dated from year 2009 to 2011. Each of these traffic traces contains 60-second raw network data.
Packet level analysis We extract packet-level information from those traffic traces listed in Table 1. The packet-level information includes time stamp, source IP address, destination IP address, protocol, packet size (with and without IP header), source port (application), destination port (application), and other information regarding to TCP, etc. We group packets from every traffic trace into several different streams according to their protocols. In this paper, we differentiate packets into three categories: TCP packet, UDP packet, and Other packet. The packet-level information of the selected traffic traces is revealed in the Table 2 and 3. We observe that about 78% - 88% of network traffic is made by TCP packets, about 9% - 20% is made by UDP packets, and about 1% - 4% is made by other packets. We also observe that there are more than 85 other protocols (e.g., control messages, peer-to-peer protocol, other special protocols) implemented in the selected traffic traces. These observations meet our expectation, since the majority of web applications (e.g., HTTP and HTTPS) are implemented upon TCP-related protocols [32,33]. Overall, we observe that TCP and UDP packets make up more than 94% of all packets.
Connection level analysis To apply connection level analysis, we extract connection information from the first selected traffic trace (labeled 2009-01). In Traffic Trace
File Name
2009-01
Equinox-sanjose.dirB.20090115-130000.UTC.canon.pcap
2009-02
Equinox-sanjose.dirB.20100121-130000.UTC.canon.pcap
2009-03
Equinox-sanjose.dirB.20110120-130000.UTC.canon.pcap
2009-04
Equinox-sanjose.dirB.20120119-130000.UTC.canon.pcap Table 1: The Selected Traffic Traces. 2009-01
2010-01
2011-01
2012-01
TCP Packet
12261116
16456196
24846485
26542956
UDP Packet
1482744
1694519
6396887
3101842
Other Packet
522407
530530
505827
1159979
Table 2: Percentage of Packets in the Selected Traffic Traces. 2009-01
2010-01
2011-01
2012-01
TCP Packet
85.95%
88.09%
78.26%
86.16%
UDP Packet
10.39%
9.07%
20.15%
10.07%
Other Packet
3.66%
2.84%
1.59%
3.77%
Table 3: Composition of Packets in the Selected Traffic Traces.
Volume 2 • Issue 2 • 1000110
Citation: Hu YH (2013) A Fluid-Based Approach for Modeling Network Activities. J Electr Electron Syst 2: 110. doi:10.4172/2332-0796.1000110
Page 3 of 8 here, we use a unique combination of source IP address, destination IP address, and Protocol to represent a “Connection”. Our results show that there are about 589,537 connections in this traffic trace. Among them, 46.62% are TCP connection, 39.95% are UDP connection, and 13.43% are others (Table 4). We also calculate life (in seconds) and size (in number of packets) of every connection (Table 5 and 6) in this traffic trace. We observe that: • Average life of TCP connections is longer than that of UDP and Other connections: As shown in the Table 5, there are about 25.3% of TCP connections having life shorter than 1 second. However, the value is 77.93% for UDP connections and 68.53% for Other connections, respectively. Meanwhile, about 50% of TCP connections having life longer than 20 seconds, but only about 6% of UDP connections and 19% of Other connections having life longer than 20 seconds, respectively. • Average size of TCP connections is larger than that of UDP and Other connections: As shown in Table 6, there are about 76.66% of TCP connections having size smaller than 10 packets, but about 97.67% of UDP connections and 93.4% of other connections having size smaller than 10 packets, respectively. Overall, we observe that UDP connections are much shorter in size and life than TCP connections. One interesting factor of UDP connections is: about 78% of UDP connections having life shorter than 1 second and more than 97% of them having size less than 10 packets. This could be formed by large amount of short-life streaming video or audio data embedded in webpages. All Connection TCP Connection UDP Connection Other Connection Number Percentage
595611
277697
237927
79987
100%
46.62%
39.95%
13.43%
Table 4: Connection Number and Percentage in Traffic Trace 2009-01. X
TCP Connection
UDP Connection
Other Connection
1
25.03%
77.93%
68.53%
10
44.13%
89.88%
76.42%
20
50.19%
93.69%
80.69%
30
54.48%
96.05%
85.13%
40
86.43%
97.51%
90.05%
50
91.91%
98.66%
94.52%
Table 5: Connections with Life ≤ X Seconds in Traffic Trace 2009-01. X
TCP Connection
UDP Connection
Other Connection
10
76.66%
97.67%
93.40%
100
94.62%
99.65%
99.36%
200
96.90%
99.77%
99.73%
300
97.79%
99.82%
99.85%
400
98.29%
99.85%
99.89%
500
98.59%
99.87%
99.92%
Table 6: Connections with Size ≤ X Packets in Traffic Trace 2009-01. Traffic Trace
All-stream
TCP-stream
UDP-stream
2009-01
0.84
0.84
0.55
OTHER-stream 0.55
2010-01
0.75
0.76
0.55
0.59
2011-01
0.81
0.81
0.62
0.73
2012-01
0.80
0.80
0.69
0.72
Table 7: Hurst Parameter of Four Different Streams in the Selected Traffic Traces.
J Electr Electron Syst ISSN: 2332-0796 JEES an open access journal
Self similarity analysis Another important factor of network traffic is heavy-tailed distribution [17]. We examine and study this factor of the selected network traffic traces. Self similarity: Let X ( X t : t = 0,1, 2,3...) represent a stationary stochastic process with mean X , variance S 2 and auto-correction ( m ) : k 1, 2, 3…) ( m) (Xk = function r (k ), k ≥ 0 . Let X = for each m = 1,2,3…, denote the new covariance stationary time series obtained by averaging the original series over non-overlapping blocks of size m. (m)
= Xk Thus
1 ( X km − m +1 + ... + X km ), k ≥ 0 . The correction function of X k( m ) m
(m) is r ( m ) (k ) . X is said to be self-similar if r → r (k ) as
m→∞
.
Hurst parameter: A practical approach to present the scale of selfsimilarity is to calculate the Hurst parameter H. A time series is selfsimilar as long as its Hurst parameter is bounded between 0.5 and 1. The larger the value of H indicates the higher the scale of self-similarity. Several approaches have been applied to estimate Hurst parameter. In this paper, we apply re-scaled adjusted range statistic approach (R/S statistic) to evaluate Hurst parameter. R/S statistic: R ( n) 1 = Let S (n) S (n) [Max(0,W1 ,...,Wt ) − min(0,W1 ,...Wt )]
Since
R ( n) a1n H as n → ∞ , S ( n)
as the slop of
with Wt = ( X 1 + ... + X t ) − tX .
Hurst parameter H of X could be represented
R ( n) E vs.log n . S ( n)
Hurst parameter of the selected traffic traces: To study selfsimilar characteristics of the select traffic traces, we apply R/S statistic to data streams that are extracted from them. We extract 4 data streams form each selected traffic trace. These data streams are labeled as: ALLstream (stream of all packets), TCP-stream (stream of TCP packets only), UDP-stream (stream of UDP packets only), and OTHER-stream (stream of all other packets). We evaluate Hurst parameters of these data streams. The results are in the Table 7. We observe that TCP-stream is much more self-similar (i.e., Hurst parameter ~ 0.8) than UDP-stream and OTHER-stream. We also observe that the Hurst parameter of ALL-stream is almost equal to the Hurst Parameter of TCP-stream. This is because most packets in ALLstream are actually TCP packets.
Simulated Normal and Simulated Malicious Traffic We have learned the following scenarios from the selected traffic traces discussed in the Section III and IV: (1) TCP packets contribute to about 85%, UDP packets contribute to about 10% and the combination of them contribute to about 95% of the network traffic, respectively; (2) TCP-stream is more self-similar than UDP-stream and Other-stream since it tends to be burstiness. (3) Other packets could be treated as UDP-like since characteristics of them are very similar to UDP; (4) Hurst parameter of All-stream is very similar to TCP-stream, since TCP packets make up most of the network traffic. To simplify this research without loss of generality we build a set of simulated network traffic: simulated normal traffic and simulated malicious traffic. • Simulated Normal Traffic: It is a combination of TCP and UDP traffic: 85% TCP packets and 15% UDP packets. This simulated normal traffic will behave self-similar with Hurst parameter about 0.85. It is about 50% of TCP flows will last longer than 10
Volume 2 • Issue 2 • 1000110
Citation: Hu YH (2013) A Fluid-Based Approach for Modeling Network Activities. J Electr Electron Syst 2: 110. doi:10.4172/2332-0796.1000110
Page 4 of 8 seconds. But only 10% of UDP flows could last longer than 10 seconds. Meanwhile, this traffic is made up by 50% TCP flows and 50% UDP flows. • Simulated Malicious Traffic: To mimic flooding-based DoS attack, we assume this simulated malicious traffic is made up by a large number of UDP-like flows with short flow life and small flow size. In order to confuse most intrusion detection systems, it is assumed average flow life of the simulated malicious traffic will be shorter than 1 second and average flow size will be smaller than 10 packets. To gain best result, this simulated malicious traffic will not behave self-similar and have Hurst parameter smaller than 0.5.
Fluid-Based Approach for Modeling Network Traffic in a Single Congested Network To study network behavior without captures of actual network traffic, we develop a fluid-based approach adopting ideas from [24]. We model network traffic as a fluid and use Stochastic Differential Equations (SDE) to model TCP traffic. We also derive differential equations to describe Drop-Tail queuing policy. As mentioned in the previous sections, TCP and UDP are the two major protocols used in the selected network traffic traces. Therefore, we consider only these two protocols in the fluid-based model. Performance measures used in this paper are throughput, goodput, and drop-rate: throughput represents sending rate (in bits per second) of the source node of a connection, drop-rate represents packet-loss rate (in bits per second) of a connection, and goodput represents receiving rate (in bits per second) of the destination node of a connection. In our model, we consider network traffic in a link as fluid flows in a pipe. Therefore, for any given connection k at time t with throughput Ak (t ) and drop-rate Dk (t ) , its goodput GPk (t ) can be represented as Ak (t ) - Dk (t ) That is GP= Ak (t ) − Dk (t ) k (t )
(1)
We first apply our model on a single congested network to study traffic behaviors. We than extend our study to a multi-congested network with complicated network traffic.
Audpi =
ludpi τudpi
(2)
Throughput of any TCP connection j To simplify network traffic without losing general characteristics of TCP protocol, we assume TCP implements an Additive Increase Multiplicative Decrease (AIMD) policy: when there is no congestion occurred, the policy of “Additive Increase” will increase the congestion window by 1 for every round trip time; when congestion detected, the policy of “Multiplicative Decrease” will decrease the congestion windows by half. Therefore, for any TCP connection j following the AIMD policy, its dynamic congestion window size can be represented by a SDE listed below. W ( t − 1) 1 t) δ W j (= (3) (1 − I j (t − 1)) δ t − j 2 I j (t − 1) R j (t ) The first portion denotes that congestion window size W j (in packets) of TCP connection j will increase by 1 for every round trip time R j (in 0 ). But the second seconds) during a non-congestion period (i.e., I j ( t − 1) = portion denotes that congestion window size will become half of the size of its previous state (i.e.,
W j (t − 1) 2
), if there is at least one packet of TCP
1 ) dropped during a congestion period. connection j (i.e., I j (t − 1) =
In here, I is a packet loss indication function. I = 1 while at least a packet loss from TCP connection j is detected. Otherwise, I = 0. At time t, TCP connection j will send out W j (t ) packets. Thus throughput
Atcp j (t )
where
is packet size (in bits) of TCP flow j. That is
ltcp j
Atcp j (t ) =
of TCP connection j can be written as
W j (t ) × ltcp j R j (t )
W j (t ) × ltcp j
,
(4)
R j (t )
Throughput of all connections Intuitively, aggregate throughput Aall (t ) of all connections (i.e., N UDP connections + M TCP connections) passing through the bottleneck router vr, having service capacity Cv and physical queue size Qvmax , at time t can be represented as ∑ A (t ) + ∑ A (t ) , where Audp (t ) and Atcp (t ) can be derived from Equation (2) and Equation (4), respectively. Therefore, we have W j ( t ) × ltcp j ludpi = Aall ( t ) ∑ + ∑ (5) r
i∈N
r
Single congested network
udpi
j∈M
tcp j
i
j
In this section, we assume there is only one bottleneck router in the network that causes packet losses. A network G is a directed graph, G = (V, E), where V={v1, v2, ..., vx}, denoting a set of routers in G, and E = {e1, e2, ..., ey}, denoting a set of links in G. We further assume that there are N UDP connections and M TCP connections passing through the only bottleneck vr in the network G during the monitoring period Ϩt. To study traffic behaviors, we measure throughput of every connection before the bottleneck router vr and goodput of every connection after the bottleneck router vr, respectively. Drop-Tail is the default and one of the most popular queuing management algorithms. In this paper, we implement Drop-Tail in all of our network models.
Throughput of any UDP connection i Since UDP adopts best-effort fashion, throughput of an UDP connection could be constant during its life time. Thus the average inter-arrival time τ udp (in seconds) of any UDP connection i could i l be represented as udpi , where ludp is packet size (in bits) of UDP flow
τ udp
i. That is
i∈N τudpi
R j (t )
j∈M
In order to determine packet loss indication function I in the Equation (3), we introduce a drop probability function P. For any incoming packet z arriving the bottleneck vr at time t, let’s assume its drop probability is Pz (t ) , where 0 ≤ Pz (t ) ≤ 1 . We will discuss this Pz (t ) in the next section.
Drop probability of any incoming packet z We consider two events that cause packet losses: (1) aggregate throughput Aall (t ) of all connections during the motoring period is larger than service capacity Cv of the bottleneck router vr and (2) instantaneous queue size Qvl (t ) at time t of the congested router is larger than its physical queue size Qvmax . r
r
r
Since characteristics of TCP connection and UDP connection are different, drop probability Pz (t ) of any incoming packet z passing through the bottleneck router vr with DT policy at time t could be determined by: (1) protocol of this packet (either TCP or UDP); (2)
i
i
J Electr Electron Syst ISSN: 2332-0796 JEES an open access journal
Volume 2 • Issue 2 • 1000110
Citation: Hu YH (2013) A Fluid-Based Approach for Modeling Network Activities. J Electr Electron Syst 2: 110. doi:10.4172/2332-0796.1000110
Page 5 of 8 aggregate throughput Aall (t ) of all connections; (3) throughput (either Audp (t ) or Atcp (t ) of UDP connection i or TCP connection j where this incoming packet z belongs; (4) service capacity Cv of the bottleneck router vr; and (5) instantaneous queue size Qvl (t ) at time t and physical queue size Qvmax of the bottleneck router vr. j
i
r
r
r
To discuss these conditions in detail, we consider the following four cases: Case 1: Aall (t ) ≤ Cv : Since aggregate throughput Aall (t ) is less than service capacity Cvr of the bottleneck router vr, there is no packet loss. Therefore, drop probability of incoming packet z at time t will be 0 (i.e., Pz (t ) = 0 ). r
Case 2: Aall (t ) > Cvr and Qvmax − Qvl (t − 1) ≥ ( Aall (t ) − Cv ) × δ t : Although aggregate throughput Aall (t ) is larger than service capacity Cv of the bottleneck router vr, drop probability Pz (t ) of incoming packet z at time t is still 0 (i.e., Pz (t ) = 0 ). This is because available queue space (i.e., Qvmax − Qvl (t − 1) ) is still large enough to accommodate this incoming packet. r
r
r
r
r
r
Case 3: Aall (t ) > Cv and 0 < Q − Q (t − 1) < ( Aall (t ) − Cv ) × δ t : In this case, for any incoming packet z at time t, its drop probability would be proportional to throughput of the connection where this packet belongs. Since z could be a TCP or UDP connection, we have to consider both cases. If packet z is an UDP packet and belongs to UDP l vr
max vr
r
r
connection i, its drop probability is proportional to
Audpi (t ) Aall (t )
. However,
if packet z is a TCP packet and belongs to TCP connection j, its drop probability is proportional to
Atcp j (t ) Aall (t )
. We introduce a random variable
Ran_Var whose value is between 0 and 1 to determine whether the incoming packet z will be dropped or not. We assume Pz (t ) = 1 if Ran _ Var ≥ (1 −
Atcp j (t ) Aall (t )
) . Otherwise
Pz (t ) = 0 .
max Case 4: Aall (t ) > Cv and Q= Qvlr (t − 1) : Since aggregate vr throughput Aall (t ) is larger than service capacity Cv of the bottleneck router vr and queue size of this router is full at time t-1, the incoming packet z will be dropped without doubt. Therefore, Pz (t ) = 1 . r
r
Packet loss indication function of any incoming packet z in TCP connection j
Equation (2) or Equation (4). Drop-rate Dk (t ) of connection k could be estimated by determining drop probability of every incoming packet of this connection during time t. Therefore, goodput GPk (t ) of connection k at time t could be measured by using models we addressed in the previous sections.
Modeling Simulated Network Traffic In this section, we demonstrate various simulated network traffic according to the knowledge learned from the selected raw network traffic traces and models developed from our fluid-based approach.
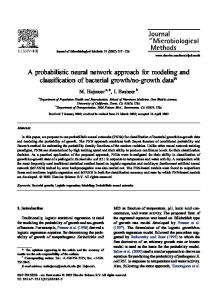
Modeling simulated normal traffic with single TCP and UDP connection To understand TCP and UDP involved in the simulated normal and malicious traffic, we design a simple simulation to study their characteristics. At first, we simulate dynamical change of congestion window size and goodput of a TCP connection. The parameters involve in this simulation are: physical queue size of the congested router is 32,000 bits; minimum window size of TCP is 1 packet; maximum window size of TCP is 80 packets; average TCP round trip time is 20 ms; service capacity of the congested router is 10 Mbps; and TCP packet size is 8,000 bits. As shown in the Figure 1, congestion window size of this TCP connection is fluctuated between 15 and 31 packets after the first packet loss detected. Meanwhile, we also discover goodput of this TCP connection is fluctuated as well (Figure 2). These results indicate that the TCP AIMD policy adopted in our model actively responses to packet losses from this TCP connection. We then add an UDP connection into the same simulation to study the competition between TCP and UDP. We designate a reserved service capacity of the congested router to this UDP connection and then capture its goodput vs. time. The additional parameters needed for this simulation are: UDP packet size is 1,600 bits and throughput of this UDP connection is fixed to about 15% of the service capacity of the congested router. As we expected, goodput of the TCP connection will be reduced since it responds to network congestion. However, the
To determine packet loss indication function I of TCP connection j demonstrated in the Equation (3), we consider the following four cases for any incoming packet z belonging to TCP connection j. r
Case 2: Aall (t ) > Cvr and Q Pz (= t ) 0, I j (t += 1) 0 .
max vr
− Q (t − 1) ≥ ( Aall (t ) − Cvr ) × δ t : Since l vr
Case 3: Aall (t ) > Cv and 0 < Qvmax − Qvl (t − 1) < ( Aall (t ) − Cv ) × δ t : We have I j (t + 1) = 1 , if there exists any Pz (t ) = 1 . Otherwise I j (t + 1) = 0. r
r
Case 4: Aall (t ) > Cv and r
r
max Q= Qvl v r
r
r
t ) 1, I j (t + 1) = 1. ( t − ) : Since Pz (=
Goodput of any connection k As mentioned in the Equation (1), goodput represents receiving rate of the destination of a connection. For any given connection k, its goodput GPk (t ) at time t can be represent as Ak (t ) − Dk (t ) , where Ak (t ) denotes throughput of connection k and Dk (t ) denotes drop rate of connection k. In here, throughput Ak (t ) could be estimated by using either J Electr Electron Syst ISSN: 2332-0796 JEES an open access journal
Congestion Windwo Size (Packets)
Case 1: Aall (t ) ≤ Cv : Since Pz (= t ) 0, I j (t += 1) 0 .
35 30 25 20 15 10 5 0
0
2
4
6
8
10
Time (Seconds)
Figure 1: Congestion Window Size of a TCP Connection vs. Time
Volume 2 • Issue 2 • 1000110
Citation: Hu YH (2013) A Fluid-Based Approach for Modeling Network Activities. J Electr Electron Syst 2: 110. doi:10.4172/2332-0796.1000110
Page 6 of 8 UDP connection keeps its sending-rate steadily (Figure 3). Therefore, we see a potential that how a single malicious activity can gain largest advantage against normal network activities: using high-rate nonresponsiveness packets to flood targeted victims.
1900 1700
Modeling simulated normal traffic with multiple TCP and UDP connections
1500
Mbps
As we observed in the previous sections, traffic trace 2009-01 has about 590,000 connections within its 60 second monitoring period. Among these connections, 47% are TCP connection, 40% are UDP connection, and 13% are other connections. We also observe that about 51% of them having connection life shorter than 1 second and about 87% of them having connection size less than 10 packets.
1100
700 500
10
20
30
40
50
60
Figure 4: Heavy Burstiness in Traffic Trace 2009-01.
1000 100 10 1 0.1
12
0.01
10
0.001
Goodput (Mbps)
0
Time (Seconds)
Connections X 1000
14
1300
900
These data demonstrate a fact that most connections passing through the monitoring point are very short and fragile and even TCP connection would act like an UDP one and will not perform congestion control as well as it is designed. Therefore, we could see a large amount of burstiness across 60-second monitoring period (Figure 4). This fact explains why TCP SYN attack could bring much more damages than we expected. It could not only hijack services for normal requests, but also deprive them of network bandwidth. To model multiple connections with various sizes and lives, we introduce three additional variables (start_time, end_time, and size) to
2009-01
0 0.5 1 1.5 2 2.5 3 3.5 4 4.5 5 5.5 6 6.5 7 7.5 8 8.5 9 9.5 10 Connection Life (Seconds)
8
Figure 5: Life Distribution of Traffic Trace 2009-01. 6 4
1000
2
100 10
0
2
4
6
8
10
Time (Seconds)
Figure 2: Goodput of a TCP Connection vs. time.
Connections X 1000
0
1 0.1 0.01 0.001
12
0.0001 10
0
0.5
1
1.5
2
2.5
3
3.5
Connection Size (Mbyte) Goodput (Mbps)
8
Figure 6: Size Distribution of Traffic Trace 2009-01.
6 4 TCP
UDP
2 0
0
2
4
6
8
10
Time (Seconds)
Figure 3: Goodput of a TCP Connection and an UDP Connection vs. Time.
J Electr Electron Syst ISSN: 2332-0796 JEES an open access journal
our model to represent start time, end time, and size of a connection. We use life and size distribution learned from traffic trace 2009-01 to mimic start_time, end_time, and size of every connection. As shown in the Figure 5 and 6, life distribution of traffic trace 2009-01 demonstrate a Power Law-like characteristic: exponential decrease with long tail; and size distribution of the same traffic trace demonstrate a Poisson-like characteristic: exponential decrease. Therefore, these two characteristics would be added into our model to produce those three additional parameters for every connection.
Volume 2 • Issue 2 • 1000110
Citation: Hu YH (2013) A Fluid-Based Approach for Modeling Network Activities. J Electr Electron Syst 2: 110. doi:10.4172/2332-0796.1000110
Page 7 of 8 12
2. Hätönen J (2011) The economic impact of fixed and mobile high-speed networks. EIB Papers 16: 30-59.
10
3. Greenstein S, McDevitt R (2011) The broadband bonus: estimating broadband Internet’s economic value. Telecommunications Policy 35: 617-632. 4. Rausas MP, Manyika J, Hazan E, Bughin J, Chui M, et al. (2011) Internet matters: the net’s sweeping impact on growth, jobs, and prosperity. McKinsey Global Institute.
Goodput(Mbps)
8
5. McAfee Lab (2012) McAfee Threats Reports: First Quarter 2012.
6 TCP
4
6. Industrial Control Systems Cyber Emergency Response Team Control Systems Security Program (2011) ICS-CERT incident response summary report 20092011.
UDP
7. Ponemon Institute (2011) Second annual cost of cyber crime study. 2
0
8. Passeri P (2013) Cyber attack statistics. 0
2
4
6
8
10
Time (Seconds)
Figure 7: Goodput of a TCP Connection and an Aggregate UDP Connection vs. Time.
Modeling simulated malicious traffic In this paper, we assume malicious traffic is derived from a certain amount of malicious UDP-like connections with short life and small size and aiming at some predefined network victims. To mimic flooding-based DoS attack, we introduce a simulated malicious traffic which is made up by a number of UDP-like flows with short flow life and small flow size. We assume their average life will be shorter than 1 second and their average size will be smaller than 10 packets as well. To exhaust bandwidth of the victim, this simulated malicious traffic will not behave self-similar and have Hurst parameter smaller than 0.5. Our approach is based on an observation that malicious floodingbased DoS network activities are not isolated, but related as different stages of a series of malicious attacks. Intuitively, their traces could be caught even though they are carefully hidden behind normal activities and have forged footprints. To model simulated malicious traffic, we introduce a large amount of UDP-like best-effort packets as an aggregate UDP connection with throughput fixed to about 30% of the service capacity into the monitoring point. Other simulation conditions are the same as modeling simulated normal traffic with single TCP and UDP connection. We observe that goodput of the simulated normal traffic decreased as the number of simulated malicious packet increased (Figure 7).
Conclusion and Future Work In this paper, we (1) analyze several selected traffic traces; (2) introduce a set of simulated normal traffic and simulated malicious traffic according to the knowledge learned from the selected traffic traces; and (3) develop a fluid-based model to study performance of a single congested network under simulated normal traffic and the simulated malicious traffic. In the future, we will develop more network models (e.g., a network with multiple congestion points) to study performance of the simulated traffic. We will also extend our network model and simulated traffic to study other malicious activities and to evaluate their influences as well. References 1. Albert R, Jeong H, Barabasi A-L (1999) Diameter of the World-Wide Web. Nature 401: 130-131.
J Electr Electron Syst ISSN: 2332-0796 JEES an open access journal
9. Lobo D, Watters P, Wu X-W, Sun L (2010) Windows rootkits: attacks and countermeasures. Proceeding of 2010 Second Cybercrime and Trustworthy Computing Workshop. 10. Shafi Q (2012) Cyber physical systems security: a brief survey. Proceeding of 12th International Conference on Computational Science and Its Applications. 11. Agresti W (2010) The four forces shaping cybersecurity. Computer 43: 101-104. 12. Michael J, Sarkesain J, Wingfield T, Dementies G, de Sousa GNB (2010) Integrating legal and policy factors in cyberpreparedness. Computer 43: 90-92. 13. Eom JH, Han YJ, Park SH, Chung TM (2008) Active cyber attack model for network system’s vulnerability assessment. Proceeding of 2008 International Conference on Information Science and Security. 14. Yu W, Zhang N, Fu X, Battati R, Zhao W (2010) Localization attacks to Internet threat monitors: modeling and countermeasures. IEEE Transactions on Computers 59: 1655-1668. 15. Wang SJ, Chang YH, Chiang WY, Juang WS (2007) Integrations in cross-site script on Web-systems gathering digital evidence against cyber-intrusions. Proceeding of Future Generation Communication and Networking (FGCN 2007). 16. Tejay G, Zadig S (2012) Investigating the effectiveness of IS security countermeasures towards cyber attack deterrence. Proceeding of 45th Hawaii International Conference on System Sciences. 17. Leland W, Taqqu M,Willinger W, Wilson D (1994) On the self-similar nature of Ethernet traffic. IEEE/ACM Transactions on Networking 2: 1-15. 18. Cheng X, Xie K, Wang D (2009) Network traffic anomaly detection based on self-similarity using HHT and wavelet transform. Proceeding of Fifth International Conference of Information Assurance and Security. 19. Allen W, Marin G (2003) On the self-similarity of synthetic traffic for the evaluation of intrusion detection system. Proceedings of 2003 Symposium on Applications and the Internet. 20. Lee J, Jeong HD, McNicke D, Pawlikowshi K (2011) Self-similar properties of spam. Proceeding of Fifth International Conference on Innovative Mobile and Internet Services in Ubiquitous Computing. 21. Zhang S, Zhang Q, Pan X, and Zhu X (2011) Detection of low-rate DDoS attack based on self-similarity. Proceeding of second International Workshop on Education Technology and Computer Science. 22. Lippmann R, Cunningham R (2000) Improving intrusion detection performance using keyword selection and neural networks. Computer Networks 34: 597603. 23. Peddabachigari S, Abraham A, Grosan C, Thomas J (2007) Modeling intrusion detection system using hybrid intelligent systems. Journal of Network and Computer Applications 30: 114-132. 24. Change RKC (2002) Defending against flooding-based distributed denial-ofservice attacks: a tutorial. IEEE Communication Magazine 40: 42-51. 25. Piskozub A (2002) Denial of service and distributed denial of service attacks. Proceedings of the International Conference on Modern Problems of Radio Engineering, Telecommunications and Computer Science. 26. CERT Coordination Center (2001) Denial of service attacks.
Volume 2 • Issue 2 • 1000110
Citation: Hu YH (2013) A Fluid-Based Approach for Modeling Network Activities. J Electr Electron Syst 2: 110. doi:10.4172/2332-0796.1000110
Page 8 of 8 27. Floyd, S, Jacobson V (1993) Random early detection gateways for congestion avoidance. IEEE/ACM Transactions on Networking 1: 397-413.
SIGCOMM on Applications, Technologies, Architectures, and Protocols for Computer Communication.
28. Demers A, Keshav S, Shenkar S (1990) Analysis and simulation of a fair queueing algorithm. Proceedings of SIGCOMM ‘89 on Communications Architectures & Protocols.
31. Ott TJ, Lakshman TV, Wong, LH (1999) SRED: stabilized RED. Proceedings of IEEE INFOCOM’99.
29. Shreedhar M, Verghese G (1996) Efficient fair queueing using deficit round robin. IEEE/ACM Transactions on Networking 4: 375-385. 30. Lin D, Morris, R (1997) Dynamics of random early detection. Proceedings of
32. Fielding R, Gettys J, Mogul J, Frystyk H, Masinter L, et al. (1999) Hypertext Transfer Protocol -- HTTP/1.1. Network Working Group, RFC 2616. 33. Rescorla E (2000) HTTP Over TLS. Network Working Group, RFC 2818.
Submit your next manuscript and get advantages of OMICS Group submissions Unique features: • • •
User friendly/feasible website-translation of your paper to 50 world’s leading languages Audio Version of published paper Digital articles to share and explore
Special features:
Citation: Hu YH (2013) A Fluid-Based Approach for Modeling Network Activities. J Electr Electron Syst 2: 110. doi:10.4172/2332-0796.1000110
J Electr Electron Syst ISSN: 2332-0796 JEES an open access journal
• • • • • • • •
200 Open Access Journals 15,000 editorial team 21 days rapid review process Quality and quick editorial, review and publication processing Indexing at PubMed (partial), Scopus, EBSCO, Index Copernicus and Google Scholar etc Sharing Option: Social Networking Enabled Authors, Reviewers and Editors rewarded with online Scientific Credits Better discount for your subsequent articles
Submit your manuscript at: www.omicsonline.org/submission/
Volume 2 • Issue 2 • 1000110