This article has been accepted for publication in a future issue of this journal, but has not been fully edited. Content may change prior to final publication. Citation information: DOI 10.1109/TSG.2017.2776325, IEEE Transactions on Smart Grid
1
A Framework for Cyber-topology Attacks: Line-switching and New Attack Scenarios Gaoqi Liang, Student Member, IEEE, Steven R. Weller, Member, IEEE, Junhua Zhao, Senior Member, IEEE, Fengji Luo, Member, IEEE, and Zhao Yang Dong, Fellow, IEEE
E
recent years. Consistency and integrity of the grid topology is a fundamental prerequisite for the control center to ensure the safe and economic operation of the grid. In practical power systems, the network topology could be changed due to the planned transmission line maintenance and/or forced and unforeseen line outages. Therefore, real-time operation of the grid is based on accurate knowledge of the network topology, which is achieved through real-time observations of breakers/switches in the network. The tight coupling of cyberand physical infrastructures in modern power systems thus provides opportunities for cyber attackers to launch cyber-topology attacks in which maliciously introduced fake grid topology information disturbs the normal operations of the grid. Topology attacks against power systems which have been studied in the literature can be generally classified into two categories: physical topology attack and cyber topology attack [2]. The physical topology attack refers to an attack in which one or more bus/line interconnections are physically destroyed by attackers. In cyber topology attacks, bus/line interconnections are not physically attacked, but the outputs of measurement devices are falsified by attackers when transmitting to the control center.
This work is partially supported in part by a China Southern Power Grid research grant (WYKJ00000027), in part by a Visiting Scholarship of State Key Laboratory of Power Transmission Equipment & System Security and New Technology (Chongqing University, China) (2007DA10512716401), in part by a Shenzhen Municipal Science and Technology Innovation Committee International R&D project (GJHZ20160301165723718), and in part by the Early Career Research Scheme of the Faculty of Engineering and Information Technology, University of Sydney, Australia. G. Liang is with the Centre for Intelligent Electricity Networks (CIEN), University of Newcastle, Callaghan, NSW 2308, Australia (e-mail:
[email protected]). S.R. Weller is with the School of Electrical Engineering and Computing, University of Newcastle, Callaghan, NSW 2308, Australia (e-mail:
[email protected]). J. Zhao is with the Chinese University of Hong Kong (Shenzhen), China, and also with the Electric Power Research Institute, China Southern Power Grid, Guangzhou, China (email:
[email protected]). F. Luo is with the School of Civil Engineering, University of Sydney, Sydney, NSW 2006, Australia, and also with the State Key Laboratory of Power Transmission Equipment & System Security and New Technology, Chongqing University, China (e-mail:
[email protected]). Z.Y. Dong is with the School of Electrical Engineering and Telecommunications, University of New South Wales, NSW 2006, Australia (e-mail:
[email protected]).
A. Related Works It has been widely recognized that power network topology information is vulnerable to attackers [3-6]. Numerous researchers have analyzed the impact of independent topology errors on power system operations. For example, Ashok et al. in [7] showed that topology errors can lead to erroneous state estimation (SE) outputs, and thereafter cause mistaken contingency analyses; Choi and Xie in [8] showed that the locational marginal price (LMP) could be affected by topology errors; Rahman et al. in [9] showed that the optimal power flow (OPF) can potentially be influenced by false topology information. The false data injection attack (FDIA) first proposed by Liu et al. [11] has subsequently been studied by many authors. Liang et al. in [12] gave a comprehensive review of FDIAs; impact analysis of independent FDIAs on system security [15] and electricity markets [16], [17] are also studied. These studies show that a malicious party could potentially gain revenues from the day-ahead and real-time electricity markets by launching FDIAs either through congestion patterns or virtual bidding activities. Likewise many researchers have studied coordinated topology attacks and FDIAs, which can produce severe
Abstract— Cyber security of modern power systems has drawn increasing attention in recent years. This paper proposes a class of cyber-topology attacks derived from false data injection attacks (FDIAs), with the aim of disturbing the operation of power systems. Three kinds of cyber-topology attack are proposed: line-addition attack, line-removal attack, and line-switching attack. By directly misleading the decision-making process of the Independent System Operator (ISO), the proposed cyber-topology attack consequently affects the economic operation and security of the system. We establish optimal attack models for different cyber-topology attack scenarios, and use a recently proposed metaheuristic optimization algorithm (the Natural Aggregation Algorithm (NAA)) to solve the resulting attack models. Experiments based on the IEEE 39-node benchmark system show that the proposed class of attacks poses a significant threat to modern power systems. Index Terms— Cyber-topology attack, false data injection attack, electricity market, cyber security, line-switching attack
I.
INTRODUCTION
NSURING the security of the grid is a primary concern of power system operations [1]. With the increasing integration of multidisciplinary technologies, modern power systems have become complex cyber-physical systems, making them vulnerable to various cyber-attacks. The cyber security of today’s grids has therefore become an active research topic in
1949-3053 (c) 2017 IEEE. Personal use is permitted, but republication/redistribution requires IEEE permission. See http://www.ieee.org/publications_standards/publications/rights/index.html for more information.
This article has been accepted for publication in a future issue of this journal, but has not been fully edited. Content may change prior to final publication. Citation information: DOI 10.1109/TSG.2017.2776325, IEEE Transactions on Smart Grid
2 disturbances on power system operations. Research in [18]-[23] studied the theoretical and instance analysis of the FDIA-based topology attack in smart grid, and showed it was able to cause serious secure hazards and economic losses to power systems. Some researchers further studied the coordination of physical-attack and cyber-attack, referred as the state-and-topology cyber-physical attack (STCPA). In STCPA, attackers first physically disconnect a power line, before launching a topology-preserving attack, using FDIAs to mask the physical attack. Research in [25]-[28] showed that under STCPA, the grid operator could not respond to the line outage quickly potentially leading to overload on other power lines. However, synchronization of physical-attack and cyber-attack could not be guaranteed, since it requires human intervention to implement the physical power line attack. B. Assumptions and Contributions of this Paper The success of the late-2015 cyber-attack in Ukraine [29] [30] implies that cyber attackers are capable of gaining power network knowledge via long-term reconnaissance and firmware deployment [31]. For the purposes of the present study, an attack is considered successful if the cyber attacker can manipulate the database in which all measurements are consolidated in control centre. Moreover, manipulating a database within the control centre is substantially easier for cyber attackers than taking over the control centre itself, as in the 2015 Ukraine blackout event. It is therefore reasonable for this study to make the following assumptions, which are consistent with the extensive literature on FDIAs [3]-[28]: a) The cyber-attacker has knowledge of all grid information, including the state estimation scheme, bad data detection method, topology matrix, and line parameters of the system; b) The cyber-attacker is capable of falsifying any meter measurement, i.e. digital information of breakers/switches that are transmitted to the network topology processor and analog information that are transmitted to the state estimator. Existing research on cyber-topology attacks adopt only the line-removal attack scenario [4]-[9], [20]-[24] in which connected lines are changed to disconnected status. However, practical cyber-topology attacks are not limited to such an approach, as an attacker could not only remove lines, but might also falsify line addition operations, or might add and remove the lines simultaneously (here referred to as a line-switching attack). Furthermore, an attacker could pursue different attack objectives against the power system. The contributions of this paper are four-fold: (1) All possible cyber-topology attack approaches are considered in this paper, i.e., line-addition attack, line-removal attack, and line-switching attack. In particular, this paper shows that the line-switching attack, which is not previously considered in the literature, can have profound (negative) impacts on the power system; (2) We analyse in detail the impacts of launching a valid cyber-topology attack. We show that a cyber-topology attack could lead to deviations in various system state indices which could either threaten system security or economic operation; (3) This paper proposes different cyber-topology attack scenarios to disturb the power system. These scenarios
represent practical motivation for attackers to launch the attack. Each attack scenario is formulated using single- or multiobjective optimization models; and (4) A new metaheuristic algorithm recently proposed by the authors, i.e. the Natural Aggregation Algorithm (NAA) [32]-[33], is applied to solve the proposed cyber-topology attack models. This paper is organized as follows. Section II introduces the cyber-topology attack classification and detection evasion strategy; Section III proposes the cyber-topology attack modelling; Section IV presents the solution approach; Section V presents simulations based on the modified IEEE-39 bus system. Finally, Section VI presents conclusions and future directions.
II.
CYBER-TOPOLOGY ATTACK CLASSIFICATION AND DETECTION EVASION STRATEGY
In this section, we first give an overview of cyber-topology attack, and then propose a classification of cyber-topology attacks based on the transmission line set. Detection evasion strategy is also proposed to ensure the cyber-topology attack not being detected by energy management system (EMS) modules. A. Overview of Cyber-Topology Attack By definition, the cyber-topology attack is significantly different from the physical-topology attack. The former manipulates the network topology information at the cyber layer, while the latter actually manipulates the physical network topology. By launching a successful cyber-topology attack, the network topology conceived by the ISO would thus be inconsistent with the actual network topology. In modern power systems, the network topology processor (NTP), which is a component of EMS, is responsible for constructing the system topology from the telemetered breakers/switches’ status data [2], [3]. Other EMS modules utilize the network connectivity information generated by the NTP for different applications, e.g., observability analysis, state estimation, power network modelling, etc. In the event that connected/disconnected information collected from breakers/switches is falsified, the topology network gained from the NTP might differ from the actual network. The topology information of a network can be expressed as an incidence matrix A nm : 1 j (1,...m), A(i, j ) 1 0
(1)
where n is the number of nodes; m is the number of transmission lines; ‘1’ represents that the transmission line j starts at node i; ‘-1’ represents that the transmission line j ends at node i; ‘0’ represents line j neither starts nor ends at node i. To illustrate, consider a system in which the actual physical topology is depicted as shown in Fig. 1. In the absence of a cyber-topology attack, the NTP constructs the topology information as the following incidence matrix, based on the measured statuses of breakers/switches:
1949-3053 (c) 2017 IEEE. Personal use is permitted, but republication/redistribution requires IEEE permission. See http://www.ieee.org/publications_standards/publications/rights/index.html for more information.
This article has been accepted for publication in a future issue of this journal, but has not been fully edited. Content may change prior to final publication. Citation information: DOI 10.1109/TSG.2017.2776325, IEEE Transactions on Smart Grid
3 0 0 1 1 0 1 0 1 1 0 A 0 1 1 0 1 1 0 0 0 0 0 1 0 0 0
1 0 0 0 0
0 1 0 0 1
i1
2
Backbone Lines
R
5
3
Fig. 3. Transmission line sets of a network ( C S R , C A )
i5
TABLE I CLASSIFICATION OF CYBER-TOPOLOGY ATTACK
1
Name
i6
Fig. 1. The actual 5-node system topology network (under no attack)
i3
i1 4
5
i5 1
i6
Fig. 2. The control center believed 5-node system topology network (under attack)
In the presence of cyber-topology attack, the incidence matrix could be altered. For example, suppose the attacker has successfully falsified the status of the breaker on the 7th transmission line in Fig. 1 from CLOSED to OPEN. Note in this case that the physical status of the breaker on the 7th transmission line is not manipulated, and only the cyber information transmitted to the control centre is falsified. Then as a consequence, the incidence matrix under attack is changed and shown by Eq. (3). In this sense, the ISO is deceived into believing the topology of current network has become the one shown in Fig. 2. 0 0 1 0 1 0 1 1 A 0 1 1 0 1 0 0 0 0 1 0 0
1 1 0 0 1 0 0 0 0 0
(3)
B. Cyber-Topology Attack Type Classification In an n-node network, the set of all physically deployed transmission lines (denoted ) can in principle be utilized to transmit electricity. In practice, however, for a variety of reasons (e.g., line faults, line maintenance), not all physical transmission lines are necessarily employed [35],[36]. We denote by C the set of physically deployed transmission lines
Set of currently used lines
C under attack
Line-addition attack
S R , A
Line-removal attack
S R , R
Line-switching attack
i2 3
2
i4
A
Removable lines
i3 i4
Not currently used lines
S
i2
i7 4
(2)
S R , A , R
which are currently being used, and denote by A the set of lines not being used; clearly C A . Some transmission lines are kept connected all the time, and form the backbone of the network. These lines are considered as pivotal lines of the whole network. The connection statuses of these transmission lines are often robustly protected and difficult to falsify [35] [36]. It could thus be reasonable to assume that these backbone lines guarantee the observability of the power system. Denoting the set of backbone transmission lines as S and remaining set of transmission lines in C as R , then there is C S R . In summary, the classification of transmission lines can be illustrated in Fig. 3. A cyber-topology attack aims to falsify the line connection status at the cyber layer, wherein the attacker has three basic forms of attack options: (1) line-addition attack: some of the line connection statuses are falsified from OPEN to CLOSED in the information layer; (2) line-removal attack: some of the line connection statuses are falsified from CLOSED to OPEN in the information layer; (3) line-switching attack: some of the line connection statuses are falsified from OPEN to CLOSED, and some of the line connection statuses are simultaneously falsified from CLOSED to OPEN in the information layer. After the attack, the control center could be deceived, with the currently used transmission line set (denoted C ) differing from the actual set C ; the ISO would also thus be deceived. The false C under different attack categories are shown in Table I, where denotes the set of lines which are falsified from OPEN status to CLOSED status, and denotes the set of lines which are falsified from CLOSED status to OPEN status, where and . C. Detection Evasion Strategy In order to successfully launch the aforementioned cyber-topology attack, the attacker should adopt certain strategies to evade detection by the EMS. In a practical
1949-3053 (c) 2017 IEEE. Personal use is permitted, but republication/redistribution requires IEEE permission. See http://www.ieee.org/publications_standards/publications/rights/index.html for more information.
This article has been accepted for publication in a future issue of this journal, but has not been fully edited. Content may change prior to final publication. Citation information: DOI 10.1109/TSG.2017.2776325, IEEE Transactions on Smart Grid
4 Analog meter measurements
ISO Decision-making
The current operating point SE
3 Ac
tua l
gy
S R
Ne tw
ork
1
p To lse Fa
LMPs for all Nodes
The current topology information
2 o tw
To po lo
BDD
NTP
rk
g
olo
SCED
TEP
On-off status of breakers/ switches
e yN
Generator outputs, etc
C under attack
The energy demand
Load
Fig. 5. The flow diagram of ISO decision-making procedure
Fig. 4. Cyber-topology attack flow chart
network, after the NTP receives breaker/switch status data, the topology error processing (TEP) module checks for consistency of the digital and analog telemetered data [8], [20], [21]. If any inconsistency is detected (e.g., a nonzero power flow appears on a disconnected line), the control center is informed of the error and the network topology is re-estimated. Only in the absence of inconsistency is the network topology approved to be used by other modules of the EMS [20], [21]. Therefore, if the digital data are manipulated, the corresponding analog data also needs to be manipulated in order to deceive the TEP. Furthermore, all analog data should be detected by bad data detection (BDD) so as to filter false data. In this sense, when launching a cyber-topology attack, a cyber attacker needs to evade both BDD and TEP by calculating appropriate malicious injection data. Suppose there are M meters deployed in an n-node network. Suppose the original measurement vector is z and z j z , j [1, M ] ; the injection data is represented as vector a and a j a , j [1, M ] ; the measurement data under attack is z
and z j z , j [1, M ] . From the cyber-attacker’s viewpoint, the attacker always wishes to manipulate least number of meter measurements while evade from being detected by TEP and BDD. This motivation can be modelled as follows: min (4) a 0 0, if j ( A ) s.t. j [1, M ], z j a j , if j z j a j , others
z h( x) e 1 ( z h( x))T W ( z h( x)) 2
Dispatch Solution
III.
With the cyber-topology attack, the system topology conceived for the ISO is different from the actual one. As shown in Fig. 4, arrow ① shows that the currently used transmission line set is falsified in the cyber side; arrow ② represents that the decision-making of the ISO is based on the falsified topology; arrow ③ shows the control decisions made by the ISO are applied on the actual system. These actions could significantly cause deviations of the system. A. SCED Model One of the most important decision-making roles of the ISO is to perform security-constrained economic dispatch (SCED), which optimally dispatches generators and determines LMPs of the wholesale energy market. The overall procedure of SCED is shown in Fig. 5. The impacts of cyber-topology attack on SCED are explained as below. The SCED model is formulated as follows: min (8) ci ( Pgi ) iK g
P
s.t.
iK g
(7)
where Eq. (5) is used to keep consistency of measurements so as to evade detection from NTP; Eq. (6) is the state estimation model, in which h( x) represents the functional dependency between measurements and state variables, and e denotes the vector of measurement noise; Eq. (7) represents for the BDD detection model, in which W is a diagonal matrix relating to the measurement error of meters, and is the threshold [11].
D
jK d
(9)
j
Ql vi v j (bij cosij gij sin ij ) bij vi2 , (i, j ) l
min
, Pgi pi Pgi min Pgi min
min
vi Pl
(6)
gi
Pl vi v j ( gij cosij bij sin ij ) gij vi2 , (i, j ) l (10) max Pgi
(5)
CYBER-TOPOLOGY ATTACK MODELLING
Ql
min
max
(11)
, Pgi pi , i K g (12)
vi vi
max
,i K
(13)
Pl Pl
max
, l C
(14)
Ql Ql
max
, l C
(15)
where K g is the set of generator nodes; K d is the set of load nodes; K is the set of all nodes; ci () represents the production cost of the i-th generator; Pgi is the power output of the i-th min max generator, with Pgi and Pgi as the corresponding minimum
and maximum limits; D j is the demand on the j-th node;
ij i j , with i and j as the voltage angle at node i and j; g ij and bij are the conductance and susceptance from node i to j;
Pgi is the real-time measurement of the i-th generator’s output; pi is the margin of i-th generator’s output;
1949-3053 (c) 2017 IEEE. Personal use is permitted, but republication/redistribution requires IEEE permission. See http://www.ieee.org/publications_standards/publications/rights/index.html for more information.
This article has been accepted for publication in a future issue of this journal, but has not been fully edited. Content may change prior to final publication. Citation information: DOI 10.1109/TSG.2017.2776325, IEEE Transactions on Smart Grid
5 TABLE II DEVIATIONS CAUSED BY CYBER-TOPOLOGY ATTACK
Deviation production cost
Deviation value = value under attack - value under no attack
LMP
ilmp = lmpi - lmpi , i K
Power flow
f
=
c (P
iK g
i
gi
)-
c (P
iK g
i
gi
TABLE III CLASSIFICATION OF ATTACKING OBJECTIVES
Scenarios
Single-objective
)
Case 1 : max Case 2 :
Scenario 1: Economy max
iK
l pf = Pl - Pl , l c
lmp
i
with vi min and vi max as the corresponding minimum and maximum limits; Pl and Ql are the real and reactive power flow on transmission line l , and Pl min , Pl max , Ql min , and Ql max as the corresponding minimum and maximum limits; In Eq. (10) and (11), (i, j ) l indicates that i and j are the two ends of transmission line l ; B. Deviation of Variables Before and After Attack In the absence of cyber-topology attack, C S R . By solving the SCED model, the optimal generator outputs, LMPs, * and active power flows are calculated, denoted by Pgi , lmpi , and Pl , respectively. In the presence of cyber-topology attack, it holds that , or C S R C S R C S R , where A , R . The calculated optimal generator outputs, LMPs, and active power flows (denoted by Pgi , lmpi and Pl , respectively) would be
different from those without the attack. As shown by arrow ③ in Fig. 4, the outcome ( Pgi ) of ISO decision-making is applied to the actual topology network in which C S R , resulting in modified generator outputs
and active power flows, denoted by Pgi and Pl , respectively. In this paper, we assume Pgi and Pl can be directly
calculated from the power flow equations, ignoring the automatic generation control (AGC) operations of the system. The deviations of system variables between the no-attack and attacked cases are shown in Table II. C. Different Attack Scenarios Cyber-attackers attack the power system with various objectives (e.g. causing disturbance, producing blackouts, making profits in power market, etc.). For instance, Xie et al. in [17] assumed that the cyber-attacker is a participant who makes financial profits through virtual bidding transactions in the power markets by launching FDIAs. In this paper, we assume that a cyber attacker aims to introduce disturbances into the system with the following two motivations: causing economic losses to the system or customers; and causing security damage on transmission lines. Based on the deviations caused by the cyber-topology attack shown in Table II, these two motivations are reflected as mathematical attacking objectives, i.e., scenario 1 and scenario 2, as shown in Table III. The explanation of each scenario is as follows:
Case 3 : Case 1 & Case 2
* Di max
Scenario 2: Security
vi and v j are the voltage magnitude of the i-th and j-th node,
Multi-objective
f
l pf , l c
Scenario 1: The cyber attacker aims to maximize the economic loss for the system or customers. In this study, we further consider following three cases: Case 1 in Scenario 1 represents the single-objective motivation that the cyber attacker aims to maximize the total production cost for the system; Case 2 in Scenario 1 represents the single-objective motivation that the cyber attacker aims to maximize the total purchasing fee for retailers or large customers who buy electricity from the wholesale market. Case 3 in Scenario 1 represents the multi-objective motivation that the cyber attacker aims to maximize the total production cost for the system and the total purchasing fee for retailers/large customers, simultaneously. Scenario 2: The cyber attacker aims to cause the largest power flow deviation on targeted line which endangers the system security. D. Cyber-Topology Attack Modelling Based on the discussions in previous sections, the cyber-topology attack can be modelled as follows: max (16) G( , , a) s.t.
{Pgi* , lmpi* , Pl *} f SCED (c )
{Pgi , lmpi , Pl } f {Pgi , Pl } f
pf
SCED
(c )
( Pgi , c )
(17) (18) (19)
{a} f ( , ) a
(20) where G () represents each proposed single or multiple objective shown in Table III; f SCED () represents the SCED model from Eqs. (8)-(15); Eq. (17) represents the case without attack; Eq. (18) represents the case with attack; f pf () represents the power flow equations (Eqs. (9)-(11)). Eq. (19) represents the arrow ③ in Fig. 4, i.e., ISO’s control decisions are applied to the actual topology network; f a () represents the model from Eqs. (4)-(7). In summary, by solving the cyber-topology attack model, the cyber attacker calculates the appropriate set of lines and to manipulate, and determines the injection value a to avoid being detected. To quantify the disturbance degree of the cyber-topology attack on system operations, similar to reference [23], we define the relative perturbation factor as:
Fattack F 100% F
(21)
where F and Fattack are system values before and after attack.
1949-3053 (c) 2017 IEEE. Personal use is permitted, but republication/redistribution requires IEEE permission. See http://www.ieee.org/publications_standards/publications/rights/index.html for more information.
This article has been accepted for publication in a future issue of this journal, but has not been fully edited. Content may change prior to final publication. Citation information: DOI 10.1109/TSG.2017.2776325, IEEE Transactions on Smart Grid
6 TABLE IV TRANSMISSION LINE SETS OF THE MODIFIED IEEE-39 BUS SYSTEM
Start
ISO Decision-making based on topology under no attack ( S R )
lm p i , i K
Pgi , i K g
NTP / SE Calculation
NO
Both TEP and BDD passed ? YES
ISO Decision-making based on topology under attack ( S R )
lm p i , i K
Update and
Pgi , i K g
EMS real-time energy balancing ( S R )
Pgi , i K g
Pl , l ( S R )
Objective from Table III Calculation
NO
Maximum Deviation Reached ? YES
End
Fig. 6. The flow chart of solving the proposed model
For example, represents the relative perturbation factor of the production cost, then c ( P ) c ( P ) i gi i gi f
iK g
iK g
c (P
iK g
IV.
i
gi
)
100%
c (P
iK g
Transmission lines
S
2-30, 6-31, 10-32, 16-19, 19-20, 19-33, 20-34, 22-35, 23-36, 25-37, 29-38
R
1-2, 1-39, 2-3, 2-25, 3-4, 3-18, 4-5, 4-14, 5-6, 5-8, 6-7, 6-11, 7-8, 8-9, 9-39, 10-13, 12-11, 12-13, 13-14, 14-15, 15-16, 16-17, 16-24, 17-18, 17-27, 21-22, 22-23, 23-24, 25-26, 26-27, 26-28, 26-29, 28-29
A
10-11, 16-21
*
a
Update Injection Data a
Transmission line sets
i
gi
)
100% .
CYBER-TOPOLOGY ATTACK SOLUTION METHOD
A. Approach to Solve the Cyber-topology Attack Model The flow chart of the cyber-topology attack is shown in Fig. 6. In the first stage, the SCED without attack is calculated. In the second stage, the SCED under attack is performed, which consists of following steps: (1) the attacker calculates the appropriate injection data to pass both TEP and BDD under the attacked transmission line set; (2) system statuses under attack are calculated; and (3) the corresponding objective from Table III is then calculated. The program terminates if the maximum deviation is achieved, otherwise the cyber-topology attack plan needs to be updated. B. Introduction to NAA and MOEA/D From Table III, it can be seen that the attack models for case 1 in scenario 1, case 2 in scenario 1, and scenario 2 are single
objective optimization problems, while case 3 in scenarios 1 is multi-objective optimization problems. In this paper, we use a new metaheuristic algorithm recently proposed by the authors [32]-[33], namely the Natural Aggregation Algorithm (NAA), to solve the single objective problems, while the multi-objective evolutionary algorithm based on decomposition (MOEA/D) [34] is applied to solve the multi-objective problems. We also compare the efficiency of NAA with the well-known Differential Evolution (DE) algorithm [37], a widely-used optimization technique recognized for its strong global search capability. NAA mimics the self-aggregation intelligence of group-living animals, balancing the exploitation and exploration steps within a search process, and uses a set of heuristic rules to perform a stochastic search in the problem space. As a population-based evolutionary algorithm, NAA distributes the whole population across multiple sub-populations through a stochastic migration model so as to evaluate the probability of leaving or entering into the current sub-populations. In each generation, both the local search and generalized search are performed in the problem space. In lab experiments, NAA shows very strong global searching capability and fast convergence. In this paper, each individual is encoded as a vector with the dimension of D +D Dinjection . The first D dimensions are binary variables, representing the OPEN/CLOSED line status of set; the next D dimensions are also binary variables, representing the OPEN/CLOSED line status of set; the last Dinjection dimensions are continuous variables, representing the injection values on sensors. Further details on NAA can be found in [32] [33]. MOEA/D decomposes a multi-objective optimization problem into a number of scalar optimization sub-problems and optimizes them simultaneously. Each individual solution in the population is associated with a sub-problem. Each sub-problem is optimized by only using information from its neighboring sub-problems. A neighborhood relationship among all the sub-problems is defined based on the distances of their weight vectors. MOEA/D shows low computational complexity. Further details on MOEA/D can be found in [34]. MOEA/D gives rise to a set of Pareto-optimal solutions. Since the objectives conflict with each other, all solutions on the Pareto frontier are non-dominated and considered as optimized solutions.
1949-3053 (c) 2017 IEEE. Personal use is permitted, but republication/redistribution requires IEEE permission. See http://www.ieee.org/publications_standards/publications/rights/index.html for more information.
This article has been accepted for publication in a future issue of this journal, but has not been fully edited. Content may change prior to final publication. Citation information: DOI 10.1109/TSG.2017.2776325, IEEE Transactions on Smart Grid
7 TABLE V ATTACK RESULTS OF CASE 1 IN SCENARIO 1
Line-removal attack
Line-switching attack
Algorithms
NAA DE NAA
-0.71% -0.71% 7.30%
16-21 16-21 –
DE
7.30%
–
NAA
7.85%
10-11
DE
7.85%
10-11
– – 1-39, 25-26 1-39, 25-26 1-2, 25-26 1-2, 25-26
Sensor Falsified 103/177 103/177 104/177 104/177 105/177 105/177
Line-switchi ng attack
NAA DE NAA
-15.47% -15.47% 40.49%
10-11 10-11 –
DE
33.91%
–
NAA
49.28%
DE
47.27%
10-11, 16-21 16-21
– – 1-39, 4-14 12-11, 25-26 13-14, 25-26 1-2, 4-14
V.
0.07 0.06 0.05 0.04
0.02 0.42
Algorithms
Sensor Falsified 103/177 103/177 104/177 104/177 106/177 105/177
SIMULATIONS
In this section, we conduct simulations based on the modified IEEE 39-node benchmark system. All simulation programs presented here are implemented in MATLAB/MATPOWER and executed on a 4-core, 64-bit Dell workstation with an Intel ® Core ™ i5-2400 CPU and 4-Gigabyte RAM. A. Simulation Setup The IEEE 39-bus benchmark system consists of 10 generators, 39 nodes and 46 branches. We modify the standard IEEE-39 bus system into three parts. In total 46 transmission lines are assumed to be physically deployed, of which and 44 are used. We also select 11 lines as the backbone of the network. The corresponding line sets are shown in Table IV. We assume 46 breakers are deployed in the network to collect digital information on all lines; 46×2 meters are deployed to collect analog information on both ends of each line, and meters are deployed on all 39 nodes. There are therefore a total of 177 sensors in the modified IEEE 39-bus system. Load parameters on all buses for all cases in the study use the default values of the standard IEEE 39-bus system in MATPOWER. No congestion patterns are considered. The control parameters of NAA are set as: N S =4 , Cp S =4 , =1 , Crlocal 0.9 , =1.2 and Crglobal =0.1 ; populations size = 20, iteration time = 20. The parameters of DE are set as follows: F 0.5 ; Cr 0.1 ; population size = 20; and iteration time = 20. B. Simulation Results The two proposed attack scenarios shown in Table III are simulated. Tables V and VI report the optimal results of case 1
Selected solution
0.08
0.03
TABLE VI ATTACK RESULTS OF CASE 2 IN SCENARIO 1
Line-addition attack Line-removal attack
0.09
Objective 1st - case 1 in scenario 1
Line-addition attack
0.1
Non - dominated solution Approximated Pareto frontier
0.43
0.44
0.45 0.46 0.47 0.48 0.49 Objective 2nd -- case 2 in scenario 1
0.5
0.51
Fig. 7. The Pareto front for case 3 in Scenario 1
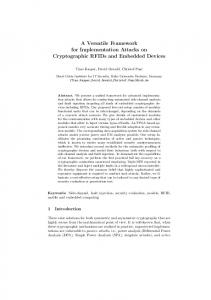
and case 2 in scenario 1, respectively. Figure 7 shows the non-dominated solutions of case 3 in scenario 1 by using MOEA/D. Figure 8 shows the disturbance degree of the cyber-topology attack for all 46 subcases. Table VII reports the details of optimal solutions of the 4 representative subcases. (1) Case 1 in Scenario 1: The cyber attacker aims to maximize the total production cost for the system As shown in Table V, the optimal solution for each kind of cyber-topology attack is solved using NAA and DE, respectively. It can be clearly seen that for this case, the line-switching attack has larger impact on the system than the line-addition and line-removal attacks. Both NAA and DE algorithm find the same solution. For this case, the cyber attacker can cause at most 7.85% economic losses for the system by manipulating the status of line 10-11 from CLOSED to OPEN, and the status of lines 1-2 and 25-26 from OPEN to CLOSED. (2) Case 2 in Scenario 1: The cyber attacker aims to maximize the total purchasing fee for retailers or large customers who buy electricity from the wholesale market. Similarly, Table VI shows the optimal solution of the case 2 in scenario 1 under the three attacks, respectively. It is clear that the optimal solution is with the line-switching attack. NAA outperforms DE under the same population size and iteration time settings. For this case, the cyber attacker can cause retailers or customers to spend 49.28% more than they should, by manipulating the status of lines 10-11 and 16-21 from CLOSED to OPEN, and the status of lines 13-14 and 25-26 from OPEN to CLOSED. (3) Case 3 in Scenario 1: maximize the total purchasing fee for retailers/large customers and the total production cost simultaneously. Fig. 7 illustrates the optimized non-dominated solutions and approximate Pareto front for the case 3 in scenario 1. We can see that the two objectives have strong correlation as only 3 non-dominated solutions are found. These non-dominated solutions allow the attack to make different compromises between the two attack objectives. Here we choose the one which has the maximum sum deviation as the final decision, i.e., the one indicated by the arrow in Fig. 7. This attack
1949-3053 (c) 2017 IEEE. Personal use is permitted, but republication/redistribution requires IEEE permission. See http://www.ieee.org/publications_standards/publications/rights/index.html for more information.
This article has been accepted for publication in a future issue of this journal, but has not been fully edited. Content may change prior to final publication. Citation information: DOI 10.1109/TSG.2017.2776325, IEEE Transactions on Smart Grid
8 100 Yita NAA
(%) Yita
80
Yita DE
Target Line
60 40
0
5
10
15
20
Target line (1-23) 100 Yita NAA
(%) Yita
80
C
27.43%
DE
C
19.57%
Line 14
NAA
C
1.90%
DE
B
1.83%
NAA
C
18.13%
Yita DE
60
10-11, 16-21 10-11 10-11, 16-21 10-11, 16-21 16-21
5-6, 10-13 6-7, 13-14 12-13, 17-27 –
Sensor Falsified 106/177 105/177 106/177 104/177
2-3, 105/177 4-5 DE C 18.13% 16-21 2-3, 105177 4-5 NAA C 23.65% 10-11, 3-4, 106/177 Line 16-21 21-22 42 DE B 15.45% – 3-4, 104/177 13-14 Line-addition attack = ‘A’; Line-removal attack = ‘B’; Line-switching attack = ‘C’. Line 37
40 20 0
NAA Line 4
20 0
TABLE VII ATTACK RESULTS OF 4 SUBCASES IN SCENARIO 2 Cyber topology Algorithm Attack Type
0
5
10
15
20
Target line (24-46)
Fig. 8. Relative perturbation factor
(%) for 46 subcases in Scenario 2
increases the generator side’s production cost by 7.80%, and increases retailers/large customers’ purchasing fee by 47.27%, by manipulating line status of line 16-21 from OPEN to CLOSED and line 1-2 and 4-14 from CLOSED to OPEN. Apparently, this attack is also line-switching attack. In total, 105 out of 177 sensors need to be manipulated. (4) Scenario 2: The cyber attacker aims to cause the largest power flow deviation on targeted line which endangers system security. Scenario 2 endangers system security more when the absolute value of power flows on target lines are as large as possible in such a way to overload transmission lines. We perform simulations for all three types of cyber-topology attacks using NAA and DE. Each line is considered as a target line in this scenario. Thus, there are totally 46 subcases in scenario 2 as shown in Fig. 8, which depicts the relative perturbation factor (%) for each subcase as defined in Eq. (21). Each pair of bars in Fig. 8 represents a subcase simulated using both NAA and DE. We can see that for 18 out of 46 subcases, NAA outperforms DE; for 8 out of 46 subcases, the DE algorithm outperforms NAA; and for 20 out of 46 subcases, the NAA and DE algorithms find the same solution. Furthermore, 30 out of 46 subcases using NAA are line-switching attacks, and 34 out of 46 subcases using DE are line-switching attacks. We then randomly choose 4 out of 46 subcases as representatives to show the details. As shown in Table VII, if the cyber attacker aims to cause the largest power flow deviation on line 4, it is suggested by NAA to manipulate the status of lines 10-11 and 16-21 from CLOSED to OPEN, and the status of lines 5-6 and 10-13 from OPEN to CLOSED so that the power flow on line 4 can be increased by 27.43% at maximum. The DE algorithm recommends manipulating line 10-11 from CLOSED to OPEN, and lines 6-7 and 13-14 from OPEN to CLOSED so that the power flow on line 4 can be increased by 19.57% at maximum. Obviously, for this subcase, NAA outperforms DE in finding the optimal solution.
Moreover, for all the cases in the simulation, roughly 60% of measurements should be manipulated so as to evade being detected by TEP and BDD.
VI.
CONCLUSIONS AND FUTURE WORKS
Information security of power system faces serious threats from cyber attackers. In this paper, we propose three kinds of cyber-topology attack strategies by manipulating the transmission line connection status in the cyber layer, namely: line-addition attack, line-removal attack, and line-switching attack. Based on analysis of deviations before and after an attack, we propose two kinds of attack scenarios which aim at causing economic losses to the system and consumers, and causing security issues on transmission lines. The NAA and DE algorithms and MOEA/D are applied to solve the proposed attack models. Simulations show that the line-switching attack, not previously considered in the literature, can yield significantly greater negative impacts than either the line-addition attack or line-removal attack. More works can be conducted in future. This paper only focuses on a one-slot attack. It would be reasonable to speculate that if the cyber attacker hides for a period before launching multiple cyber-topology attacks, the losses of the power system would then accumulate. The authors are currently working on developing detection mechanisms against coordinated cyber-attacks carried out on both digital and analog data.
REFERENCES [1] [2]
[3]
[4]
A.J. Wood and B.F. Wollenberg, Power Generation, Operation, and Control, John Wiley & Sons, 2012. J. Weimer, K. Soummya and K.H. Johansson, “Distributed detection and isolation of topology attacks in power networks,” in Proc. 1st Int. Conf. on High Confidence Networked Syst., pp. 65–72, Beijing, China, 17–18 Apr. 2012. M. Kezunovic, “Monitoring of power system topology in real-time,” in Proc. IEEE of the 39th Annual Hawaii Int. Conf. on System Sciences (HICSS'06), Hawaii, USA, 4–7 Jan. 2006. K. Jain, “Security based on network topology against the wiretapping
1949-3053 (c) 2017 IEEE. Personal use is permitted, but republication/redistribution requires IEEE permission. See http://www.ieee.org/publications_standards/publications/rights/index.html for more information.
This article has been accepted for publication in a future issue of this journal, but has not been fully edited. Content may change prior to final publication. Citation information: DOI 10.1109/TSG.2017.2776325, IEEE Transactions on Smart Grid
9
[5]
[6]
[7]
[8]
[9]
[10]
[11]
[12]
[13]
[14]
[15]
[16]
[17]
[18]
[19]
[20]
[21]
[22] [23]
[24]
[25]
[26]
[27]
attack,” IEEE Wireless Comms., vol. 11, no. 1, pp. 68–71, Feb. 2004. J. Sushil, S. Noel and B. O’Berry, “Topological analysis of network attack vulnerability,” Managing Cyber Threats, vol. 5, pp. 247–266, 2005. M.A. Abdelouahab, A. Bouabdallah, M. Achemlal and S. Laniepce, “The topology change attack: threat and impact,” J. Universal Computer Science, vol. 14, no. 2, pp. 465–487, 2009. A. Ashok and M. Govindarasu, “Cyber attacks on power system state estimation through topology errors,” IEEE Power and Energy Society (PES) General Meeting, pp. 1–8, California, USA. 22–26 Jul. 2012. D.H. Choi and L. Xie, “Impact analysis of locational marginal price subject to power system topology errors,” in Proc. IEEE Int. Conf. Smart Grid Communications (SmartGridComm), pp. 55–60, Vancouver, Canada, 21–24 Oct. 2013. M.A. Rahman, E. Al-Shaer and R. Kavasseri, “Impact analysis of topology poisoning attacks on economic operation of the smart power grid,” in Proc. 34th IEEE Int. Conf. on Distributed Computing Syst., pp. 649–659, Madrid, Spain, 30 Jun.–3 Jul. 2014. E.M. Lourenço, E.P.R. Coelho and B.C. Pal, “Topology error and bad data processing in generalized state estimation,” IEEE Trans. Power Systems, vol. 30, no. 6, pp. 3190–3200, Dec. 2015. Y. Liu, P. Ning and M. K. Reiter, “False data injection attacks against state estimation in electric power grids,” ACM Trans. Information and System Security (TISSEC), vol. 14, no.1, May 2011. G. Liang, J. Zhao, F. Luo, S.R. Weller and Z. Dong. “A review of false data injection attacks against modern power systems,” IEEE Trans. Smart Grid, vol.8, no. 4, pp. 1630 – 1638, Jul. 2017. O. Kosut, L. Jia, R.J. Thomas and L. Tong, “Malicious data attacks on the smart grid,” IEEE Trans. Smart Grid, vol. 2, no. 4, pp. 645–658, Oct. 2011. Q. Yang, J. Yang, W. Yu, D. An, N. Zhang and W. Zhao, “On false data injection attacks against power system state estimation: Modeling and countermeasures,” IEEE Trans. Parallel Distrib. Syst., vol. 25, pp. 717– 729, Mar. 2014. J. Chen, G. Liang, Z. Cai, C. Hu, Y. Xu, F. Luo and J. Zhao, “Impact analysis of false data injection attacks on power system static security assessment,” J. Mod. Power Syst. Clean Energy, vol. 4, no. 3, pp. 496– 505, Jul. 2016. S. Tan, W.Z. Song, M. Stewart, J. Yang and L. Tong, “Online data integrity attacks against real-time electrical market in smart grid,” to appear in IEEE Trans. Smart Grid, DOI: 10.1109/TSG.2016.2550801. L. Xie, Y. Mo and B. Sinopoli, “Integrity data attacks in power market operations,” IEEE Trans. Smart Grid, vol. 2, no. 4, pp. 659–666, Dec. 2011. D. Deka, R. Baldick and S. Vishwanath, “One breaker is enough: Hidden topology attacks on power grids,” IEEE Power and Energy Society (PES) General Meeting, pp. 1 – 5, Denver, CO, USA. 26–30 Jul. 2015. D.H. Choi and L. Xie, “Economic impact assessment of topology data attacks with virtual bids,” to appear in IEEE Trans. Smart Grid, pp. 1–9, DOI: 10.1109/TSG.2016.2535246, Mar. 2016 J. Kim and L. Tong, “On topology attack of a smart grid,” Innovative Smart Grid Technologies (ISGT), pp. 1–6, Washington, DC, USA. 24-27 Feb. 2013. J. Kim and L. Tong, “On topology attack of a smart grid: Undetectable attacks and countermeasures,” IEEE J. Sel. Areas Commun., vol. 31, no. 7, pp. 1294–1305, Jul. 2013. X. Liu and Z. Li, “Local topology attacks in smart grids,” to appear in IEEE Trans. Smart Grid, pp. 1 – 10, DOI: 10.1109/TSG.2016.2532347. L. Jia, J. Kim, R.J. Thomas and L. Tong, “Impact of data quality on real-time locational marginal price,” IEEE Trans. Power Syst., vo. 29, no. 2, pp. 627–636, Mar. 2014. G. Liang, S.R, Weller, F. Luo, J. Zhao and Z. Dong, “Generalized FDIA based cyber topology attack with application to the Australian electricity market,” to appear in IEEE Trans. Smart Grid, DOI: 10.1109/TSG.2017.2677911. Accepted 13 Feb. 2017. J. Zhang and L. Sankar, “Physical system consequences of unobservable state-and-topology cyber-physical attacks,” IEEE Trans. Smart Grid, vol. 7, no. 4, pp. 2016–2025, Jul. 2016. X. Liu, Z. Li, X. Liu and Z. Li, “Masking transmission line outages via false data injection attacks,” IEEE Trans. Inf. Forensics Security, vol. 11, no. 7, pp. 1592–1602, Jul. 2016. Z. Li, M. Shahidehpour, A. Alabdulwahab and A. Abusorrah, “Bilevel model for analyzing coordinated cyber-physical attacks on power systems,” IEEE Trans. Smart Grid, vol. 7, no. 5, pp. 2260–2272, Aug. 2015.
[28] Z. Li, M. Shahidehpour, A. Alabdulwahab and A. Abusorrah, “Analyzing locally coordinated cyber-physical attacks for undetectable line outages,” to appear in IEEE Trans. Smart Grid, DOI: 10.1109/TSG.2016.2542925. [29] NCCIC/ICS-CERT, “Cyber-attack against Ukrainian critical infrastructure,” released 25 February 2016. [Online]. Available: https://ics-cert.us-cert.gov/alerts/IR-ALERT-H-16-056-01 [Accessed: 20 Mar. 2017]. [30] E-ISAC and SANS, “Analysis of the cyber attack on the Ukrainian power grid: Defense use case,” released 18 March 2016. [Online]. Available: https://ics.sans.org/duc5 [Accessed: 20 Mar. 2017]. [31] G. Liang, S.R. Weller, J. Zhao, F. Luo and Z. Dong, “The 2015 Ukraine blackout: Implications for false data injection attacks,” IEEE Trans. Power Syst., vol. 32, no. 4, pp. 3317 – 3318, Jul. 2017. [32] F. Luo, J. Zhao and Z.Y. Dong, “A new metaheuristic algorithm for real parameter optimization: Natural aggregation algorithm,” in Proc. IEEE Congress on Evolutionary Computation (IEEE CEC 2016),Vancouver, Canada, 24–29 Jul. 2016. [33] F. Luo, Z.Y. Dong, Y. Chen and J. Zhao, “Natural aggregation algorithm: A new efficient metaheuristic tool for power system optimizations,” IEEE Int. Conf. on Smart Grid Comms (SmartGridComm), pp. 186–192, Sydney, Australia, 6–9 Nov. 2016. [34] Q. Zhang and H. Li, “MOEA/D: A multiobjective evolutionary algorithm based on decomposition,” IEEE Trans. Evol. Comput., vol. 11, no. 6, pp. 712–731, Dec. 2007. [35] H. Lin, C. Chen, J. Wang, J. Qi, D. Jin, Z. Kalbarczyk and R.K. Iyer, “Self-healing attack-resilient PMU network for power system operation,” to appear in IEEE Trans. Smart Grid, DOI 10.1109/TSG.2016.2593021. [36] Y. Liu, R. Fan and V. Terzija, “Power system restoration: a literature review from 2006 to 2016,” J. Mod. Power Syst. Clean Energy, vol. 4, no. 3, pp. 332–341, Jul. 2016. [37] R. Storn and K. Price, “Differential evolution – A simple and efficient heuristic for global optimization over continuous spaces,” J. Global. Optimization, vol. 11, no. 4, pp. 341–359, Dec. 1997. Gaoqi Liang (S’13) obtained the B.S. degrees in automation from the North China Electric Power University, Baoding, China, in 2012. She is currently completing her Ph.D. degree in electrical engineering from the University of Newcastle, Australia. Her research interests include cyber physical system, power system security, and electricity market. Steven R. Weller (S’88–M’94) received the B.E. (Hons.I.) degree in computer engineering in 1988, the M.E. degree in electrical engineering in 1992, and the Ph.D. degree in electrical engineering in 1994, all from the University of Newcastle, Australia. During 1994–1997, he was a Lecturer in the Department of Electrical and Electronic Engineering, University of Melbourne, Australia. In 1997, he joined the University of Newcastle, where he is currently an Associate Professor and Deputy Head of the Faculty of Engineering and Built Environment. His research interests are in control theory and its applications. He was the recipient of the 2012 IET Control Theory and Applications Premium Award, and the 2017 IFAC Foundation Award. Fengji Luo (M’13) obtained the B.S. and M.S. degrees in software engineering from Chongqing University, Chongqing, China, in 2006 and 2009, respectively. He received the Ph.D. degree in electrical engineering from the University of Newcastle, Australia, in 2013. Currently, he is a research fellow at the University of Sydney, Australia. His research interests include demand side management, computational intelligence applications, and smart grid informatics. He is selected as one of the eight scientists of the “2016 Australia-Japan Emerging Research Leader Exchange Program”. Junhua Zhao (M’07–SM’17) received his Ph.D. degree from the University of Queensland, Australia. He was a senior lecture of the University of Newcastle, Australia, and also with the Center for Intelligent Electricity Networks (CIEN), University of Newcastle, Australia. Currently he is an Associate Professor with the Chinese University of Hong Kong (Shenzhen), Shenzhen, China and also with the Electric Power Research Institute, CSG, Guangzhou, China. His research interests include power system analysis and computation, smart grid, cyber physical system, electricity market, data mining and its applications. Zhao Yang Dong (M’99–SM’06–F’17) obtained his Ph.D. degree from the University of Sydney, Australia in 1999, where he was the Head of the School of Electrical and Information Engineering. He is now a Professor in the School of Electrical Engineering and Telecommunications, the University of New South Wales (UNSW). He is now a member of the ARC College of Experts.
1949-3053 (c) 2017 IEEE. Personal use is permitted, but republication/redistribution requires IEEE permission. See http://www.ieee.org/publications_standards/publications/rights/index.html for more information.
This article has been accepted for publication in a future issue of this journal, but has not been fully edited. Content may change prior to final publication. Citation information: DOI 10.1109/TSG.2017.2776325, IEEE Transactions on Smart Grid
10 Prior to joining UNSW in 2017, he was Ausgrid Chair and Director of Ausgrid Centre of Excellence for Intelligent Electricity Networks (CIEN) at the University of Newcastle, Australia. He also held academic and industrial positions with the Hong Kong Polytechnic University, the University of Queensland, Australia and Transend Networks, Tasmania, Australia. His research interest includes Smart Grid, power system planning, power system security, load modeling, renewable energy systems, electricity market, and computational intelligence and its application in power engineering. Prof. Dong is an editor of IEEE TRANSACTIONS ON SMART GRID and IEEE POWER ENGINEERING LETTERS.
1949-3053 (c) 2017 IEEE. Personal use is permitted, but republication/redistribution requires IEEE permission. See http://www.ieee.org/publications_standards/publications/rights/index.html for more information.