Agoston Petz, Justin Enderle, and Christine Julien ... {agoston, justin.enderle, c.julien}@mail.utexas.edu ...... [14] E. Jones, L. Li, J. Schmidtke, and P. Ward.
A Framework for Evaluating DTN Mobility Models
Agoston Petz Justin Enderle Christine Julien
TR-UTEDGE-2009-001
© Copyright 2009 The University of Texas at Austin
A Framework for Evaluating DTN Mobility Models Agoston Petz, Justin Enderle, and Christine Julien Mobile and Pervasive Computing Group University of Texas at Austin {agoston, justin.enderle, c.julien}@mail.utexas.edu
ABSTRACT The field of delay tolerant networking is rich with protocols that exploit node mobility to overcome unpredictable or otherwise bad connectivity. The performance of many of these protocols is highly sensitive to the underlying mobility model which determines the nodes’ movements, and the characteristics of these mobility models are not often studied or compared. With few exceptions, authors test their ideas using mobility models implemented on simulators written for the specific purpose of testing their protocols. We argue that it is better to unify these simulations to one highly capable simulator. We develop a suite of mobility models in OMNeT++ that specifically target delay tolerant networks. We also present a series of metrics that can be used to reason about mobility models independent of which communication protocols and data traffic patterns are in use. These metrics can be used to compare existing mobility models with future ones and also to provide insight into which characteristics of the mobility models affect which aspects of protocol performance. We implement a tool that derives these metrics from OMNeT++ simulations and implement several popular delay tolerant mobility models. Finally, we present the results of our analysis.
Categories and Subject Descriptors I.6.7 [Simulation Support Systems]; C.2.1 [Network Architecture and Design]: Store and forward networks
Keywords Mobility Models, Delay Tolerant Networks, OMNeT++
1.
INTRODUCTION
Delay tolerant networks (DTNs) are steadily gaining popularity in the research community for their ability to provide connectivity, or a semblance of connectivity, in “challenged” networking environments. Examples of these environments include (1) urban networks in which opportunistic meetings
Permission to make digital or hard copies of all or part of this work for personal or classroom use is granted without fee provided that copies are not made or distributed for profit or commercial advantage and that copies bear this notice and the full citation on the first page. To copy otherwise, to republish, to post on servers or to redistribute to lists, requires prior specific permission and/or a fee. SCENES 2009 Rome, Italy Copyright 2009 ICST ISBN 978-963-9799-45-5.
between cars and buses can be used to transfer messages from disconnected portions of the network to areas with Internet access [8]; (2) rural networks in which villages have reliable connectivity between local hosts but have unreliable connections to the wider world [22]; (3) networks of sensors that collect and share information about animal movement and behavior [15]; and (4) networks in which roving autonomous robots provide connectivity or message ferrying capabilities in disruption-tolerant environments [21, 3]. In all of these networks, connections appear and disappear on an unpredictable schedule, are sometimes only available for a very short amount of time, and the source and destination of any given end-to-end communication may never be directly connected. These different types of environments have their own set of challenges, and solutions have been developed for many of them. However, often these solutions are sensitive to the movement patterns of the underlying nodes and rely on a particular vision of how the mobile nodes behave. Many papers make use of the random waypoint mobility model, which is not the best interpretation of node movement since real nodes rarely behave in a completely random fashion [11, 30]. Random waypoint does have benefits: it is mathematically analyzable and easy to implement. Thus, it is easy for researchers to test their own algorithms using it, which makes results between papers comparable. In many other cases, the mobility models used in one paper are never seen again, and it is difficult or impossible to reason about how the characteristics of the mobility model would affect the performance of a different routing algorithm or protocol. Most research in the area of delay tolerant networking relies on simulation to validate ideas since real-world deployments are often either very expensive or impossible. The results of these simulations are obviously sensitive to the level of realism in the simulators, many of which do not implement a realistic radio model or networking stack. There is also an issue of cross-paper comparability—researchers often create their own simulators to test their algorithms, and it can be very difficult to compare a new algorithm with existing ones unless you implement it on a variety of simulators. In the same way, it is difficult to make use of existing mobility models. In this paper, we argue that it is important to have a standard suite of DTN mobility models that can be made available to researchers. Since we want to make it easy for others to use our mobility models and to contribute new ones, we chose to implement them in OMNeT++ [27], a widely available and capable opensource simulator. To justify this decision, we later demon-
strate that the performance of OMNeT++ for large-scale simulations is within acceptable bounds. We provide OMNeT++ implementations of several popular mobility models (Section 3). Additionally we create a statistical analysis package for OMNeT++ that greatly extends the capabilities of the simulator and provides insight into the characteristics of the mobility models independent of the overlying communication protocols (Section 4). These statistics can provide insight into how different mobility models affect ad-hoc or DTN routing algorithms and other higher layer protocols. Due to the modular nature of OMNeT++, authors of new mobility models do not have to make any changes to their code to use our statistics package and benefit from the information it provides. Finally, we provide the metrics by which different mobility models can be compared, and we present our analysis of the mobility models we implemented (Section 5). Section 6 gives future work and concludes.
2.
BACKGROUND
Related work can be divided into two categories: work on mobility models seeking to increase their realism, and work on simulators aimed at gathering information on existing scenarios to provide insight into the characteristics of mobility models and how they affect the performance of routing protocols.
2.1
Modeling Mobility
Communication in a Delay Tolerant Network is often facilitated by the mobility of the devices, as it is through their movement that initially unreachable hosts become connected. Messages are delivered to initially unreachable devices by waiting for a direct contact opportunity or by forwarding the messages between reachable devices with the aid of DTN routing algorithms. A number of the routing algorithms proposed are agnostic towards the device mobility patterns [10, 26, 29], however as the DTN community recognizes the impact of mobility on performance, a number of algorithms have been proposed that attempt to enhance delivery and network efficiency by using the non-random mobility patterns in the environment to make better routing decisions [17, 18]. With mobility dependent protocols being developed, a wide variety of mobility models have been proposed to try and capture more realistic movement patterns based on anticipated scenarios. Many of the models attempt to capture the social patterns of human mobility, while others explore transportation systems and animal mobility. Lindgren et al. [17] propose a community modeled as a set of grid positions that nodes switch between, with a home grid position assigned to each device and a central gathering grid common to all devices; nodes move primarily between home and the central gathering place. The Working Day Movement Model [7] is a more sophisticated model with many of the same ideas, while also adding a time scale to switch between sub-mobility models and locations for home, work, and evening activities. A variety of transportation methods are available between the locations as well. The Community Based Mobility Model [19] represents the social dynamics between hosts as a graph with weighted edges indicating the strength of interaction between hosts and determines movement between grid positions based on the affinity to interact with the hosts currently located there. The authors from [28] use both the Fixed Route Campus Bus Model and
Area-Based Random Waypoint Model for evaluation. The bus model simulates a network of buses traveling between fixed points on a college campus, with data transferred between buses when they are stopped at the same location. The Area-Based Random Waypoint model assigns a specific sub-area to each host within which the nodes move according to standard random waypoint mobility model with no restrictions made on how the host’s areas overlap. The Obstacle Mobility Model [11] models the obstructions that exist in the environment, and determines the paths used to move around them. The mobility patterns of zebras have been studied as well [15]. While the previous models proposed were created in an attempt to model reality, an alternate approach is to collect real world mobility statistics for a network and build models that fit the patterns observed from the collected data. Traces have been taken at a variety of locations and then used either as direct inputs for mobility to a simulation, or used to generate a synthetic mobility model matching the characteristics of the trace data [5, 31, 24]. Developing models from contact traces can be difficult, as the precision of the position and contact information collected limit the granularity in which mobility can be detected, limiting the ability to capture fine-grained mobility characteristics.
2.2
Simulating Mobility
The seminal work on comparing different mobility models with the intent of providing insight into how different models affect routing performance compared several random models with Reference Point Group Mobility, a Gauss-Markov model, a city section mobility model, and many others) [4]. However, the statistical analysis methods have not been applied to mobility models developed more recently, several of which exhibit greater degrees of realism. Baumann, et al. developed a Generic Mobility Simulation Framework (GMSF) [2] for the purpose of comparing different mobility models aimed at vehicular communication networks. GMSF is capable of exporting simulation traces to a variety of different formats such as ns-2 and Qualnet and collects a number of statistics that can be used to reason about the mobility models. GMSF can also handle a number of different radio propagation models. However, GMSF omits a number of statistics that are important to delay tolerant networks such as network partition sizes and memberships. We also note that researchers who desire to make use of GMSF’s analysis, but desire a more realistic radio model or a more capable simulator (such as ns-2, or Omnet) are then forced to run their mobility models first through GMSF, then export traces to their choice of second-stage simulator. This is not necessarily the best method since it introduces an additional dependency, and small changes to the mobility model become more cumbersome to enact. It is also uncertain how small differences in each simulator’s interpretation of node movement and radio connectivity affect the results. We argue that it is better to collect statistics for both mobility and communication in a single simulator simultaneously. Our desire to collect comprehensive statistics to characterize the differences between mobility models is by no means unique. BonnMotion [6] implements several popular mobility models including Random Waypoint, Gauss-Markov, the Manhattan Grid Model, and the Reference Point Group Mobility model and provides a comprehensive statistical analysis of each. However it is not a simulator, but rather a
trace generator and mobility model analysis tool. It would be difficult to implement any kind of routing algorithm on it, and it has a very na¨ıve uniform disk radio model. Ker¨ anen and Ott’s ONE simulator is another capable and popular DTN simulator [16]. It allows for city maps to be used to generate realistic city movement models and implements several popular delay tolerant routing algorithms. However, it does not include a realistic radio model, nor does it include any kind of network stack. DTNSim [10] and DTNSim2 [14] suffer from the same problems.
2.3
Motivation
Given the existing work on mobility models, we answer two fundamental questions that drive the remainder of the work reported in this paper. Why a networking stack? A realistic network stack is important for several reasons. First, it allows researchers to simulate real applications which expect certain transport and network protocols to be present in order to function, and thus it allows the simulator to model the interaction between higher layer protocols and the DTN. The ability to directly simulate higher layer protocols prevents researchers from making invalid assumptions about protocols’ potential behavior. Second, there is evidence that real DTN deployments will handle a mixture of TCP/IP protocols and DTN protocols and that routing in such networks will consist of a hybrid of existing ad hoc networking protocols and new DTN protocols [20]. Allowing both to coexist in the simulator is the first step to understanding their interactions. Why use OMNeT++? In our initial search for a capable simulator with native mobility support, we came across several possibilities: GloMoSim [1], ns-2 [13], ONE [16], and DTNSim2 [14]. While simulators like ONE are very fast, easy to use, and provide great support for defining mobility models based on real-world scenarios, they lack much of the functionality available in more capable simulators like GloMoSim, ns-2, or OMNeT++. While OMNeT++ by itself is not as versatile as ns-2 or GloMoSim, the inclusion of the INET framework (an optional, but fully supported add-on) makes it one of the most capable simulators. OMNeT++ with the INET framework has a full TCP/IP network stack, and our initial experience with it is very positive—it is highly modular, very powerful, and easy to use. The architecture of OMNeT++ allows users to change radio models, routing protocols, applications, and virtually any component of the simulation without recompiling. It is written in C++, and thus much of the code needed to implement new protocols in OMNeT++ is re-usable for implementing the same protocols on real nodes.
3.
SAMPLE DTN MOBILITY MODELS
In addition to the random waypoint mobility model, we implemented three DTN-specific mobility models to evaluate the mobility statistics package we developed. It is not our goal in this work to evaluate the accuracy of the models as implemented, but instead to ensure that they capture the spirit of the intended mobility patterns, and evaluate how the statistics gathered from our framework can allow these models to be compared using metrics meaningful to DTN performance.
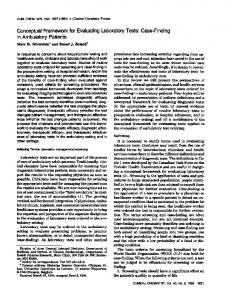
Figure 1: Village Mobility example
3.1
Zebra Mobility
Our implementation of zebra mobility is based on the ZebraNet paper [15], which gives detailed information regarding the specific mobility habits of zebras. Each zebra in the model moves independently in a landscape composed of rectangular grazing areas and watering holes. A zebra’s general movement pattern is a random waypoint search for a grazing area, interspersed with periodic trips to a watering hole. In searching for a grazing area, zebras use the roaming mode, in which they move faster and across longer distances following the random waypoint model. Once a zebra finds a grazing area, it enters grazing mode, moving slower and across shorter distances between each movement. The speed for grazing and roaming is set by a base grazing speed, with a constant speedup factor for roaming. After each movement in a grazing area, the zebra randomly decides to continue grazing or return to the roaming mode, selecting a random position among the landscape as the next destination. Each zebra has a hunger parameter, which determines the likelihood for the zebra to continue grazing. The mobility within grazing areas is modeled after observed patterns [15]. After each movement, the distance of the next movement and a change of heading angle is selected. The distribution of the distances between movements was shown to be bimodal, with the two peaks having means of 3.1 and 13 meters. This is approximated by drawing values with equal likelihood from normal distributions using the same means and a variance of 1.0. Intuitively, this means grazing movement results in either short or mid-range movements with equal likelihood. The angular change from one movement to the next is similarly drawn from a normal distribution centered at 60◦ with a variance of 1.0. All distributions are truncated to remove values less than zero, with the angular values truncated above 180◦ . Each zebra also regularly visits a watering hole by maintaining a timer that causes the zebra to move directly to a watering hole at roaming speed. After reaching the water, the zebra resumes roaming mode in search of a grazing area.
3.2
Village Mobility
A village mobility scenario consists of the villages and people who inhabit them. The villages are dispersed in the landscape, with villages below a threshold distance from each other directly connected by roads. These roads create a transportation network by which people can move between villages. Figure 1 shows an example network of villages and the movement of people between them. The circle surrounding a village represents its area; people within the village move in this circle, and the areas of nearby villages
3.3
Truncated Levy Walk Mobility
The Truncated Levy Walk model is a purely statistical model which draws values from a random distribution to determine the distance traveled and angle of movement for each new destination, as well as the pause time between 1 [24] movements. It uses a power law distribution p(l) ∼ l1+α with 0 < α < 2 to generate the flight lengths, which is a heavy-tailed distribution causing a majority of the flight lengths to be short, but with occasional long flights occurring as well. Angles of movement are pulled from a uniform distribution. Truncated Levy Walk is a type of power law distribution that has been studied extensively for animal patterns and recently has been shown to be promising as a model for human mobility [9, 24]. Our implementation is directly based on the model by Rhee et al. [24]. The primary characteristics of the mobility can be changed by varying the power law exponent, α, and the truncation factor, τ . The α parameter changes the ratio of short flights to long flights: lower values of α cause longer flights. Modifying the distribution of flight lengths greatly impacts the mobility pattern, as an increased number of long flights allows nodes to travel further in the same period of time. Figure 2 shows the cumulative distribution function of the dis-
1 0.9
alpha = 0.2 alpha = 0.5 alpha = 1.0 alpha = 1.5 alpha = 2.0
0.8 P(Displacement