A GENERALIZED METHOD TO INCLUDE SERIES COMPENSATION IN TOTAL TRANSFER CAPABILITY CALCULATION M.A. Khaburi (1), M. Jazaeri (2) (1) Sciences and Researches Branch of Azad University, Tehran, Iran (2) Semnan University, Semnan, Iran ABSTRACT Available transfer capability (ATC) is a key concept in the restructuring of electric power systems. ATC is used by system operators to determine the ability to transfer power and by system planner to indicate a system's strength. ATC calculation involves determination of TTC and two margins, TRM and CBM. Therefore, Improvement of TTC is an Important and critical topic in current deregulation environment. Firstly, in this paper, the general procedure to calculate TTC using Repeated Power Flow (RPF) method is presented. Then, the method is generalized to include series compensation to evaluate of TTC in a three-area system. Keywords: Available Transfer Capability, Total Transfer Capability, Series Compensation, Repeated Power Flow. 1 INTRODUCTION Due to large investment along with environmental and right-of-way problems, the determination and enhancement of Available Transfer Capability (ATC) are attractive topics in both regulated and deregulated power markets. The situation becomes more complex due to willingness to buy power from the cheapest seller causing some transmission corridors operate near to their limits or getting overloaded. From this viewpoint and also in order to avoid overloading, calculation of ATC has to be performed. According to NERC definition [1], ATC is the difference between Total Transfer Capability (TTC) and the sum of Transmission Reliability Margin (TRM), Capability Benefit Margin (CBM), and the Existing Transmission Commitments (ETC). Some techniques and methodologies are proposed to compute these components before calculating ATC. In fact, if the CBM, TRM, and ETC are assumed to be constant values, ATC is directly expressed by TTC. Thus, TTC is usually addressed as the basis for ATC determination [2], and is the largest amount of electric power that can be transferred from one area to another rapidly; continuously and accurately that causes no limit violations, with or without a contingency. Since transmission lines do not normally share power in proportion to their ratings, the TTC will be limited by heavily loaded lines and also buses with relatively low voltage [3]. It is now well known that Flexible AC Transmission System (FACTS) devices can control voltage magnitude, phase angle and circuit reactance, consequently they are able to redistribute the power flow and regulate bus voltage. Among FACTS controllers, the series one is the most efficient and economical to increase TTC.
Thyristor Controlled Series Compensator (TCSC) provides a series compensation component which consists of a series capacitor bank shunted by thyristor controlled reactor. With the firing control of the thyristors, it can change its apparent reactance smoothly and rapidly. ATC computing methods can be divided into static and dynamic methods. Static methods can be divided into three categories: OPF (linear and nonlinear optimization), sensitivity analysis [4], and Continuation Power Flow (CPF) [5][6]. Dynamic method is a transient stability constrained by maximum allowable transfer. This method consists of screening a large number of contingencies and scrutinizing the dangerous ones. ATC calculation involves determination of TTC and two margins, TRM and CBM. In this paper Repeated Power Flow (RPF) method is used to evaluate of TTC in a base case system [7][8]. Then, RPF method is generalized to include series compensation to evaluate of TTC. 2 ATC FUNDAMENTAL According to the NERC definition [1], ATC is determined as a function of increase in power transfer between different systems through interfaces, and ATC determination involves several parameters, TTC, CBM and TRM [1][9]. The definitions of these three parameters are given as follows. The TTC is the largest flow through the selected interface, which causes no thermal overloads, voltage limit violations, voltage collapse and/or any other system security problems, such as transient stability [9].
UPEC 2007 - 1199
The TRM is the reserved capability that accounts for uncertainties related to the transmission system conditions, contingencies and parameter values [10]. The CBM is the amount of transmission transfer capability reserved by load serving entities to ensure access to generation from interconnected systems. Among these parameters, TRM and CBM are the factors that account for the uncertainty and reliability in the power system [9][10]. The TTC and ATC can be expressed as: TTC = min {thermal, voltage, stability limits} ATC = TTC − TRM − ETC − CBM Where ETC is existing transmission commitment. These concepts are illustrated in Figure 1.
Figure 2 Model of transmission line compensated with TCSC This method does not improve the voltage profile but makes the line appear much shorter, electrically. Series compensation is used to improve stability limits and increase transfer capabilities [12]. 3.2 Compensation with Thyristor Controlled Phase Shifter Transformer Thyristor Controlled Phase Shifter Transformer (TCPST) can be modeled by a phase shifter transformer with control parameter α .
Figure 3 Model of transmission line compensated with TCPST Figure 3 shows a line compensated by a Thyristor Controlled Phase Shifter Transformer, located at the sending end Busbar. The voltage from the phase shifter, VPS, is adjustable in phase and magnitude. The action of the phase shifter is to inject a voltage such that generator voltage, VG, and the receiving end busbar voltage, VR, are kept at an angle that gives the maximum power transfer along the line.
Figure 1 ATC concepts 2.1 Single linear step ATC The single linear step approach is the most common ATC method. This method of ATC analysis uses only information about the present system state and sensitivities about the present system state. These sensitivities are embodied in power transfer distribution factor (PTDF) calculations [11]. A power transfer distribution factor is a measure of the sensitivity of a flow to an injection or extraction at a given location. There are two types of PTDFs: operating point dependent, which come from the load flow, and traditional PTDFs, which are derived from the dc power flow model. We use operating point dependent type of PTDF in this paper. 3 SERIES COMPENSATION 3.1 Compensation with Thyristor Controlled Series Capacitor Static model of Thyristor Controlled Series Capacitor (TCSC) is used in this paper. TCSC can be seen as a series reactance with control parameter XTCSC. Figure 2 shows the line with TCSC.
Thyristor Controlled Phase Shifter Transformer can inject a voltage with a controllable phase angle and/or magnitude under no-load and load conditions [12]. Note that the phase shifter does not increase the maximum power transfer capability of the line, but in the simple model allows the maximum power transfer to occur at any generator angle. However, the main application of phase shifters is to control the power flow distribution in a network and thereby prevent circuit overloading. One significant difference between Thyristor Controlled Phase Shifter Transformer and Thyristor Controlled Series Capacitor is the cost. Whereas the cost of Thyristor Controlled Series Capacitor varies with XTCSC, the cost of the Thyristor Controlled Phase Shifter Transformer is constant and depends only on the capacity of the circuit where the device is installed. 4 RPF FORMULATION Repeated power flow (RPF) method enable transfers by increasing the complex load with uniform power factor at every load bus in the load (buyer) area and increasing
UPEC 2007 - 1200
the injected real power at generator buses in the generation (seller) area in incremental steps until limits are incurred.
4.1 Generalized RPF Formulation with TCSC The generalized formulation of TTC using RPF with TCSC can be represented as follows:
The mathematical formulation of TTC using RPF can be expressed as follows:
Maximize λ Subject to:
Maximize Subject to:
n
λ
PGi − PDi −
j =1 n
n
PGi − PDi −
∑ Ui .Uj .(Gij ( X TCSC ). cos δij + Bij ( X TCSC ). sin δij ) = 0
∑ U i . Uj .( Gij . cos δ ij + Bij . sin δ ij ) = 0
QGi − QDi −
∑ Ui .Uj .(Gij ( XTCSC ). sin δij − Bij ( X TCSC ). cos δij ) = 0 j =1
j =1 n
QGi − Q Di −
∑ U i . Uj .( Gij . sin δ ij − Bij . cos δ ij ) = 0
Ui min ≤ Ui ≤ Ui max
j =1
Sij ≤ Sij max
Ui
≤ Ui ≤ Ui
min
max
− 0.5. X Line ≤ X TCSC ≤ 0.5. X Line
S ij ≤ S ij max
Where: λ : Scalar parameter representing the increase in area's load or generation.
Where: XTCSC : reactance of TCSC Gij(XTCSC), Bij(XTCSC) : real and imaginary part of the ijth element of bus admittance matrix when TCSC is installed. They are functions of XTCSC.
λ = 0 Corresponds to no transfer (base case) and λ = λmax Corresponds to the maximum transfer. In the above power flow equations, PGi (generator real output in generation area), PDi (real load in load area) and QDi (reactive load in load area) are as following: PGi = PGi o .(1 + λ.k Gi ) PDi = PDi o .(1 + λ.k Di )
5 CASE STUDY A three-area system was used to explore the various options for computing TTC. Each area consists of generation stations, substations, and internally connected transmission lines that may define an individual electric system, power pool, control area, subregion, or region as shown in Figure 4. Each area is connected by a tie line. Base power is 100 MVA. The base case data for the system are as follows.
Q Di = Q Di o .(1 + λ.k Di )
Where: PGio : Original real power generation at bus i which is in generation area PDio, QDio : Original real and reactive load demand at bus i which is in load area kGi, kDi : Constants used to specify the change rate in generation and load as λ varies. TTC level in each case (normal or contingency case) is calculated as follows: TTC =
∑ PDi (λmax ) − ∑ PDi o
i∈Load Area
i∈Load Area
Figure 4 A three-area system
Where:
∑
PDi (λ max ) : i∈Load Area
when
Sum
of
load
at
load
area Area #
λ = λmax
∑ PDi o : Sum of load at load area when λ = 0
i∈Load Area
UPEC 2007 - 1201
1 2 3
Table 1: Areas data Generation Load (MW) (MW) 1500 1500 600 600 800 800
Voltage (PU) 1 1 1.04
All line resistances are zero and there are no shunt elements.
means that line 1-3 is limiting line on transaction between area 2 and area 1.
Table 2: Tie lines data X S Line # (PU) (MVA) 1-2 0.9 100 2-3 0.28 100 1-3 0.37 100
We now consider increase of TTC (from area 2 to area 1) with series compensation of system. Naturally, the line with less loading and more unused capacity rather than other lines must be compensated. In this system, line 1-2 has capability of compensation. Because line 1-3 is full load in base case and compensation of line 2-3 is led to overloading of line 1-3 and exceeds line limit.
The transaction under study was from area 2 to area 1. This means that, area 2 is Generation (Seller) area and area 1 is load (Buyer) area. This was implemented by an increase in generation at area 2, with the real power being reduced automatically by the swing generator at area 1. The base case had zero real power flow on all lines at the initial operating point. When the generation at area 2 was increased by 10 MW (causing a 10 MW transfer from area 2 to area 1), the real power flow on the lines became:
5.1.1 Effect of TCSC In the method, reactance of line 1-2 decreases using thyristor controlled series capacitor (TCSC) as shown in Figure 5 and caused to increase of power flow in line 1-2 and also decrease in flows of lines 1-3 and 2-3. Consequently, there is no limit in line 1-3.
P2-1= 4.1 MW P2-3= 5.9 MW P3-1= 5.9 MW These flows provide a set of values for the real power distribution factors for each line as 41% in line 2–1, 59% in line 2–3, and 59% in line 1–3 on the base of 10 MW. PTDF 2-1: 41% PTDF 2-3: 59% PTDF 3-1: 59%
Figure 5 Compensated system with TCSC
From the ratings of the lines, extrapolation of the transfer using power transfer distribution factors (PTDFs) to the line limits gave three transfer limits: - Line 2-1: S2-1 / PTDF2-1 = 100MVA / 0.41 = 244MW - Line 2-3: S2-3 / PTDF2-3 = 140MVA / 0.59 = 237MW - Line 1-3: S1-3 / PTDF3-1 = 130MVA / 0.59 = 220MW The minimum of these values is 220 MW, making this the linear estimate of the Total Transfer Capability (TTC) from area 2 to area 1. When the generation at area 2 was increased to simulate the transfer, an increase of 203 MW brought line 1-3 to its 130 MVA limit. This means that the TTC under these conditions is 203 MW rather than the predicted 220 MW. 5.1 Impact of Series Compensation on TTC The limiting element of this system (for increase of TTC from area 2 to area 1) is line 1-3. Since power transfer distribution factors (PTDFs) of transmission lines, loading of line 1-2 is less than line 1-3 and 2-3; and power flow of these two lines are equal together.
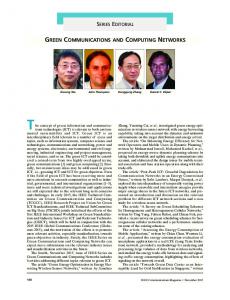
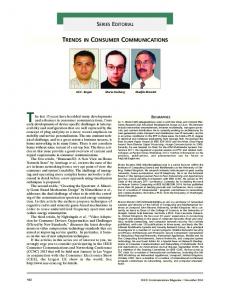
Compensation is performed in different levels and the results are shown in Graph 1. It is seen that, variation of thyristor controlled series capacitor reactance from 0.05 to 0.12 (1.11%-13.32% compensation), is led to increase of TTC from 803 MW to 815 MW and then variation of series capacitor reactance from 0.14 to 0.22 (14.43%-24.42% compensation), led to decrease of TTC from 815 MW to 803 MW. 5.1.2 Effect of TCPST Now, instead of TCSC, a TCPST is installed on line 1-2 that shifts the phase from 0o to -8o. In this variation range of phase, TTC increases from 803 MW to 812 MW (about 1.12 %). Then, more shift from -9o to -12o caused to decrease of TTC from 812 MW to even less than 803 MW of base case that is not considerable. Results are shown in graph 2. If TCPST was installed on line 2-3 or 1-3, shift of phase from 0o to +8o and from +9o to +12o, caused to same results.
This implies that, one of these two lines is limiting element which is line with less thermal limit. This
UPEC 2007 - 1202
Graph 1- TTC variations when the percentage of compensation is changed via TCSC
Graph 2- TTC variations when the phase of compensation is shifted via TCPST
6. CONCLUSIONS ATC calculation involves determination of TTC and two margins, TRM and CBM. Improvement of TTC is an Important and critical topic in current deregulation environment. The TTC is limited usually by heavily loaded circuits and buses with relatively low voltage. The general procedure to calculate TTC using Repeated Power Flow is presented and generalized in this paper.
TCSC and TCPST are two main commercially available FACTS Devices. This paper for the first time presents the formulation of TTC calculation using TCSC based on RPF. The effects of TCSC and TCPST are studied and demonstrated with a three-area test system. The results showed that both TCSC and TCPST can enhance TTC. It is seen that, TCSC is more effective than TCPST in increasing TTC. 7. REFERENCES
On the other hand, it is well known that FACTS devices can control voltage magnitude, phase angle and circuit reactance, so it can redistribute the load flow and regulate bus voltage. Therefore, it is now necessary to investigate the effect of FACTS devices on the TTC.
1. “Available Transfer Capability Definitions and Determination”, NERC report, June 1996. 2. Mohamed Shaaban, Yixin Ni, Felix F. Wu, "Available Transfer Capability Evaluation by Decomposition", IEEE Summer Meeting Proceeding, June 2001.
UPEC 2007 - 1203
3. Y.Xiao, Y. H. Song, Y. Z. Sun, "Application of Stochastic Programming for Available Transfer Capability Enhancement Using FACTS Devices", IEEE Power Engineering Society Summer Meeting, July 2000, Vol. 1, Pages: 508-515. 4. Ejebe GC, Waight JG, Santos-Nieto M, Tinny WF. Fast calculation of linear ATC. IEEE Trans Power Syst 2000; 15(3):1112–6. 5. P. Kundur, Power System Stability and Control, McGraw-Hill, New York, 1993. 6. Taylor CW. Power system voltage stability analysis. New York: McGraw-Hill; 1994. 7. G. C. Ejebe, J. Tong, and J. G. Waight. etc., “Available Transfer Capability Calculations,” IEEE Trans. Power Systems, vol. 3, No. 4, pp. 1521-1527, Nov. 1998. 8. Y. Ou, and C. Singh, “Improvement of Total Transfer Capability using TCSC and SVC,” in IEEE PES Summer Meeting, vol. 2, 2001, pp.944948. 9. “Total Transfer Capability”, NERC report, May 1995. 10. "Transmission Capability Margins and Their Use in ATC Determination", NERC report, June 1999. 11. R.D. Christie, B.F. Wollenberg, I. Wangensteen, Transmission management in the deregulated environment, Proc. IEEE 88 (2) (2000) 170–195. 12. N. G. Hingorani and L. Gyugyi, Understanding FACTS, concepts and technology of flexible ac transmission systems. New York: IEEE, 2000. Corresponding Author MOSTAFA JAZAERI EEEng Dept. SEMNAN UNIVERSITY SEMNAN IRAN
[email protected]
UPEC 2007 - 1204