nd
Reprinted from Proceedings of the 2 World Congress on Nature and Biologically Inspired Computing (NaBIC 2010), Kitakyushu, Japan, 2010. Do not redistribute.
A Genetic Algorithm System for Product Line Exploration and Optimization Christopher N. Chapman
James L. Alford
Microsoft Corporation Redmond, Washington, USA
[email protected]
Blink Interactive Seattle, Washington, USA
[email protected]
Abstract - We report development and industrial application of a genetic algorithm (GA) model to find near-optimal product portfolios for marketing management. This GA model uses consumer preference information that is typically available from marketing studies such as choice-based conjoint (CBC) analysis and other discrete choice model projects. Because a single result might capitalize on chance, the system does not simply find one optimal portfolio but instead allows individuallevel and model-level bootstrapping of results. Examination of the resulting distribution of near-optimal portfolios is informative for strategic insight and generation of market hypotheses. We describe application of the GA model in a personal computer accessory product line for a major manufacturer using CBC data from N=716 respondents. The distribution of portfolio results suggested that the manufacturer’s actual product line was potentially much larger than optimal and was missing two products that might be highly desired by consumers. Finally, we review the underlying computer code and its options. The model provides multiple methods of determining individual preference for the GA model along with various adjustable parameters. Keywords: Genetic algorithms; conjoint analysis; portfolio optimization; marketing; product line management.
I. INTRODUCTION We propose an evolutionary computation framework to investigate product line optimization for applied industrial usage in marketing research. This framework is designed to allow marketing researchers to explore the makeup of a near-optimum product line to meet consumer demand within a product category, and to answer questions about the composition of the product line and the expected return from increasing or decreasing the number of products in the line. The framework can be applied to a category as a whole across firms, to the question of optimization with one firm’s product line, or in perhaps the most interesting case, to the optimization of a firm’s product line with regards to competition. Line optimization and the closely related area of portfolio optimization have received substantial work in several fields: engineering and manufacturing, operations management, and finance portfolios. [1]-[4]. However, such work has been limited in its usefulness for strategic marketing because the search process has often attempted to find a single optimum portfolio [5][6]. The search for single best candidates is appropriate when the search system has
extensive knowledge about the candidate products and a strong model of the distribution of portfolio parameters (as is the, for instance, with financial securities), but it is questionable when the product parameters are not fixed across the market but vary according to individual response and may be dependent on the respondent sample. In the area of marketing research, Belloni et al [6] have demonstrated that stochastic and heuristic search algorithms such as genetic algorithms (GA) and simulated annealing are able to find near-optimal product line solutions. Their work was limited in several ways. Their model attempts to find a single “optimum” portfolio given a data set. However, real data sets include error from several sources (sampling, estimation, and so forth) and any single solution may be unique to that data set. A given solution reflects components of a well-fitting model along with error sources, and thus may change with resampling or re-estimation. We develop an extension of their model to explore the distribution of likely near-optimal candidates rather than to attempt to find a single best solution. From a review of the marketing research literature, it appears that the present paper is a unique application of an iterative, distributional model of a GA applied to portfolio optimization in marketing research. The approach is not new from an algorithmic perspective, but we believe it is a novel industrial application of evolutionary computation in marketing research and product management. From a managerial perspective, the distributional approach is more useful than a simple imperative action (i.e., “make this best portfolio”) because it provides a breadth of information about portfolios, which a firm may use to make strategic decisions and to construct hypotheses about potential product gaps. We consider this approach as serving to identify hypotheses about product line composition and potential product opportunities. We have adopted several goals that serve to make this distributional framework useful for applied marketing research applications. Our process uses data from a relatively commonly available source: multinomial logit model parameters, which may be obtained from methods such as discrete choice models (DCM) and choice-based conjoint analysis (CBC). The model is implemented in the R environment, using freely available code from the community [7][8], and the present authors that may be adapted to a specific project with modest customization. Finally, as detailed below, our model has a number of
options and adjustable parameters (with sensible defaults) so an analyst may choose among various options that are appropriate for a given project and product category. In following sections we present (a) the formal model and required data, (b) the search procedure, (c) an example of its application to a specific project, with managerial implications, (d) a brief discussion of the computer code and its parameters, and (e) discussion and directions for future research. II. FORMAL MODEL The strategic questions we address are: (1) as a product line portfolio increases in size, what is the expected marginal increase in consumer demand that is met with each additional product? (2) Given a set of potential products, which products are the best candidates that a firm should consider for a product line, if the firm wishes to maximize the degree to which consumer demand is met? We base our model on standard assumptions of conjoint analysis (CA) models [9][10]. Formally, our model is composed of several basic components defining products and product interest. We will use the category of automobiles to explain each part of the model A product is represented as a set of specific attributes (such as “engine type” and “mileage per gallon”, where each attribute is present in a product at some specific feature level (such as “Gas combustion engine”, “Hybrid gas/electric engine”; “10 km per liter”, “20 km per liter”, etc.) Discrete product composition is a standard assumption of CA models. Although the mathematics are not difficult, we present them in detail here in order to ensure that the model is clear, and that readers who are unfamiliar with discrete choice models may see how they function. In short, a product (Px) comprises a set of attributes (A): *
+
(1)
Each attribute i comprises a set of feature levels (Fij): *
+.
(2)
Typically, a product has exactly one feature level for each attribute but that is not a general requirement. Individual preference strength or utility of a product is expressed as the sum of numerical part worth utilities across each of its feature levels; again this is a standard CA assumption. For instance, the utility of an automobile for a given individual is the sum of the separate utility values associated with its engine type, gas mileage, and so forth. Each respondent has a strength associated with each feature. In this additive, or compensatory, model, positive preference for one feature (such as hybrid engine) may counteract the negative value of others (such as the automobile’s maker). The utility (U) of a product is the sum of the utilities of its vectors of features (F) across attributes (i):
(
)
∑
( ).
(3)
Individuals’ part worth utilities may be estimated through procedures such as hierarchical Bayesian modeling of preferences revealed in choices among products in a randomized survey, as is typical with CBC [11][12]. Our procedure is agnostic as to the source of part worth utilities as long as they are interpretable at an individual level. Preference share for each among a set of products is expressed by the multinomial logit (MNL) rule, where preference for a product is proportional to the natural antilog of its utility (i.e., eutility) compared to those of all products being considered [9][13]. Preference for product Pi in set P is the share of Pi among the sum of all products’ antilog utilities: (
|*
+)
(
∑
) (
)
.
(4)
We assume here that the optimization goal is to maximize consumer preference across a given set of products, such that as many consumers as possible find at least one product that is desirable within the set. It would be possible to maximize other quantities such as the total revenue or profit from a product line, but those are straightforward extensions of the preference share model, and generally reduce simply to weighting the product utilities by some other function that reflects pricing or similar transformations. When one’s goal is to maximize preference under the logit model – with or without pricing weights – a problem immediately arises. By definition, the summed preference share for all products is precisely 1, exactly because share is calculated relative to the set of products being considered. Thus, in an optimization procedure that searches for a “best” product line under the logit rule, every possible product set will always have a total relative preference of 1. There are several strategies to address this problem; we consider two such strategies here. First, one might compare the set of products to the value of outside good, aka the preference for people to choose “none” instead of any product. Some standard CA models provide such an estimate although its precise meaning is unclear [14]. We refer to the none option to discuss this parameter. It is operationalized through a total utility denominator that includes the utility of the product set and also the estimated utility of the “none” option. Second, one might optimize only a subset of the complete product list while holding another part constant. For instance, one might wish to find the set of products that maximizes relative preference compared to a competitor’s fixed product line. In this case, the summed utility of the target product line is bounded by [0, 1] and may vary within that range. Putting all of this together, our algorithm for product line optimization attempts to find a set of products {P} that is a
list of products, each comprising a list of feature levels with discrete values: * + *
* *
+ + +.
(5)
The optimization goal is to maximize the total preference share across the list of non-fixed products, i.e.: (∑
( ))
(6)
where preference shares are estimated in accordance with (4), given a set of products that includes both a variable portion to be optimized plus a fixed portion that is held constant and not included in the determination of overall preference. The fixed portion may include a “none” product, a list of competitive products, or both. In terms of the automotive example, this set P would be a list of fully-specified automobile models and their features. The variable portion (P1… Pn) would be supplemented by the definition of a fixed list of competing models, or by inclusion of the none option as an indicator of the likelihood that an individual would choose to purchase none of the models. With the problem in this format, namely when there is a list of discrete levels that are evaluated with a single optimization function, the problem becomes straightforward to investigate using a genetic algorithm (GA) [15]. This closely matches the approach used by Belloni et al [6]. However, a GA is stochastic and observed respondent data is never perfect. Therefore we believe it is often preferable not to search for a single best solution but rather to consider the problem to be one of characterizing the distribution of potential solutions. Understanding this distribution may be especially informative for product strategy. III. METHOD We applied the GA model to investigate a portfolio of personal computer (PC) accessory products produced by a major manufacturer. The product is confidential but was modeled with a total of 8 attributes including price. There were 7 levels for price and 2-4 feature levels for other attributes. After omitting impossible feature combinations, there were 1080 combinations, i.e., 1080 uniquely specified products. The number of portfolios scales combinatorically as a function of the number of possible unique products (NofProducts) and the number of products being included in the target portfolio (K): ( (
) )
.
(7)
The number of portfolio combinations rapidly becomes very large when there are many possible products. For any substantial portfolio size, an exhaustive search of possible portfolios may be impossible; for instance, with 1080 unique products and K=10 products in the portfolio, there are 1080!/1070!/10! combinations, or approximately 6x10²³ potential portfolios to consider for exhaustive search. While there is no a priori expected structure to the problem space and no expectation of large-scale gradient structure, the space is unlikely to be completely unstructured because of similarity expected from the MNL model of product preference. Because individual utilities are formed by summing across attribute part worths, changing one feature does not affect the utility from other features. Thus, there will be local similarity among neighboring products that differ on a single feature, and this similarity can be expected generally to decrease with hamming distance as more features are varied. With no expected analytic global solution, but a structured model for potential solutions, a single fitness function, and some degree of local structure, the problem should be a good candidate for a GA or other stochastic search algorithm. Respondent preference for various product features was assessed using an online choice-based conjoint (CBC) analysis survey [12][16] with N=716 respondents, administered through a third-party market research panel to adult PC users in the United States. The CBC survey implemented a randomized design to assess the attribute and feature structure noted above, plus estimation of the none option in a dual response format [14][16]. Respondents’ part worth utilities for features, including the none option, were estimated using a hierarchical Bayesian (HB) approach [11][12][14][17]. Main effects (not interactions among levels) were estimated. For the purposes of this study, we used individual level mean estimates from the HB procedure, but the portfolio model could optionally use a series of HB draws instead of respondents’ mean values. Given the individual level preferences, we then iterated a GA where the population comprised lists of products, each consisting of a list of features, as in (5). The GA objective function was to maximize total preference share of the portfolio vs. preference for “none,” as in (6). The product brand was fixed to the manufacturer of interest. The GA was iterated multiple times under the following procedure. First, 60% of respondents were sampled to use as training cases for the GA. Then the GA was run to yield a near-optimal solution for a given portfolio size K, with parameters as shown in Table 1. Because we were looking only for the distribution of near-optimal results, we used a moderate number of generations in each GA run. The maximum number of generations (50) was set on the basis of several preliminary runs in which we inspected improvement up to 500 generations, and determined that substantial improvement rarely occurred after 50 generations. Population size was established similarly.
TABLE 1 GENETIC ALGORITHM PARAMETERS
Population size Genome structure Maximum generations Stop if not improved: Elitism Mutation types Crossover types
400 Vector of integers (cf. (5)) 50 after 10 generations Yes Uniform mutation; boundary mutation; non-uniform mutation [8] Simple 1-point crossover; heuristic crossover [8]
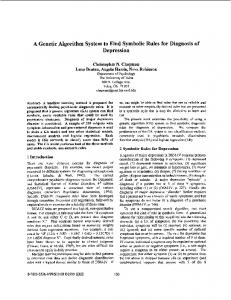
To address the strategic questions posed above, we inspect the distribution of results. Specifically, to examine the strategic question of marginal increase in consumer demand met as portfolio size increases, we may simply inspect a plot of preference share met vs. the portfolio size. (One may also conduct statistical tests or more sophisticated analyses, if desired). To explore areas in which there may be unmet product opportunities, we inspect the number of times that a single product combination (i.e., one specific list of feature levels) occurs across many portfolios. When a product often occurs in near-optimal portfolios but is not currently part of the product line, it may indicate a product opportunity. IV. RESULTS A. Preference share by portfolio size The distribution of total preference share by portfolio size is shown in Figure 1, indicating both the median result and the 95% distribution of observed results across 50 GA runs at each portfolio size. The results show that for the given product category, a single best product satisfies the preference of approximately 67% of respondents (when compared to the choice to select “none”). This total preference share increases moderately quickly to about 78% with K=6 products in the portfolio, and then rises slowly with additional products beyond K=6. This suggests that – considering only the product features modeled here and the ability to make a near-optimal portfolio – consumer demand is met relatively well with approximately 6 products. The expected marginal gain from having more than 6 products in the line is small, with approximately 0.002 - 0.005 total preference share gained for each additional product above K=6.
Total preference share vs. "none"
Mutation and crossover types were selected to use all available types in the GA library [8] that were suitable for the present data structure (e.g., when genes have differing discrete ranges and cannot be exchanged across positions but must be crossed-over or mutated within boundaries). After GA optimization on the training set, the final preference share was determined for the 40% validation sample of respondents. This entire procedure was iterated 50 times each for various portfolio sizes, K = (1,2,4,6,8,10,12,16,20). This yielded a distribution of expected results at each portfolio size and across the range of portfolio sizes.
0.90 0.85 0.80 0.75
2.5%'ile
0.70
Median
0.65
97.5%'ile
0.60 1
2
4
6
8 10 12 16 20
Portfolio size k (number of products) Fig. 1. 95% range of observed preference share on validation cases for near-optimal portfolios as a function of portfolio size.
B. Product distribution and opportunities Table 2 shows the products that appeared in at least 20% of all near-optimal portfolios. It shows fully-specified products (dummy coded for feature levels) and the proportion of time they appeared at all – with any degree of preference share for validation respondents – in nearoptimal portfolios. (We counted only appearance in portfolios with K≥4 products, for a total N=800 portfolios). Among 1080 possible products (feature combinations), only a small number of products appeared repeatedly, and thus those products may deserve particular consideration for portfolio inclusion. Among the products that appear repeatedly in portfolios and are listed in Table 2, products 1 and 5 differ on only a single feature. Products 3 and 6 (shown in bold) appeared in 22-45% of portfolios, but are not currently available from the manufacturer or its competitors. The features that differentiate those products are the combination of feature level “2” on attributes 2 and 6 as shown in the strings lists in Table 2. TABLE 2 MOST COMMONLY APPEARING PRODUCTS ACROSS PORTFOLIOS (UNPRODUCED PRODUCTS IN BOLD)
1
Proportion of all portfolios (N=800, K≥4) 0.76
Feature codes (excluding price) 2111112
2
0.47
1311512
3
0.45
3211422
4
0.26
1121512
5
0.23
2111111
6
0.22
3211122
7
0.21
3111412
V. DISCUSSION The results suggest that the product line under investigation – if composed of an optimal mix of products – could meet a large part of consumer demand with
approximately K=6 products. However, the manufacturer’s actual retail product line at the time contained more than K=20 products. The present analysis suggests that product line may have been too large. We view these results as informing hypotheses that the line may be inefficient in size or that it comprises a non-optimal mix of products. It is also possible that there were important product features missing from the present CBC model that would have indicated a larger number of products needed, had those features been included in the analysis. The present analysis simply assumes that the correct features were studied (based on prior knowledge); determining otherwise would require additional research that is outside the scope here. The results suggest not only that K>20 products was too many for this category, but also that the actual portfolio was missing one or more highly desired products (products 3 and 6 in Table 2). Another implication of the results is that some products may need only minor differentiation from others, as was shown by products 1 and 5 in Table 2, which differed on a single feature. This suggests potential product groups that may benefit from engineering optimization (e.g., to manufacture the group of products with as many overlapping components as possible). It may also indicate areas in which the product management team could consider differentiation on bases other than those included in the core product features (for instance, to differentiate the products through packaging). The results of the present study were shared with the manufacturer and led the product management team to engage in two efforts. First, the team sought to rethink the portfolio composition and reduce its size where possible. The manufacturer ultimately decided to launch fewer new products in the category and clarified the value proposition of others. Second, the product team investigated the products that were identified as specific opportunity gaps (products 3 and 6 in Table 2). This included additional work to identify the size of the potential market opportunity and the effort needed to produce those products. This analysis has also been used to direct additional research into whether the attributes studied were in fact the most important attributes. This can be done in various ways. For instance, one might use the method here with additional data sets, using different attributes, to investigate the generalizability of the results. For instance, if the results of the portfolio analysis appear to be markedly unusual, it may suggest that previously supposed preference factors are not well understood, and identify areas for new research or deeper consumer understanding. Thus, the GA model may be useful to identify potential weaknesses in strategic understanding of a category when its results diverge from managerial expectation.
VI. DESCRIPTION OF COMPUTER CODE The present computer code uses the base R system [7], the rgenoud R package [8], and a modest amount of custom code that is available from the first author. Application of the model to a new problem or dataset requires updating the custom code to fit the attribute & feature model of one’s specific data set, and to ensure that prohibitions in the fitness function are correct. In addition to the model outlined above, the code has several advanced options. It can use Bayesian model draws (if supplied as data) instead of individual-level mean part worth estimates, with optional multiple draw sampling and averaging for each respondent. It is possible to use a “none” parameter or to include a fixed set of competitive products (or both). The part worth data may optionally be tuned to a scale factor other than unity, if the analyst has reason to believe that the raw part worths are not indicative of real preference sensitivity. Finally, the code is able to use various preference estimation functions (first choice preference, share of preference, etc.) that assist with findings that are robust to “independence from irrelevant attributes” (IIA) issues [18][19][20]. GA models are computationally intensive and the model may take a long time (days or weeks on a typical PC workstation) to complete bootstrap runs. However, the rgenoud package provides options to scale the GA model to multi-core or multi-machine infrastructure [8]. VII. FUTURE WORK There are many avenues for future work. One very interesting path would be to investigate the stability, reliability, and predictive validity of the estimates obtained. Researchers have previously shown that CA models can yield reliable and predictive results [23] but it is unknown whether there are special conditions that affect those models’ stability under the sampling and bootstrapping that occurs in a GA model. For instance, it is plausible that some assumptions of utility estimation methods (such as multivariate normality of expected population utilities or assumptions about utility error structure) would pose unforeseen problems when used in a GA process. It would be of great interest to study the extent to which GA portfolio results are sensitive to various assumptions used to generate the underlying preference data. Another question is whether concerns about IIA issues are actually significant for the GA model and which preference estimation approach is most appropriate (shareof-preference, first choice, roulette, or something else). For the present time, a reasonable practical strategy may be for the analyst to choose the IIA method that appears to be most suitable for a given product category on theoretical bases, run a bootstrapped GA as described above, and finally to check inferences from that GA against a small set of GA runs that use different IIA assumptions.
There are various models for portfolio estimation other than a CA + GA approach, e.g., in quantitative finance [4][24]; the present model could be compared with those approaches. The GA model presented here is a straightforward extension of CA concepts that may appeal to marketing researchers, but it is unclear what may be the relationship between the GA results and those from other estimation traditions. Another idea is to pair the GA model with a game theoretic approach where the model would consider the likely competitive response to a proposed new portfolio, and then the reciprocal response to the competitor, and so forth. This could be merged into an evolutionary game framework [25]. Finally, the authors wish to complete a formal R package that would reduce the analyst’s reliance on custom code and formalize the interface to that code. VIII. CONCLUSION We successfully defined and demonstrated a GA system that be used with common conjoint analysis data to investigate questions of product portfolio composition. Because this model inspects the distribution of likely portfolio results, it should be more robust and is more informative for strategic decisions than a single “best answer.” The procedure described here can suggest whether a portfolio is sized inappropriately, and can suggest potential products that may be missing from a product line portfolio. We view the results as yielding hypotheses rather than indicating immediate actions. The results are highly salient for managerial discussion and product line strategy. The process described here has been used to inform strategy at a major consumer products manufacturer. There are many avenues for future exploration in both theory and application of evolutionary algorithms to industrial marketing strategy. Additional work in this area appears likely to make substantial theoretical and practical contributions to the fields of applied computing and marketing management. ACKNOWLEDGMENT The authors thank two anonymous NaBIC reviewers for their helpful feedback and ideas. We presented related work at the 2010 Sawtooth Software Conference and thank the attendees of that conference for insightful comments, especially Ken Deal of McMaster University and Bryan Orme of Sawtooth Software. Finally we thank colleagues at Microsoft Corporation for support and insight. REFERENCES [1] S.S. Rao, Engineering Optimization:Ttheory and Practice, Wiley, 2009. [2] S.S. Chaudhry and W. Luo, “Application of genetic algorithms in production and operations management: a review,” Int. J. Production Research, vol. 43, 2005, pp. 4083–4101. [3] C.A. Coello, G.B. Lamont, and D.A. Van Veldhuizen, Evolutionary Algorithms for Solving Multi-objective Problems, Springer-Verlag, 2007.
[4] J.M. Steele, Stochastic Calculus and Financial Applications, Springer, 2000. [5] K.D. Chen and W.H. Hausman, “Mathematical properties of the optimal product line selection problem using choice-based conjoint analysis,” Management Science, vol. 46, 2000, pp. 327–332. [6] A. Belloni, R. Freund, M. Selove, and D. Simester, “Optimizing product line designs: Efficient methods and comparisons,” Management Science, vol. 54, 2008, pp. 1544–1552. [7] R Development Core Team. R: A language and environment for statistical computing [Computer software]. Version 2.11.0. R Foundation for Statistical Computing, Vienna, Austria, http://www.Rproject.org, 2010. [8] W.R. Mebane, Jr., J.S. Sekhon. Genetic Optimization Using Derivatives: The rgenoud Package for R. [R package], http://sekhon. berkeley.edu/rgenoud/, 2009. [9] J.J. Louviere, D.A. Hensher, and J.D. Swait, Stated Choice Methods: Analysis and Applications, Cambridge Univ. Press, 2000. [10] P.E. Rossi, G.M. Allenby, and R. McCulloch, Bayesian Statistics and Marketing, Wiley, 2006. [11] P.J. Lenk, W.S. DeSarbo, P.E. Green, and M.R. Young, “Hierarchical Bayes conjoint analysis: Recovery of partworth heterogeneity from reduced experimental designs,” Marketing Science, vol. 15, 1996, pp. 173–191. [12] Sawtooth Software. CBC/HB 5.0 [Computer software.] Sequim, WA, 2010. [13] J. Hausman and D. McFadden, “Specification Tests for the Multinomial Logit Model,” Econometrica, vol. 52, Sep. 1984, pp. 1219-1240. [14] T.J. Gilbride and G.M. Allenby, “Estimating heterogeneous EBA and economic screening rule choice models,” Marketing Science, vol. 25, 2006, p. 494. [15] D.E. Goldberg, Genetic Algorithms in Search, Optimization, and Machine Learning, Addison-Wesley, 1989. [16] Sawtooth Software. SSI/Web 7.0 [Computer software.] Sequim, WA, 2010. [17] G.M. Allenby and P.J. Lenk, "Modeling Household Purchase Behavior with Logistic Normal Regression," J. American Statistical Association, 89, 1994, pp. 1218-1231. [18] G. Debreu, “Review of RD Luce, Individual choice behavior: A theoretical analysis,” American Economic Review, vol. 50, 1960, pp. 186–88. [19] D. McFadden, “Econometric models for probabilistic choice among products,” J. Business, 1980, pp. 13–29. [20] P. Lenk, J. Dotson, J. Brazell, T. Otter, S. Maceachern, and G.M. Allenby, A Probit Model with Structured Covariance for Similarity Effects and Source of Volume Calculations, Working paper, Fisher College of Business, Ohio State University, 2009. [21] T. Elrod, J.J. Louviere, and K.S. Davey, “An Empirical Comparison of Ratings-Based and Choice-Based Conjoint Models,” J. Marketing Research, vol. 29, Aug. 1992, pp. 368-377. [22] L. Tierney, A.J. Rossini, N. Li, H. Sevcikova. snow: simple network of workstations. [R package.] http://cran.r-project.org/web/packages/ snow/ index.html, 2008. [23] C.N. Chapman, J.L. Alford, C. Johnson, M. Lahav, and R. Weidemann, Comparing results of CBC and ACBC with real product selection. Proceedings of the 2009 Sawtooth Software Conference, Del Ray Beach, FL, March 2009. [24] R. Korn and E. Korn, Option Pricing and Portfolio Optimization: Modern Methods of Financial Mathematics, American Mathematical Society, 2001. [25] H. Gintis, Game Theory Evolving: A Problem-centered Introduction to Modeling Strategic Behavior, Princeton Univ. Press, 2000.