A genetic network programming model for portfolio optimization by generating risk-adjusted trading rules Akbar Esfahanipour
Maryam Tayari
Assistant Professor, Department of Industrial Engineering and Management Systems, Amirkabir University of Technology, Tehran, Iran
[email protected]
Master of Science in Industrial Engineering, Garmsar Branch, Amirkabir University of Technology, Tehran, Iran
[email protected]
Abstract— Genetic network programming (GNP) as an evolutionary computation method has been used for stock trading recently. Former researches confirm the efficiency of trading rules which are created by GNP. In this paper, GNP has been applied for stock portfolio optimization by generating risk-adjusted trading rules. There are two main novelties in this paper: 1) we use conditional Sharp ratio as a risk-adjusted measure for generating trading rules, 2) in our GNP model, binary trading rules have been extended to more realistic rules which are called trinary rules using three signals of buy, sell and no trade. We applied our GNP model on ten stocks from Tehran Stock Exchange (TSE). The numerical results show that our proposed model with three signals outperformed the previous model with two signals of buy and sell in terms of excess return and excess risk adjusted return.
Keywords: genetic network programming; portfolio optimization; technical trading rules; risk-adjusted measures; Tehran Stock Exchange (TSE)
I.
INTRODUCTION
Evolutionary Computation is well-known for producing the solutions in optimization problems. Genetic Network Programming (GNP) is an extended method of Genetic Algorithm (GA) and Genetic Programming (GP). It has been clarified that GNP is an effective method mainly for dynamic problems since GNP represents its solutions using graph structures. Compact structures and implicit memory functions are some of inherent characteristics of GNP's graph structure that contribute to creating effective action rules [1]. In this paper, we intend to describe a model of stock portfolio optimization which has two important novelties relative to the previous studies. First, using risk adjusted measure as a fitness function, second, using three signals
in generating trading rules instead of forcing model to use only two signals. The foundation of portfolio optimization was laid by Markowitz in 1959, where he proposed a mean-variance optimization model. He states that investors should decide the allocation of their investment on the basis of a trade-off between risk and expected returns [2].Although there are many nonlinear constraints in the real-world problems, evolutionary computation methods were developed to solve these kinds of problems. Genetic algorithm (GA) is a heuristic search method inspired by nature which has been applied to financial problems. GA as the most popular heuristic optimization techniques was developed by Holland in 1975 [3]. Lin et al. solved the model of portfolio selection problem through taking into consideration the multi-objective genetic algorithm [4]. Oh et al. proposed a new portfolio selection algorithm based on portfolio beta using GA [5]. Xia Lau Yang applied GA method with a dynamic portfolio optimization system to improve the efficiency of the stock portfolio [6]. Chang et al. introduced a heuristic approach to portfolio optimization problems in different risk measures using GA [7]. Genetic programming (GP) has been developed by Koza in 1992 for the first time as an extension of GA [8]. The main difference between GP and GA is the representation of the solutions. In GP, the population members are not fixed length character strings that encode possible solutions to the problem at hand, they are programs that, when executed, are the candidate solutions to the problem. These programs are expressed in genetic programming as parse trees rather than as lines of code [9]. Although GP is widely used in the financial field, it occasionally causes some bloating problems for its tree structure. GP has been applied for stock trading model by
www.iiec2014.com
Potvin et al. in 2004 [10]. Esfahanipour and mousavi proposed a GP model to generate risk-adjusted technical trading rules in stock market [11]. Genetic Network Programming (GNP) is an extended method of GA and GP [1] that is applied in financial fields recently. Since GNP represents its solutions using graph structures, which contributes to creating quite compact programs and has implicit memory function, it has been clarified that GNP is an effective method mainly for complicated problems such as portfolio optimization systems [12]. GNP was used for stock trading by Mabu et al., Chen et al, and Hirasawa et al. In 2008, Chen et al. extended a model of GNP with reinforcement learning for generating trading rules on stock market using the stock prices of sixteen stocks of Tokyo stock market [13]. They also extended a portfolio optimization model using GNP with control nodes (GNPcn) in 2009. Since GNP has a directed graph structure, the aim of GNPcn is to improve the performance of GNP by extending the evolutionary method in terms of breadth and depth of searching procedure [14]. In 2010, Chen et al. extended a model of portfolio optimization using time updating GNP which can adapt to the change of stock prices and market conditions [12]. These approaches are essentially referred to technical analysis since it determines the timing of buying and selling stocks based on the technical indices such as Relative Strength Index (RSI) and Rate of change (ROC). These studies use sum of the profit of trading in terms of the difference between selling price and buying price as fitness for evolution [12, 13, 14]. Despite the attractiveness of these works, they did not consider transaction cost for evaluating fitness of generated rules. Transaction cost is brokerage fees that are payable for each trade carried out. Since many trades take place in the buy and sell strategy, transaction cost would affect the profitability of trading rules. Some other parameters that have effect on return such as dividend and splits are also important to consider in the fitness function. In our proposed model, we consider these issues in the fitness function by using a risk adjusted return measure named conditional sharp ratio which uses conditional value at risk (CVaR) as an appropriate coherent risk measure. In our proposed GNP model, binary trading rules have been also extended to more realistic rules which are called trinary rules using three signals of buy, sell and no trade. Additionally, we have included transaction costs, dividend and splits in our GNP model for calculating more accurate returns. We use Importance Index (IMX) [13] as a pattern for evaluating of technical indexes in our GNP model for efficient stock trading model. Here, GNP is used to select appropriate actions as buying, selling, and no trade. This paper is organized as follows: In section 2, the structure of GNP is described; in section 3, the proposed GNP model is explained; in section 4, the computational results of applying our model on the portfolio of 10
Iranian companies are reported, and finally the paper closes with conclusion. II.
GENETIC NETWORK PROGRAMMING
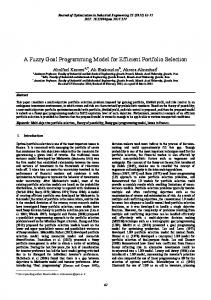
In this section, the structure of GNP method is explained. The traditional GNP is composed of a start node, judgment nodes and processing nodes, which are connected to each other. Fig. 1 shows a basic structure of GNP. Judgment nodes have if-then type branch decision functions, which return judgment results for assigned inputs and determine the next node. Processing nodes take buying and selling actions for the stock trading. While judgment nodes have conditional branches, processing nodes have no conditional branches. Start node is used to determine the first node to be executed, which has no functions and no conditional branches. Once GNP is booted up, the execution starts from the start node, then the next node is determined according to the connection from the current activated node [1]. A. Basic Structure of Genetic Network Programming with control nodes (GNPcn) In conventional GNP, the current node is not compulsorily transferred to the start node and there is no terminal node in GNP. Therefore, once GNP is booted up, the successive activation of GNP system is carried out according to the network flow until the time limit. Since the current node is not compulsorily transferred to the start node, there is a possibility that some of the nodes are not used. GNPcn starts from a control node, and the current node is transferred back to one of the control nodes after executing a certain number of processing nodes. Consequently, the performance of GNPcn improves because the increase of the number of control nodes contributes to search a solution space widely and then to find many distinguished trading rules [14]. Especially, the number of the control nodes can be considered as breadth of the search of GNP, while the number of processing nodes activated per control node can be considered as depth of the search of GNP [15]. GNPcn is also useful to solve the portfolio optimization model because of its ability to solve the multi-brands problem. In this paper, the number of control nodes is fixed and the number of processing nodes activated per control node is evolved.
Fig. 1. Basic structure of GNP.
Fig. 2 shows the basic structure of GNPcn. GNPcn has several control nodes, judgment nodes and processing
www.iiec2014.com
nodes. GNPcn uses one of the groups of control nodes for one stock, so that GNPcn could deal with multi-stocks. When GNPcn deals with brand (or stock) ‘‘A”, GNPcn starts its node transition from control node ‘‘ ”, and the current activated node returns to one of the control nodes ( , ,…, successively after transiting m processing nodes from the last control node. GNP has two kinds of time delays: 1) time delays on judgment or processing nodes, 2) time delays on nodes transition. The genotype expression of GNP node is also shown in Fig. 1. This figure describes the gene of node i, then the set of these genes represents the genotype of GNP individuals. Concretely speaking, represents the node type, 0 means start node, 1 means judgment node, and 2 means processing node. represents an identification number of the node function. In judgment node, the gene shows a technical index that GNP judges and in processing node, the gene shows actions that an agent can take such as buying, selling and no trade. is a parameter which represents the threshold for determining buying or selling stocks in a processing node. The role of judgment nodes, processing nodes and their functions are explained in section 4. , , … show the node number of the next node. Judgment node determines the upper suffix of the connection genes to refer to depending on the judgment result. is the time delay spent on the judgment or processing at node i, while , , … are time delays spent on the node transition from node i to the next node. If the judgment result is and . Processing nodes always ‘‘B”, GNP refers to and since they have no conditional branches. refer to Similar to other evolutionary algorithms, crossover and mutation are used as the genetic operators of GNP. The steps of evolution are as follows [12, 14]: 1. Initialize the first population and calculate the fitness of the population. 2. Generate new individuals for the next generation by tournament selection and genetic operators. 3. Calculate the fitness of the new individuals. 4. Repeat steps 2–3 until the terminal condition meets.
Fig. 2. The basic structure of GNPcn.
B. Genetic operators of GNPcn In this subsection, the genetic operators of GNPcn are described as follows. Crossover: Crossover is executed between two parents and generates two offsprings. The procedure of crossover is as follows. (1) Select two individuals using tournament selection twice and produce them as parents. (2) Each node is selected as a crossover node with the probability of . (3) Two parents exchange the genes of the corresponding crossover nodes. (4) Generated new individuals become the new ones of the next generation. If GNP exchanges the genes of judgment nodes, it must exchange all the genes with suffix A, B, C ... simultaneously [1]. Mutation: Mutation is executed in one individual, and a new one is generated. The procedure of mutation is as follows. (1) Select one individual as a parent using tournament selection. (2) Mutation: there are four types of mutations which are selected in random with equal probabilities as follows. o Change connection: Each node branch ( , , …) is selected with the probability of , and the selected branch is reconnected to another node. o Change node function: Each node function ( ) is selected with the probability of , and the selected function is changed to another one. o Change node number: The number of processing nodes activated per control node (m) is changed to the other value with the probability of . o Change parameters: each or in node i is changed to the other value with the probability of . (we explain about in section 4 ) (3) Generated new individual becomes the new one of the next generation. III.
THE PROPOSED GNP MODEL
Previous studies generated binary trading rules, i.e. they could only indicate two signals of buying or selling for trading decisions. Sometimes, do nothing is the optimal decision in real world decision making. Hence, no trade can be an optimal decision in stock trading, which is not indicated by binary trading rules. Therefore, we have extended the structure of previous trading rules to trinary ones which can produce three signals of buying, selling and no trade. A. Extending GNP model to three signals When the current activated node i is a judgment node, the corresponding function ( ) is one of the technical indexes. In this paper, we use four technical indexes named relative strength index (RSI), rate of change
www.iiec2014.com
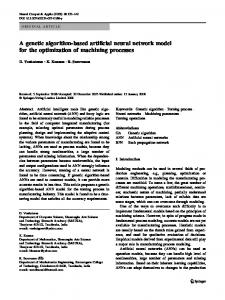
(ROC), volume ratio (VR) and stochastics. Each technical index has its own judgment function. As an example the judgment function of Rate of Change (ROC) is shown in Fig. 3, where x axis shows the value of each technical index and y axis shows the importance index (IMX) output of the judgment function which is used at a processing node. Importance index tells GNP whether or not the buying or selling signals are likely to appear at the current day. Chen et al., use these importance index functions in their studies on stock market for generating trading rules [13]. The shape of Importance Index functions is fixed in our research based on the knowledge of the real stock market. We use the IMX function of the related studies.
Fig.3. Importance index (IMX) as Judgment functions of ROC [13].
When we are going to make a decision of selling or buying stocks (in binary trading rules model), we use only one technical index in each judgment node, so the node gene of judgment nodes contains , , , and . is a threshold connection gene contains , , , for technical index value that shows the judgment result. For example, if the judgment node i judges the Rate of Change and the value of this rate is more than , judgment result becomes A and otherwise B. This parameter ( ) is randomly determined at the beginning of the first generation, and changes appropriately by evolution. But one of the most important points in our study is that we do not force the node to make the decision in only two manners, buying or selling because there is also another way in stock trading model named no trade which is optimal decision in some situations. Therefore, we have extended the structure of previous trading rules to trinary ones which can produce three signals of buying, selling, and no trade. In our trinary trading rules model, we use two technical indexes in each judgment node, so the node gene of each , , , , , , judgment nodes contains and connection gene contains , ,…, , . is the threshold for the value of the first technical index and is the threshold for the value of the second technical index, and are time delays spent on primary and secondary technical index, respectively. For example, if and the value of the first technical index is more than the value of the second technical index is more than , the judgment result is A. Fig.4 shows a judgment node structure based on the value of two technical indexes.
Fig.4. Judgment node structure in our proposed model
In binary signals (buy and sell) model, when the current node is a processing node, the computation is based on one technical index in each judgment node from the previous processing node to the current processing node. However, in our study in a processing node, we have two computations based on: 1) the first importance indexes (IMXs) obtained at the judgment nodes executed in the node transition from the previous processing node to the current processing node, 2) the second importance indexes (IMXs) obtained at the judgment nodes executed in the node transition. Fig. 5 shows structure of a processing node our trinary signal model.
Fig.5. Processing node structure in our trinary signal model
When the current node at time t is a processing node, the following process will be done: is the threshold for determining buying or 1) selling stocks in models with two signals (Buy and Sell) and in this paper with three signals (Buy, Sell and No trade). 2) Calculate an average of the IMXs obtained at the judgment nodes executed in the node transition from the previous processing node to the current processing node by using equations 1 and 2. ′ ∑′ ′ (1) ′ ′
∑′ ′
′
′
(2)
shows a set of suffixes of the Where, judgment nodes executed in the node transition from the previous processing node to the current ′ processing node. shows an IMX output ′ . at node ′ 3) Determine the action (buying, selling or no and the trinary trade). After calculating
trading rule signal is determined according to Table 1. 4) Transfer to the next node from the current node. TABLE 1. The way for determining of signals using trinary trading rules Trading rule signal True
True
True
False
False
True
False
False
Buy No trade No trade Sell
At1 and At2: average IMXs of the first and the second technical indexes ai1and ai2: thresholds for determining the actions from technical indexes
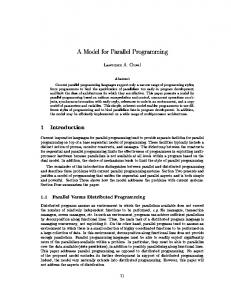
B. Determining of traning and testing periods Since the data in stock markets are time-varying and changing every minute, we use kind of GNP method named time adapting genetic network programming (TAGNP) which considers the time-related fluctuation of stock prices well. In the traditional GNP method, individuals are evolved using the initial data of stock prices in a single period, and then the best GNP individual in the last generation of the training period is used for all future trading in the testing period. As shown in Fig. 6, this method uses recent historical data for training with a fixed data window shift in each iteration [12].
Fig.6. comparison between GNP and TA-GNP [12].
C. Applying risk-adjusted measures for fitness function Risk adjustment is very important and the most important reason is that these measures make it possible for us to compare different investment opportunities with different levels of expected returns and risks. There are a lot of risk adjusted measures to adjust return for risk.
Among the investigated risk adjusted measures, here the conditional Sharpe ratio is selected to apply in our GNP model. Conditional Sharpe ratio is the ratio of the expected excess return over risk free rate and its conditional value at risk (CVaR). This ratio can be calculated by the Eq. (4): Conditional Sharpe ratio = (4) Where r is the return of the fund, is risk free rate; CVaR1-α is the conditional value at risk over the given time horizon with 100(1-a) % confidence level. CVaR is the expected loss under the condition that the value at risk is exceeded. The reasons behind selection of the conditional Sharpe ratio as a suitable risk-adjusted measure in our GNP model are as follows: (1) it uses CVaR as downside risk measure; (2) it uses CVaR which is an optimal coherent risk measure [16]; (3) it is a suitable measure for evaluation of assets with non normal and fat tailed distributions of return [17]; and (4) this measure includes the subjective risk aversion of an investor through confidence level selection [18]. In this model, the excess risk adjusted return is evaluated as fitness function. Since we included transaction costs, dividend and splits in the fitness function of our model, it is expected that the more realistic returns will be computed. The risk adjusted return of the buy and hold strategy ( & ) is calculated with conditional Sharpe ratio as Eq. (5). & (5) & Where & is the expected return of the buy and hold strategy. It is calculated considering dividends, splits and is calculated as Eq. (6). transaction costs. (6) Where X is the profit/loss of the stock over a given risk is the worst expected loss over the horizon and given time horizon at 1 confidence level. is usually approximated via historical simulation method. The cumulative return for a trading rule in a period is the sum of all transaction returns considering dividends and splits minus the related transaction costs. In risk adjusted version of our model, the cumulative risk adjusted return for a trading rule is the sum of risk adjusted returns of all transactions in the period and is calculated as Eq. (7). ∑ (7) & Where n is the number of transactions in the period advised by trading rule, is the return of th transaction considering dividends, splits and transaction cost. The fitness function is simply calculated as Eq. (8), where & is the risk adjusted return of the generated trading rule (i.e., the buy and sell strategy). (8) & &
www.iiec2014.com
IV.
APPLICATION OF OUR GNP MODEL FOR IRANIAN COMPANIES
Our extended genetic network programming model has been applied on Ten Iranian Companies listed on Tehran Stock Exchange (TSE). We intend to examine the profitability of our trading rules and their risk adjusted excess returns in these companies. TABLE 2. Investigated Iranian companies in this study Activity sector Motor vehicles and auto parts Motor vehicles and auto parts Motor vehicles and auto parts Refined petroleum products & nuclear fuel Chemicals & byproducts Chemicals & byproducts Chemicals & byproducts Electric machinery & apparatus Banking Pharmaceuticals
Company Iran Khodro Industrial Group
Symbol
Saipa Co.
SIPA1
Pars Khodro Co.
PKOD1
Behran Oil Co.
NBEH1
Arak Petrochemical Co.
SHARAK1
Abadan Petrochemical Co.
SHPETRO1
Khark Petrochemical Co.
SHKHARK1
Jooshkab Yazd Ind. Co.
JOSH1
EN Bank SobhanPharmacutical Co
VNOV1 DSOB1
IKCO1
A. Data Ten Iranian companies listed on Tehran Stock Exchange (TSE) have been chosen for testing of our GNP model. Since Esfahanipour et al., in 2009, obtained better rules for companies having frequent trading in the market [19]; we also select companies with the highest liquidity for testing our GNP model. For this purpose, ten active companies with the highest liquidity in the recent years have been selected in different activity sectors. Selected companies and their sectors have been shown in Table 2. Transaction cost is 0.515 percent of trade volume for buying and 1.0665 percent of trade volume for selling the stocks in TSE according to TSE’s regulation. The historical data includes the dividend and splits adjusted closing price and transaction volumes for each working day (Research and Development Islamic Studies, 2009; Tehran Securities Exchange Technology Management, 2009). We use the data of the stock market from September 22, 2008 to September 21, 2012 in the simulations. Our data is divided into two groups: training data and testing data. B. Parameter settings Some of the best parameter settings for our GNP are determined through the related studies [12, 13 and 14] as well as our preliminary experiments. Table 3 shows average of fitness function values with different setting of time windows. According to Fig. 6, Time Adapting GNP can adapt to the change of stock conditions with time windows. Thus, we test different periods and shifts of the windows to obtain the optimal
values, where the ‘‘window shift’’ in Table 3 indicates the shifting period of data windows. From the results, it is obvious that the best fitness value obtains when window size is 180 days and window shift is 20 days. We use the related work for determining the range of window size and window shift. TABLE 3. Average fitness value of portfolio with different setting of time windows [day]. Widow size 360 180 120 90 30 6.987 7.014 6.901 6.215 Window shift 20 6.513 7.229 6.348 7.595 10 6.328 6.968 6.812 6.751
Table 3 shows when window size is large, the window shift with higher value shows better results, and when window size is smaller window shift with smaller value, shows better results. In fact, it seems there is a mutual relation between window size and window shift. Other parameters of this model are shown in table 4. Our GNP model uses judgment nodes which judge the technical indices. There are four judgment functions which are the four selected technical indexes. The number of processing function is three: buy, sell and no trade. Four control nodes are assigned to each stock. The functions of each node are determined randomly at the first generation, and then changed by evolution. The initial connections between nodes are also determined randomly at the first generation. TABLE 4. Parameter setting for our GNP model Population size 300 Number of generation 500 Number of judgment nodes 15 Number of processing nodes 6 Number of control node 40 Selection method Tournament Mutation rate 0.03 Crossover rate 0.2 CVaR confidence level 95%
C. Results Genetic Network programming model is applied on the portfolio of the ten mentioned Iranian companies. We divided our simulation into two groups, first, riskunadjusted models and second, risk-adjusted models. The trading rules were generated over the training period for the portfolio. In each group (risk adjusted and risk unadjusted), Model 1 is the portfolio optimization by generating binary trading rules from historical data and Model 2 is the portfolio optimization by generating trinary trading rules from historical data. The results of implementing risk-unadjusted models on the portfolio of 10 stocks in Tehran Stock Exchange are shown in table 5. In this table, returns of the buy and hold strategy (B&H), cumulative returns of trading rules (B&S) and excess returns of trading rules over the buy and hold strategy are presented for each model in column 2-4 of table 5, respectively.
www.iiec2014.com
TABLE 5. Returns of GNP models in risk-unadjusted basis. B&H (%) B&S (%) Excess return (%) Model 1 67.359 73.8642 6.5052 (2 signals) Model 2 67.359 90.0047 22.6457 (3 signals)
From table 5, we can see the excess return for model 2, which generates three signals, is greater than model 1, which generates two signals of buying or selling stocks. The results of trading rules with risk-adjusted returns are presented in Table 6. TABLE 6. Returns of GNP models in risk-adjusted basis B&H (%) B&S (%) Excess return (%) Model 1 8.284 13.0265 4.7425 (2 signals) Model 2 8.284 15.8796 7.5956 (3 signals)
Although portfolio optimization model based on generating trading rules were profitable in all cases, we can observe that excess risk adjusted return in model 2 (generating trading rules with three signals) that we proposed in this paper is more profitable than the first model. V.
CONCLUSION
In this paper, a genetic network programming (GNP) model has been developed in order to optimize a stock portfolio by generating technical trading rules. A GNP model has been developed considering the risk importance in trader’s decision making and the effect of transaction cost, dividends and splits on transaction returns. Trading rule’s structure is also extended to three signals, including buy, sell and no trade. For the risk adjusting of our model, risk adjusted returns are used to evaluate fitness of the generated trading rules. Among many risk adjusted measures which were reported in the literature, conditional Sharpe ratio has been selected in our model because of its less assumptions and more accuracy in risk measurement. We carry out the simulation by using stock data of 10 Iranian companies in Tehran Stock Exchange (TSE) in four years. We implemented our model in risk-adjusted case and also in risk-unadjusted case. Numerical results show that extending model to three signals has a significant effect on the trading rule generating model. Our extended GNP model shows more efficiency than previously used model with only two signals of buying or selling stocks. Our GNP model is also appropriate for an investor who doesn’t want to consider risk for generating trading rules.
REFERENCES [1] Mabu S, Hirasawa K, Hu J. A graph-based evolutionary algorithm: Genetic network programming and its extension using reinforcement learning. Evolutionary Computation 2007; 15(3):369–398. [2] Markowitz H. Portfolio selection: Efficient diversification of investments. New York: Wiley; 1959 [3] Holland JH. Adaptation in natural and artificial systems: an introductory analysis with applications to biology, control and artificial intelligence. University of Michigan Press; 1975. [4] Lin D, Wang S, Yan H. A multiobjective genetic algorithm for portfolio selection problem. In: Proceedings of the ICOTA 2001, Hong Kong. [5] Oh KJ, Kim TY, Min SH, Lee HY. Portfolio algorithm based on portfolio beta using genetic algorithm. Expert Systems with Applications 2006;30(3):527–534. [6] Yang X., Improving portfolio efficiency: a Genetic Algorithm Approach, Computational Economics, Springer Link, 28(1), (2006), 1-14. [7] Chang T, Yang S, Chang K. Portfolio optimization problems in different risk measures using genetic algorithm. Expert Systems with Applications 36 (2009) 10529–10537. [8] Koza JR. Genetic programming, on the programming of computers by means of natural selection. Cambridge, MA: MIT Press; 1992. [9] Abraham, A., Nedjah, N., &Mourelle, L. M. Evolutionary Computation: from Genetic Algorithms to Genetic Programming. In J. Kacprzyk (Ed.).Studies in computational intelligence (SCI), Genetic systems programming 2006 (Vol. 13, pp. 1–20). Berlin Heidelberg: Springer Verlag [10] Potvin J, Soriano P, Vallee M. Generating trading rules on the stock markets with genetic programming. Computers & Operations Research 2004;31(7): 1033–1047 [11] Esfahanipour A, Mousavi S. A genetic programming model to generate risk-adjusted technical trading rules in stock markets. Expert System with Application 38(2011) 8438-8445 [12] Chen Y, Mabu S, Hirasawa K. A model of portfolio optimization using time adapting genetic network programming. Computer & Operation Research 37 (2010) 1697-1707 [13] Chen Y, Mabu S, Shimada K, Hirasawa K. Trading rules on stock markets using genetic network programming with sarsa learning. Journal of Advanced Computational Intelligence and Intelligent Informatics 2008;12(4): 383–392. [14] Chen Y, Ohkawa E, Mabu S, Shimada K, Hirasawa K. A portfolio optimization model using genetic network programming with control nodes. Expert System with Application 36 (2009) 10735-10745 [15] Eto S, Mabu S, Hirasawa K, Huruzuki T. Genetic Network Programming with Control Nodes considering Breadth and Depth. SICE Annual Conference 2007. 470-475 [16] Inui, K., & Kijima, M. (2005). On the significance of expected shortfall as a coherent risk measure. Journal of Banking & Finance, 29 , 853–864. [17] Agarwal, V., &Naik, N. Y. (2004). Risk and portfolio decisions involving hedge funds. Review of Financial Studies, 17(1), 63–98. [18] Acerbi, C., &Tasche, D. (2002). On the coherence of expected shortfall. Journal of Banking & Finance, 26, 1491–1507. [19] Esfahanipour A., Karimi B., Mousavi S.; "The Profitability of Technical Trading Rules in Tehran Stock Exchange: An Application of Genetic Programming"; International Symposium on Innovations in Intelligent Systems and Application; 2009.
www.iiec2014.com