A GENETIC PROGRAMMING APPROACH FOR COFFEE CROP RECOGNITION J. A. Santos, F. Faria, R. Calumby, R. da S. Torres
R. A. C. Lamparelli
RECOD Lab – Institute of Computing University of Campinas Campinas, SP, Brazil {jsantos,fabiof,rtripodi,rtorres}@ic.unicamp.br
Center for Research in Agriculture University of Campinas Campinas, SP, Brazil
[email protected]
ABSTRACT This work presents a new approach for automatic recognition of coffee crops in RSIs. The method applies an approach based on Genetic Programming (GP) to combine texture and spectral information encoded by image descriptors. Experiments show that the proposed method yields slightly better results than the traditional MaxVer approach. 1. INTRODUCTION The use of Remote Sensing Images (RSIs) as a source of information in agrobusiness applications is very common. In these applications, it is fundamental to know how the space occupation is. However, some crop type regions recognition in remote sensing images is not a trivial task yet. The place or the age of the crops, for example, may hinder the recognition process. In these cases the spectral response and the texture patterns to the same kind of crop can be different. A crop can be planted in different ways and this factor, allied to the different phases of the plants, tends to create a distinction between regions of the same class. Problems of land use in mountainous terrain have been reported for a long time. On the other hand, at the same time, efforts have been made to solve these problems. Holben and Justice [1], for example, have examined the spectral band rationing to reduce the topographic effect on remote sensing images. Peddle and Franklin [2] used textural aspects and integration of data for discrimination of surface different patterns. Baban and Yusof [3] used remote sensing and ancillary for the mapping of land use/cover distribution on a mountainous tropical island as well as Dorren et. al. [4] have studied forest in mapping in same relief conditions that Baban and Yusof using object-based classification and both reached good results. Other works taking into account prior probabilities such as Pedroni [5] improved the accuracy of forest types classification, but we can observe that results settle specific problems not adaptable to other conditions. Coffee mapping is inserted in later context because it is planted in mountain relief and generaly very close to forest areas. There is a lack Thank to FAPESP, CAPES, CNPq and Microsoft Research for funding.
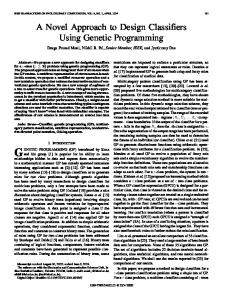
of works with focus on this theme as state Cordero-Sancho and Sader [6]. Further, the authors studying accuracy classification in coffee crops just achieved a better classification when have considered the use of Landsat Tm bands and ancillary data rather than the classification using just red, nearinfrared and mid-infrared TM bands. In this case the accuracy reached 56% and it agrees with Langford and Bell (1997) that reported a maximum 58% of overall accuracy showing most mixing between coffee plantation and young/mature woodland. This work aims to present a new approach based on successful information retrieval techniques to automatic recognition of coffee crops in RSIs. This method applies an approach based on Genetic Programming (GP) to combine texture and spectral information by using image descriptors. A descriptor can be characterized by two functions: feature vector extraction and similarity computation. The feature vectors encode image properties, like color, texture, and shape. Therefore, the similarity between two images is computed as a function of their feature vectors distance. Genetic programming (GP) [7] is a machine learning technique based on the theory of evolution and is used in various applications. This strategy was motivated by recent works in content-based image retrieval that achieved good results applying GP to combine successful image descriptors. 2. THE GP-BASED CLASSIFICATION APPROACH The proposed approach can be divided into two main phases: (i) the image description and (ii) image classification. The image description concerns the image content characterization and is performed off-line. First of all, images are selected and inserted into the system (step 1 in Figure 1). Next, this image is partitioned into several tiles (rectangular subimages) – step 2. Finally, descriptors are used to extract texture and spectral image properties (step 3). The image classification process includes steps 4, 5, 6 and 7 in Figure 1. The process of identifying relevant partitions is performed by using GP to combine the similarities provided by descriptors. Each tile is considered as an independent image and this process starts by the indication of relevant sam-
Fig. 1. Steps of the proposed classification process. ples (step 4). These samples are assumed to present the same texture and spectral properties as the RSI regions which are of interest. A pattern recognition using GP is performed and all subimages are labeled (step 5). This process is described in details in subsection 2.1. After the subimages are classified, the next step concerns the segmentation of relevant regions (step 7). The segmentation process of the image is performed by using a watershed-based algorithm [8]. This algorithm segmentats images using seeds. The seeds are defined as the areas of interest identified in the last step. This paper has to do with the first 5 steps depicted in Figure 1, that is, the partition/extraction of image features and classification of the sub-images of coffee. 2.1. GP-based Classifier As mentioned before, the GP framework is used to determine new similarity functions based on the combination of previously defined image descriptors. For the image classification problem, a good similarity function, i.e., a similarity function with a high accuracy value 𝐹 , is one that, when applied to an tile 𝐼𝑖 of class 𝐶, ranks images from class 𝐶 at first positions, that is, they are considered as the most similar to 𝐼𝑖 . The overall classification framework is ilustred in Algorithm 1. Steps 1 and 2 concern the training process within GP which intend to discover good similarity functions for each class. However, the discovered functions can only be used to calculate the similarity between two images. In order to evaluate the performance of those functions in the classification task, we used a strategy based on a nearest neighbor classifier. This classifier assigns a category label to a test image, based on the categories of the 𝑘 most similar images in the training set. The most widely used algorithm was introduced by Yang [9] and is referred to, in this work, as kNN. The kNN
was chosen since it is simple and makes a direct use of similarity information obtained by the GP Framework. In the kNN, to a given test image 𝑑 is assigned a relevance score 𝑠𝑐𝑖 ,𝑑 associating 𝑑 to each candidate category 𝑐𝑖 . This score is defined as: ∑ 𝑠𝑖𝑚𝑖𝑙𝑎𝑟𝑖𝑡𝑦(𝑑, 𝑑′ )𝑓 (𝑐𝑖 , 𝑑′ ) (1) 𝑠𝑐𝑖 ,𝑑 = 𝑑′ ∈𝒩𝑘 (𝑑)
where 𝒩𝑘 (𝑑) is the 𝑘 most similar images of 𝑑 in the training set and 𝑓 (𝑐𝑖 , 𝑑′ ) is a function that returns 1 if image 𝑑′ belongs to category 𝑐𝑖 and 0 otherwise. In Step 3 the generic similarity function of kNN is substituted by the functions discovered for each class. In our classification problems with 𝑛 classes using the described framework, we effectively end up with 𝑛 kNN classifiers. In order to produce a final classification result, we combine the output of all 𝑛 classifiers using a simple majority voting scheme, whereby the class of a image 𝑑𝑖 is decided by the most common class assigned by all the 𝑛 classifiers. Besides its simplicity, we chose to use the majority voting in our framework (Step 4) to: help alleviate the common problem of overfitting found in GP training and; help boost performance by allowing kNN classifiers to apply different similarity functions which explore and optimize the characteristics of each particular class. 3. EXPERIMENTS This section describes the experiments performed to validate the method. The configuration of the experiments is described as follows: ∙ Remote Sensing Data: The used image (Figure 2(a)) was captured by the SPOT satellite and corresponds to the Monte Santo de Minas county, in the State of Minas Gerais, Brazil, a traditional place of coffee cultiva-
Algorithm 1 The GP-based classification algorithm. 1 2 3 4 5 6 7
For each class, generate the initial population of random similarity functions (GP trees) For each class, perform the following sub-steps on training subimages for 𝑁𝑔𝑒𝑛 generations Calculate the accuracy of each similarity Record the top 𝑁𝑡𝑜𝑝 similarity trees Create new population by: Reproduction, Crossover and Mutation Apply the best similarity function of each class on a set of testing images to a kNN algorithm Combine the output of each classifier through a simple majority voting tion. The region where this image was captured is mountainous. To evaluate the accuracy, we use a mask (Figure 2(b)) that indicates (in white) all coffee crops in the image. Coffee crops presented in the mask was done manually in the whole county using the original image and visits to the place to compose the final result. The image has several targets that may be confused with the types of coffee crops such as bare soil, native vegetation and sugar cane crops. Figure 2 (c) illustrates examples of coffee and not-coffee crops. Note the difference among samples of coffee and the similarities with noncoffee samples.
(a)
(b)
(c) Fig. 2. Remote Sensing Data used in the experiments: (a) original image, (b) the mask indicating the regions of coffee and (c) example of coffee and non-coffee samples.
∙ Descriptors: We use 3 color descriptors (JAC, BIC and GCH) and 2 texture descriptors (SID and QCCH) chosed
based on previous study [10]. ∙ Baseline: We compare our method against Maximum Likelihood (MaxVer) Classification [11]. It is the most common supervised classification method used with remote sensing image data. ∙ Effectiveness Measure: To analyze the results we calculate the kappa index for the classified images. Kappa [12] is an effective index to compare classified images, commonly used in the RSI classification. In our experiments we have fixed the subimage size according to the common extension value of a region of interest. In the region of study, coffee crops are normally located in to small parcels on the same farm. We defined that 75 × 75 meters is a good value to the size of the partition. The dimension of partitions are fixed. We used 30×30 pixels to partition the image generating 6400 subimages to classify. A subimage could belong to one of 2 classes in the experiments: coffeecrops (with more than 50% pixels of coffee) and non-coffee (with less than 50% pixels of coffee) The proposed method is compared to MaxVer classification with probability threshold 0.98 and using 43.630 points of the coffee sample. Kappa accuracy for MaxVer was 66.0. The GP-based classification requires the definition of several GP parameters. In the experiments we use crossover rate equals 0.8 and reprodution equals 0.3. We also applyed k equals 13 and 5 in kNN (based on previous studies). In the experiments, we tested variations of population of GP individuals (30 and 50) and maximum of generations (15 and 30). We selected 20% of the tiles (samples) as training set. The results (Table 1) are the mean of 2 diferents training sets randomly selectd proportional to the class sizes. According to Table 1, it is possible notice that the best configuration for the population of GP individuals were 50 and 30, respectively. By using this configurations, we have obtained 66.33 of Kappa accuracy that is slightly better than MaxVer accuracy (66.0). It is important pointed out that we just performed a small set of tests and other configuration paramenters can improve the classification accuracy of our method. Moreover, we just evaluate partially the method. The segmentation process can increase the classification effectiveness. Figure 3 shows the functions generated by the GP-based classifier to combine the RSI features for the parameters used in Experiment 2 with training set 2 (Table 1). Figure 3 (a) is
EXP 1 2 3 4
POP N 30 30 50 50
GEN N 15 30 15 30
TRAIN SET 1 65.92 64.88 65.90 66.37
TRAIN SET 2 66.04 66.51 66.46 66.29
MEAN 65.98 65.70 66.18 66.33
Table 1. Kappa coeficient for Coffee recognition applying the proposed GP-based classifier. used to caracterize regions of the coffee class and Figure 3 (b), for non-coffee regions. As we observe, GP was able to discover very complex descriptors combination functions.
tion,” Photogrammetric Engineering and Remote Sensing, 57, 413-420, 1991. [3] S.M.J. Baban and K.W. Yusof, “Mapping land use/cover distribution on a mountainous tropical island using remote sensing and gis,” International Journal of Remote Sensing, 22, n.10, pp. 1909-1918, 2001. [4] L.K.A. Dorren, B. Maier, and A.C. Seijmonsbergen, “Improved landsat-based forest mapping in steep mountainous terrain using object-based classification,” Forest Ecology and Management, 183, pp. 31-46. [5] L. Pedroni, “Improved classification of landsat thematic mapper data using modified prior probabilities in large and complex landscape,” 2003. International Journal of Remote Sensing, 24, n.1, pp. 91-113.
(a)
(b)
Fig. 3. GP individuals generated in the EXP 2 (Table 1) with training set 2 for the classes (a) coffee and (b) non-coffee. The leafs of the trees (terminals) are the distance obtained by using the descriptors (𝑑1 : 𝐽𝐴𝐶, 𝑑2 : 𝐵𝐼𝐶, 𝑑3 : 𝐺𝐶𝐻, 𝑑4 : 𝑆𝐼𝐷 and 𝑑5 : 𝑄𝐶𝐶𝐻b).
4. CONCLUSIONS This work aims to present a new approach based on using successful information retrieval techniques to automatic recognition of coffee crops in RSIs. The presented results is very similar to MaxVer. The next step of this work is to study the parameters set configuration of the GP in the proposed approach. 5. REFERENCES [1] B.N. Holben and C.O. Justice, “An examination of spectral band rationing to reduce the topographic effect on remotely-sensed data,” International Journal of Remote Sensing, 2, pp. 115-123, 1981. [2] D.R. Peddle and S.E. Franklin, “Image texture processing and data integration for surface pattern discrimina-
[6] S. Cordero-Sancho and S. A. Sader, “Spectral analysis and classification accuracy of coffee crops using landsat and a topographic-environmental model,” Int. J. Remote Sens., vol. 28, no. 7, pp. 1577–1593, 2007. [7] J. R. Koza, Genetic Programming: On the Programming of Computers by Means of Natural Selection, MIT Press, Cambridge, MA, USA, 1992. [8] R. A. Lotufo and A. X. Falc˜ao, “The ordered queue and the optimality of the watershed approaches,” in In Mathematical Morphology and its Applications to Image and Signal Processing. 2000, pp. 341–350, Kluwer Academic Publishers. [9] Y. Yang, “Expert network: Effective and efficient learning from human decisions in text categorization and retrieval,” in 17th Annual International ACM SIGIR Conference on Research and Development in Information Retrieval, 1994, pp. 13–22. [10] J. A. dos Santos, O. A. B. Penatti, and R. da S. Torres, “Evaluating the potential of texture and color descriptors for remote sensing image retrieval and classification,” in VISAPP 2010, Angers, France, May 2010, pp. 203–208. [11] R. Showengerdt, Techniques for Image Processing and Classification in Remote Sensing, Academic Press, New York, 1983. [12] R. G. Congalton and K. Green, Assessing the Accuracy of Remotely Sensed Data: Principles and Practices., Lewis Publishersr, Washington, DC, 1977.