International Journal of Control, Automation, and Systems (2013) 11(6):1290-1299 DOI 10.1007/s12555-012-9407-7
ISSN:1598-6446 eISSN:2005-4092 http://www.springer.com/12555
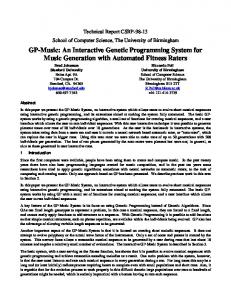
An Approach of Genetic Programming for Music Emotion Classification Sung-Woo Bang, Jaekwang Kim, and Jee-Hyong Lee* Abstract: In this paper, we suggest a new approach of genetic programming for music emotion classification. Our approach is based on Thayer’s arousal-valence plane which is one of representative human emotion models. Thayer’s plane which says human emotions is determined by the psychological arousal and valence. We map music pieces onto the arousal-valence plane, and classify the music emotion in that space. We extract 85 acoustic features from music signals, rank those by the information gain and choose the top k best features in the feature selection process. In order to map music pieces in the feature space onto the arousal-valence space, we apply genetic programming. The genetic programming is designed for finding an optimal formula which maps given music pieces to the arousalvalence space so that music emotions are effectively classified. k-NN and SVM methods which are widely used in classification are used for the classification of music emotions in the arousal-valence space. For verifying our method, we compare with other six existing methods on the same music data set. With this experiment, we confirm the proposed method is superior to others. Keywords: Classification algorithm, emotion recognition, genetic programming, music information retrieval.
1. INTRODUCTION There are billions of digital music resources in the digital world. As music resources are tremendously increasing, it is getting hard to find one that users want to listen to. Consequently, Music Information Retrieval (MIR) is becoming a principal research area to help users to choose pieces of music. MIR is for retrieving information from music such as genre, emotion, artist, album, song name, etc. [1-3]. Among those, the emotion of music is one of important information. The emotion of music is defined as the emotion that users feel while listening to music [4,5]. It can be represented in adjective words like sad, fun, happy, aggressive and so on. It is very useful information for modeling user preference and choosing pieces of music. Many of MIR researches take content-based approach which analyzes music information with acoustic features extracted from music signal. Since musical emotion classification is a kind of recognition problems, the research efforts on musical emotion classification have also focused on two problems: feature selection and __________ Manuscript received September 20, 2012; revised January 14, 2013 and July 9, 2013; accepted July 11, 2013. Recommended by Editor Young-Hoon Joo. This research was supported by Basic Science Research Program through the National Research Foundation of Korea (NRF) funded by the Ministry of Education, Science and Technology (No. 2013-0458-000) and IT R&D program of MKE/KEIT (10041244, Smart TV 2.0 Software Platform). Sung-Woo Bang, Jaekwang Kim, and Jee-Hyong Lee are with the College of Information & Communication Engineering, Sungkyunkwan University, Korea (e-mails:
[email protected], linux @ece.skku.ac.kr,
[email protected]). * Corresponding author. © ICROS, KIEE and Springer 2013
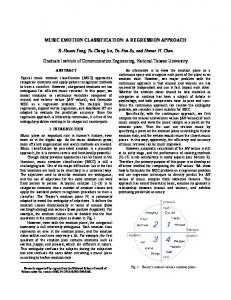
mapping features to emotion classes. Many studies have been devoted for find effective acoustic features for musical emotion, but no promising features are reported yet [6,7]. Some researchers selected features based on their knowledge on musical emotion, or some others extracted as many features as possible and selected some effective features by evaluating those with some methods such as RReliefF. Usually, the latter approach showed a better performance because the former selection approaches were dependent on developers’ subjective and implicit domain knowledge [8-10]. For mapping acoustic features to emotion classes, machine learning methodology is mostly used. The relation between acoustic features and musical emotions is modeled by machine learning methods such as Support Vector Machines (SVMs), Neural Networks (NNs), kNearest Neighborhood (k-NN), and so on [11-15]. Most of researches simply apply machine learning methods, but the performance was relatively low. Even though effective features are chosen, it is hard to find an accurate relation between those features and musical emotions because of the complexity of the underlying structure of the relation. Another direction for mapping is to incorporate some theories on human emotion. Among those, the Thayer’s emotion plane is representative [7,16,17]. It says that human emotion are determined by psychological arousal and valence evoked by outside events, as shown in Fig. 1. For example, if the psychological arousal is high and the psychological valence is positive, then people usually feel excited, happy or pleased. Since this model effectively describes human emotions with just two factors and the two factors, the psychological arousal and valence, can simply be connected to the acoustic arousal and valence, many researchers have adopted this model
An Approach of Genetic Programming for Music Emotion Classification
Fig. 1. Thayer’s arousal and valence emotion plane [7]. for musical emotion classification [7,16,18]. Inspired by the Thayer’s model, many researchers tried to map pieces of music into a two dimensional space, an arousal and valence space. If we assume that acoustic arousal and valence of music influence psychological arousal and valence which determine human emotion on music, the musical emotion can be described by acoustic arousal and valence as Thayer did. Eronen et al. and Yang et al. proposed regression based approaches [8,14]. They gathered some pieces of music and surveyed how people felt on the pieces in terms of arousal and valence, and built regression models which mapped acoustic features to psychological arousal and valence values. For an unknown piece, if we extract its acoustic features, its psychological arousal and valence values can be estimated. That is, any pieces can be mapped onto an arousal-valence space and its emotional class is determined by some machine learning approaches in the space. It is a very interesting approach, but it needs survey results on how people feel on music. Due to the diversity of human perception, there can be inherent uncertainty in obtaining psychological strength of arousal and valence from people, even though these approaches show better results than simple machine learning approaches. Another mapping approach is developing formulas which combine acoustic arousal and valence features to obtain one arousal and one valence values. Laukka et al. suggested formulas for combining features based on their knowledge [19]. Yang et al. also computed the arousal and valence values by the transformation with a fuzzy approach [20]. However, this approach is sill immature and the performance is unsatisfactory, because it is very difficult to find nonlinear mapping functions mainly dependently on expert knowledge. In this paper, we suggest a new approach that takes advantages of former approaches on musical emotion classification. The proposed method is based on the Thayer’s plane which says that human emotions are determined by psychological arousal and valence evoked by outside events. We also accept the assumption that acoustic arousal and valence have a strong relation with psychological arousal and valence. Thus, we try to
1291
classify musical emotions on an acoustic arousal and valence plane as Thayer did. One of concerns is feature selection. Hundreds of different acoustic features can be extracted from music signals. Among those features, we need to find out the most appropriate features which are effective for classification of musical emotions. In order to find effective features, we extract more than 80 acoustic features and apply an entropy based method the select feature subset. The entropy based feature selection method is widely used in text mining in which there are a large number of terms and documents [21,22]. The problem we have also has a number of features and pieces of music which correspond to terms and documents. So, we think that an entropy based feature selection approach will also show a good result for emotion classification. Another consideration is to find reformulating function of the selected features. We have to find formulas to combine the selected features into one arousal and one valence values. The difficulties in finding formulas are that the search space is vast and this mapping is nonlinear with little available expert knowledge. We adopt a genetic programming approach. The genetic approach will find reformulation functions for feature combinations so that the performance of musical emotion classification is maximized. Genetic programming is very effective to explore a vast search space and needs little domain knowledge [23,24]. For the experiment, music samples, which are made up of western pop songs with emotions identified in AllMusic web site [25], were collected for training, validation and testing in experiments. We summarize the related work in Section 2 and describe our approach in Section 3. The results of musical emotion classification and discussion of these results will be presented in Sections 4 and 5. 2. RELATED WORK A variety of approaches have been applied to classify musical emotion. Most of approaches simply adopted machine learning algorithms, but some of them combined machine learning algorithms and human emotion models, mostly the Thayer’s plane. In terms of feature types, most of researches are based on solely acoustic features [26,27], but some use acoustic features together with other information such as thematic information, lyrics, social tags, etc. [28]. Here, we focus on only acoustic feature based approaches. Most of early researches on musical emotion classification simply adopted machine learning algorithms to acoustic features. Skowronek et al. developed classifiers for each of 12 emotion classes using a data set of 1,059 songs [29]. Temporal modulation, tempo and rhythm, chroma and key information were chosen as features based on their subjective opinion. They used quadratic discriminant functions to classify emotions. Kim et al. used the Thayer’s four emotion classes and employed SVMs for classification [30]. They chose MFCCs, chroma, centroid, flux, rolloff and flatness as acoustic fea-
1292
Sung-Woo Bang, Jaekwang Kim, and Jee-Hyong Lee
tures with their own knowledge. Li et al. extracted acoustic features, such as spectral centroid, spectral rolloff, spectral flux, and zero crossing, and used SVM for classification [31]. They collected 235 jazz music data and categorized them into three emotion classes: cheerful, relaxing, and comforting. Feng et al. classified musical emotions into happiness, sadness, anger and fear and used the temporal acoustic features such as beat sum and flatness [32]. They adopted neural networks for a classifier. Liu et al. pursued emotion detection and used acoustic features including intensity, timbre, and rhythm [33]. Their classifier used GMMs for the four emotion classes on the arousal and valence representation. The system was trained using a set of 250 classical music, hand labeled to one of the four classes. Recently, musical emotion classification approaches are focused on the arousal and valence values of music. The approaches tried to combine extracted acoustic features into an arousal and valence value pair. These approaches are considered more efficient and reliable than simple machine learning approaches [7,17]. There are two approaches for combining features; one is using regression methods and the other is developing mapping functions. The regression based approaches try to build a regression model which maps acoustic feature values into psychological arousal and valence values. So, these approaches need not only acoustic feature values, but also survey results on psychological arousal and valence values for training data set. Yang et al. adopted this approach [7]. They chose scale, intensity, rhythm and harmonics as features by their own decision, and employed Support Vector Regression (SVR) for regression and Gaussian Mixture Model (GMM) for classification. However the research is unsatisfactory results, 33% accuracy, with 11 classes. Rho et al. also used SVR and the Thayer’s 4 emotion classes [27]. However they collected only 41 songs for evaluation of their approach. It is not sufficient number of experimental data set for judging the reliability of their method, and acoustic features also were selected by tradition suggestion. Yang et al. tried to solve mapping function problems with fuzzy approach [20]. Emotion classes are divided into four, and a piece of music is represented by a fuzzy vector indicating the relative strength to each class by fuzzy classifiers (e.g., Fuzzy k-NN, Fuzzy k-median). The geometric relationship of the four emotion classes is generated from given a fuzzy vector as a mapping function. Since the geometric relationship between arousal and valence is inexact, it is not proper to perform on the arousal and valence values. Schubert suggested acoustic features which were related to musical emotion and mapping functions which estimated the arousal and valence values from the features by mapping functions [34]. The mapping functions were designed by experts. The suggested acoustic features are used in a lot of studies on emotion classification [7,14,16], but the mapping function does not perform as well as expected because the mapping functions are depend on a subjective decision.
The regression based models is hard to construct because it needs survey results on psychological arousal and valence on training pieces of music. The survey results can be unreliable because people’s perception and sense are unstable and diverse. The mapping function approaches are easier to develop than the regression based approaches but have relatively low performance because of heavy dependence on expert knowledge. There is also a study based on a modified arousal and valence model in musical emotion classification. Eerola et al. introduced the use of a three-dimensional emotion model with activity, valence, and tension [35]. In their work, they investigated multiple regression approaches including Partial Least-Squares (PLS) regression, an approach that considers correlation between emotion dimensions, and selected 29 acoustic features. They used 5 emotion classes: angry, scary, happy, sad and tender. However no significant improvement was observed with the three-dimensional model over the two-dimensional model. In this paper, we select 8 studies on musical emotion classification to compare accuracies with our method. These approaches obtained relatively high performance and are usually selected for comparing classification result. For comparison of accuracies, we implemented their approaches and applied with our data set. 3. MUSIC EMOTION CLASSIFIATION 3.1. Overview We propose an approach for classification of musical emotion summarized in Fig. 2. We first extract acoustic features from music data for collecting information about musical emotion and select most informative ones among them by an entropy measure. The extracted features are categorized based on Thayer model into the arousal and valence. Then, a genetic programming process will find two formulas to combine the selected features: one for combining the arousal features in the selected features and the other for combining the valence features. Based on the formulas, a piece of music is mapped onto a two dimensional space and classified for musical emotion recognition. We extract 85 acoustic features, which are mostly examined in this sphere. The 85 acoustic features are grouped into two types: arousal and valence features, based on its characteristic which is defined by Schubert [34].
Fig. 2. Overview of the proposed method.
An Approach of Genetic Programming for Music Emotion Classification
In the feature selection process, we select useful features in the 85 features based on an entropy measure. First we estimate the entropy of each feature to calculate the information gain measure. Next, we rank features according to the information gain and choose the top k features which show the best performance. The genetic programming process in our approach is used to find mapping functions that combine the features with operators such as sigmoid, addition, subtraction, etc. After the genetic programming process, the arousal and valence values are combined into one respectively. Finally, we apply k-NN and SVM to classify musical emotion based on the two combined feature values. 3.2. Feature selection In this section we describe the feature selection method that we adopted. We first extract 85 acoustic features which can be suggested for the musical emotion classification [34] and then use entropy measure to select the most important features. An entropy measure method is proposed by M.B. Bassat et al. in which a feature importance is measured by the entropy reduction due to the feature [36]. This method is recently used for feature selection in text mining (e.g., text categorization). In text mining, there are a large number of terms and documents, so it is not easy to efficiently find effective features. Since evaluating entropy is relatively easy and efficient, and entropy effectively measures the affection of features to data discrimination, many researchers think that the entropy is very useful information for large data sets. We have a large number of features and pieces of music, which correspond to terms and documents, respectively, so we think that this method may be suitable for our feature selection process. The entropy is a quantitative value representing the amount of disorder in a feature. For instance, when the entropy of a feature is low, it means that the disorder is of the feature is low. The entropy of a feature X is defined as
H ( X ) = −∑ i P( xi ) log 2 ( P( xi )).
(1)
And the entropy of a feature X after observing another feature Y is defined as H ( X Y ) = −∑ j P ( y j )∑ i P ( xi y j ) log 2 ( P ( xi y j )). (2)
ranked according to information gain. Then, we check the classification performance of the top k features, and choose the k which shows the best performance. Since the information gain of a feature represents the discrimination power of the feature, the orders of features by the information gain can be considered as the orders to be selected. We first choose the best feature as the initial feature set and evaluate the classification performance of the feature set. Then, we add the next feature to the feature sets and evaluate its performance. If the performance increases, we accept the new one and continue. Otherwise, we stop and use the final feature set for classification. We will compare the effectiveness of this approach in Section 4. 3.3. Genetic programming This section presents the genetic programming approach which is employed to find formulas to combine arousal and valence values. GP is a branch of Genetic Algorithms (GA) and suggested by Koza [38]. The most significant difference of GP to other evolutionary algorithms lies in the representation, GA used binary strings but GP employs tree structures. Trees consist of two types of elements which are nodes and leaves. Nodes are a functional element which connects the elements below using the function assigned to the node. On the other hand, leaves are one of input variables, and have no further connections below. A simple example of tree representations is shown in Fig. 3 which contains three nodes and four leaves and the expression reads as ((a*b) + (c – d)).
(3)
According to this measure, if IG(X | Y) > IG(X | Z), then feature Y is regarded more important to feature X than feature Z. For feature selection, the information gains of all features are evaluated, and features are
(4)
Here the leaves normally take any real numbers of input variables. A GP process needs a fitness function and three main operators: selection, crossover, and mutation. Selection focuses on the exploration of promising regions in the search space. In other words, selection is responsible for the speed of evolution. As such, a decision on the type of selection to be applied is one of the most important tasks. Crossover is due to offers to the population by creating new offspring that consists of partial traits taken from parents. It combines the genetic materials of two parents by exchanging a part of one parent with another part of the other. The crossover is quite effective in searching around solution spaces by exchanging sub-trees of parents. Mutation is performed
In formula (1) and (2), xi and yj are a value which X and Y can take on, respectively. Where P(xi) is the prior probabilities for all values of X, and P(xi|yj) is the posterior probabilities of a value of X given a value of Y. The amount by which the entropy of feature X decreases due to additional information of feature Y and it is called the information gain [37], given by IG(X | Y) = H(X) – H(X | Y).
1293
Fig. 3. A simple example of function in GP.
1294
Sung-Woo Bang, Jaekwang Kim, and Jee-Hyong Lee
[PARAMETER] Pop: Population, N: # of Arousal inputs, M: # of Valence inputs, I: # of Iteration, Pc: Crossover Probability, Pm: Mutation Probability, C: Classification Algorithm [OUTPUT] Out: Accuracy, Composition of Tree /* -- Generating Initial Composition Populations -- */ Pop = InitCompose ( Arousal (N), Valence (M) ); // Operand: sigmoid, +, -, *, / // Input Variable: Four Arousal Features, Four Valence Features /* -- GP Algorithm -- */ while ( I=1000 ) FitnessMeasure ( Pop, C ); // C=Classification algorithm (e.g., k-NN, SVM) // Fitness =Accuracy of Classification Pop(s) = Selection ( Pop ); // Find superior individuals using Tournament Selection Pop(c) = Crossover ( Pop(s), Pc ); // Perform crossover Pop(m) = Mutation ( Pop(c), Pm ); // Perform mutation Pop = Replace ( Pop(m) ); // Generation replacement endwhile return (Accuracy, Composition of Tree)
Fig. 4. Pseudo code of the GP process.
Fig. 5. An example of individual encoding in our GP. on only a single individual with a small probability. It plays an important role in diversity of GP. When an individual has been selected for mutation, a node is randomly chosen, and then the existing sub-tree at that node is replaced with a newly generated sub-tree. The mutated individual is then placed back into the population. Fig. 4 shows the pseudo code of the GP process. To adopt GP to our approach, we modify an individual encoding and set some constraints. Generally, an individual is encoded by a tree structure. However, in the proposed approach, an individual contains two independent trees: one for arousal and the other for valence as shown in Fig. 5. The leaves in each tree indicate input variables of arousal and valence, respectively. We also set some restrictions on the shape of trees. Usually, individuals can be any form of trees if the nodes (internal nodes) are the operators and the leaves are the inputs variables. Usually, to find the optimal solution, a GP process usually put as few restrictions as possible on tree shape. For example, the depth of trees is unlimited, and the appearance of input variables in the leaves is not mandatory. However, this approach extends the search space, and thus reduces the possibility of finding good
solutions. So, in order find good solutions in an efficient way. We put several restrictions on the tree shape. First, every input variable should appear once and only once in the leaves. The features selection method already discovered the four arousal and the four valence features which were expected effective for classification. We guess those features necessarily lead to a high performance. Thus we design all features should appear in the leaves at least once. However, we restrain multiple appearances. For an optimal combination of features, some features may be involved several times in the combination, but such combination can have a characteristic of high nonlinearity. A high nonlinearity can cause a low generalization in the training and thus a low performance in the test. In order to control the complexity of the feature combination, we put the restriction that every feature should appear only once. Second, we do not use constants in the leaves, and use as few operators as possible in the nodes set. The operators consist of binary and unary operators which are {+, –, ×, ÷, sigmoid}. Constants mean linear transformations. If we permit constants, we may find better solutions but it will extend the search space. However, we think that nonlinear combinations of features have a more effect on classification than linear combinations. Considering the tradeoff between the performance and the search space, we decide to exclude constants. Another consideration is operators. Also many operators can help to find better solutions but the search space will be expanded. We include basic arithmetic operators, +, –, ×, ÷, and some nonlinear functions. Candidates are sigmoid functions for binary discrimination, and cosine and sine functions for cyclic data. However, cosine and sine functions may have less power to model cyclic data without constants. Thus, in order to reduce the complexity, we determine to use only five operators: +, –, ×, ÷, and sigmoid. We also set the tree depth to five. This is also essential constraint in crossover operation. The size of trees can grow exponentially without the maximum size of tree constraint. The five-depth is an enough number which contains four input and five operators for its combinations. The crossover operator is illustrated in Fig. 6. Two parents are selected by the selection operator, and then a sub-tree is randomly selected in each tree and swapped between two parents. The crossover operators are independently applied to each tree of individuals. Since we have some constrains on the tree shape, we do not accept the new individuals if those do not satisfy the constraints. For example, if a tree has leaves less than 4 after crossover, or the depth of a tree is longer than five, then we eliminate it and applied crossover once more. Mutation operator is simpler than crossover as shown Fig. 7. In general, each offspring undergoes mutation with a very low probability. A sub-tree is selected randomly in the parent and removed. Then a new sub-tree is generated randomly, replacing the removed sub-tree. The mutation operator is also independently applied to each tree of individuals. As we do with the crossover operator, if a mutated tree does not satisfy our constraints on the shape, we abandon it. After individuals are created, the arousal
An Approach of Genetic Programming for Music Emotion Classification
1295
Fig. 6. GP crossover in our approach.
Fig. 7. GP mutation in our approach. and valence values are calculated by composition of mapping function, and then fitness function evaluates the individual. The classification accuracy is adopted as the fitness value as (5) fitness =
The number of samples classified correctly . The number of samples used for training during evolution
(5)
The classification accuracy is estimated by machine learning algorithms. We use k-NN and SVM algorithms Crossover and mutation operations are applied with probabilities Pc = 0.8 for crossover and Pm = 0.01 for mutation, and the tournament selection is used as it is effective in keeping the selection noise as low as possible [39]. These probabilities are empirically selected. A number of individuals for tournaments, called the tournament size, are selected randomly. 4. EXPERIMENTAL RESULTS 4.1. Experimental setup We collected 488 western pop music files and each experimental music data is first down-sampled into a
uniform format of 44.1 kHz, 24 bits, mono channel, and randomly selected 30 seconds of audio samples that is enough length to recognize musical characteristics [40]. Then 85 acoustical features are extracted by PsySound3 [41]. PsySound3 is a tool for extracting features from an audio signal. These acoustic features are very common and useful in the musical identification. Emotion information is obtained from AllMusic website which provides a music retrieval service [24]. The site also provides users with the emotion information of each piece which is determined by experts. The data set is into two parts: 324 music data for training and 164 music data for validation. In genetic programming, an algorithm is repeated 1,000 times. The population size is 100, the crossover probability is 0.8 and the mutation probability is 0.01. SVM and k-NN classification algorithms are also integrated with its specific parameters respectively. We have set the RBF kernel for SVM with the penalty parameter C = 23 and the kernel function parameter Γ = 2–5 determined by the grid search approach which is an efficient way to find the best C and Γ [42]. We also chose a Euclidean distance approach and k = 5 for k-NN. The experiment was performed by 10-fold cross-validation. We compared our result with the six previous methods.
Sung-Woo Bang, Jaekwang Kim, and Jee-Hyong Lee
1296
4.2. Feature selection As mentioned in Section 3, we have applied an entropy measure to select discriminative features from 85 acoustic ones. In order to determine the minimum number of features for the best performance, we apply an entropy based approach which is widely used in text mining. First, information gains of features are estimated by entropy measure, and we rank them according to the information gain. Then, we check the classification accuracy of the top k feature. For classification, we use k-NN and SVM. k-NN is a non-parametric classification method [14]. For a data record t to be classified, its k nearest neighbors are retrieved, and this forms a neighborhood of t. With this neighborhood, the class of record t is determined by the major class of its neighbors. SVM is suggested by Vapnik, and it is called as a maximum margin classifier [43]. SVMs set up a hyper plane which classifies the two classes training data group. SVMs are known to have good performance compared with other classification methods [44]. Fig. 8 shows the accuracy for the top k features based on entropy measure. The highest accuracy is 68.8% with 8 features by k-NN, and 70.4% with 10 features by SVM. By comparing with the performance of using all features, (39.4% by k-NN and 43.2% by SVM), the best accuracies of the selected feature are better. So, we conclude that around the top ten features the classification performance is maximized. In the top 10 features, there are four arousal and six valence features. Since we will combine all arousal and all valence features into one, respectively, we need to choose the same number of features from arousal and valence, so that features in each
Accuracy
80 60 40 k-NN
20
SVM
0 1
5 10 15 20 25 30 35 40 45 50 55 60 Number of features
Fig. 8. Accuracy for the top k features based on entropy measure. Table 1. Feature description. Type
Feature Spectral Centroid Loudness Tonality
Description Centroid of spectral density function. Sound intensity. Arousal Major-minor tonality. Musical pitches sounded simulChord taneously. Timbral Width Peak width of loudness spectrum. Beat sum Regular beats play in music. Valence Spectral Roughness of spectral componDissonance ents. Volume Size of sound.
Table 2. Classification of selection methods by k-NN and SVM. Method RReleifF Incremental
Acc. 61.3 65.2
k-NN # of Features 18 12
Acc. 48.0 53.5
SVM # of Features 19 15
type equivalently affect the classification. Table 1 shows the chosen features. We try to compare our feature selection method with an incremental and the RReliefF selection method. A simple incremental feature selection is to test a feature by adding it to the current feature set and comparing the performance of the new set and the original one. If the new set outperforms the original one, the added feature will be accepted. This process will continue until there are no more features to increase the performance. The RReliefF is a classical method to select feature subsets. It estimates the weight of each feature according to how well its value distinguishes between instances that are near to each other [10]. Table 2 shows the best classification accuracies by kNN and SVM with the features selected by the RReliefF or the incremental approach. The highest classification results with incremental feature selection are 65.2% with 12 features in k-NN and 53.5% with 15 features in SVM. And 61.3% with 18 features in k-NN and 48.0% with 19 features in SVM are the highest classification accuracies with RReliefF. This results represent our selection method has better performance than the incremental and the RReliefF methods. In SVM, especially, the result is much higher than both feature selection methods. 4.3. Classification accuracy To evaluate the effectiveness of our approach, we conducted a series of experiments on our data set. In our approach, we combine eight chosen features to two features (arousal and valence) by GP. The generated mapping functions of each feature by GP are expressed as (6) and (7) show. Arousal =
sigmoid ( F1 + F2 ) × F3 F4
(6)
F1: Spectral centroid, F2: Chord, F3: Loudness, F4: Tonality, Valence =
F5 − F6 F7 + F8
(7)
F5: Beat sum, F6: Spectral dissonance, F7: Timbral width, F8: Volume. The four acoustic arousal features, Spectral centroid, Chord, Loudness and Tonality are combined into Arousal as shown in (6). Spectral centroid is strongly related with “brightness” of a sound. So, Spectral centroid, together with Chord and Loudness, may be proportional to the psychological arousal. In (6), Tonality is in inverse proportion to Arousal. As (7) shows four acoustic valence features, Beat sum,
An Approach of Genetic Programming for Music Emotion Classification
Table 3. Musical emotion classes by R.E. Thayer et al. [16]. Class Class 1 Class 2 Class 3 Class 4
Words Excited, Happy, Pleased Annoying, Angry, Nervous Sad, Bored, Sleepy Relaxed, Peaceful, Calm
Table 4. Musical emotion classes by X. Hu et al. [45]. Class Class 1 Class 2 Class 3 Class 4 Class 5
Words Passionate, Rousing, Confident, Boisterous, Rowdy Rollicking, Cheerful, Fun, Sweet, Amiable/Good Natured Literate, Poignant, Wistful, Bittersweet, Autumnal, Brooding Humorous, Silly, Campy, Quirky, Whimsical, Witty, Wry Aggressive, Fiery, Tense/Anxious, Intense, Volatile, Visceral
Table 5. Classification accuracy with genetic programming (GP). Learning Algorithm 5 Classes 4 Classes
Accuracy without Feature Combination (%) k-NN SVM 68.3 70.1 73.4 71.2
Accuracy with Feature Combination (%) k-NN SVM 72.6 74.4 77.9 81.6
Spectral dissonance, Timbral width and Volume are combined. Since we usually feel attractive with regular beats, Beat sum may be proportional to the psychological valence. On the other hand, disharmony is negative to attractiveness, so Spectral dissonance may have a bad effect on attractiveness. Timbral width and Volume are related to the energy in a signal, so people may feel uncomfortable if it is high. After two types of acoustic features calculated by (6) and (7), the classification accuracies are obtained by machine learning algorithm. In this study, we aim to classify the emotion of music into four classes and five classes which are mostly used in musical emotion classification. R.E. Thayer et al. suggested that the emotion class can be divided into four classes in Table 3, while Hu et al. suggested five classes in Table 4. Table 5 shows the results. The classification result of eight chosen features with no combination is 73.4% with k-NN and 71.2% with SVM in four classes. And the accuracies are 68.3% with k-NN and 70.1% with SVM in five classes. Those numbers are not that much lower than the previous approaches in Table 6. It shows that our feature selection is very effective as mentioned in Section 4.2. If we combine four chosen arousal features into one and also four chosen valence features into another one by GP. We have better results: 72.6% with k-NN and 74.4% with SVM in five classes 77.9% with k-NN and 81.6% with SVM in four classes. We also compared classification accuracies with the previous approaches. Table 6 shows the summary of the
1297
Table 6. Accuracy comparisons. No. of Classes, Classification Method Accuracy (%) Feng et al. (2003) [32] 4 classes, NN 67.0 Li et al. (2006) [1] 3 classes, SVM 70.0 Skowronek et al. 12 classes, quadratic 31.9 (2007) [29] discriminant analysis Bischoff et al. 5 classes, SVM and 57.5 (2009) [28] NBM Liu et al. (2003) [33] 4 classes, GMM 70.2 Rho et al. (2009) [27] 11 classes, SVR 34.1 4 classes, Our approach 81.6 GP and SVM 5 classes, Our approach 74.4 GP and SVM Author (year)
results of each method. For the experiment, we implemented those approaches and used the classes and the features they suggested, because most classification methods are affected by the chosen features, data set, and classes in training. Thus we try to compare our approach with others in a fair comparison. We use the same data set for all methods. In SVM, accuracy is 81.6% in four classes and 74.4% in five classes with GP process which is the highest accuracy in experiment so far. From the result above, we conclude that GP evokes considerable process as well as our approach using mapping function for calculation of the arousal and valence values. 5. CONCLUSION In this paper, we proposed a new approach in music emotion classification to improve classification accuracy. This approach confirmed that classification accuracy is fairly affected by musical features and machine learning algorithms. In our approach, musical features were selected through entropy measure, and the arousal and valence values were also combined using genetic programming. Then SVM and k-NN classification algorithms which are commonly used among researchers were adopted to determine music emotion classes. Experiments have been conducted on different approaches and it is observed that the proposed approach yielded the highest classification accuracy for audio data set. Considering the accuracy, the feature selection based on entropy measure, the arousal and valence values, and SVM we have developed, gives a very promising accuracy in classifying music emotion. We believe that our approach can be easily extended to other feature sets. In the future, we are considering more features that represent music emotion and implementing various operands for genetic programming to improve the accuracy of classification. Furthermore, we expect to reach better user satisfactions in music recommendation tasks based on our approach.
[1]
REFERENCES T. Li and M. Ogihara, “Toward intelligent music information retrieval, ” IEEE Trans. on Multimedia,
1298
[2]
[3]
[4]
[5]
[6]
[7]
[8]
[9]
[10]
[11]
[12]
[13]
[14]
Sung-Woo Bang, Jaekwang Kim, and Jee-Hyong Lee
vol. 8, no. 3, pp. 564-574, 2006. M. A. Casey, R. Veltkamp, M. Goto, M. Leman, C. Rhodes, and M. Slaney, “Content-based music information retrieval: current directions and future challenges,” Proc. of the IEEE, vol. 96, no. 4, pp. 668-696, 2008. G. Tzanetakis and P. Cook, “Musical genre classification of audio signals,” IEEE Trans. on Speech and Audio Processing, vol. 10, no. 5, pp. 293-302, 2002. H. Fujihara, M. Goto, T. Kitahara, and H. G. Okuno, “A modeling of singing voice robust to accompaniment sounds and its application to singer identification and vocal-timbre-similarity-based music information retrieval,” IEEE Trans. on Audio, Speech, and Language Processing, vol. 18, no. 3, pp. 638-648, 2010. X. Zhu, Y.-Y. Shi, H.-G. Kim, and K.-W. Eom, “An integrated music recommendation system,” IEEE Trans. on Consumer Electronics, vol. 52, no. 3, pp. 917-925, 2006. P. Saari, T. Eerola, and O. Lartillot, “Generalizability and simplicity as criteria in feature selection: application to mood classification in music,” IEEE Trans. on Audio, Speech, and Language Processing, vol. 19, no. 6, pp. 1802-1812, 2011. Y.-H. Yang, Y. C. Lin, Y. F. Su, and H. H. Chen, “A regression approach to music emotion recognition,” IEEE Trans. on Audio, Speech, and Language Processing, vol. 16, no. 2, pp. 448-457, 2008. F. Morchen, A. Ultsch, M. Thies, and I. Lohken, “Modeling timbre distance with temporal statistics from polyphonic music,” IEEE Trans. on Audio, Speech, and Language Processing, vol. 14, no. 1, pp. 81-90, 2006. H. Liu and R. Setiono, “Incremental feature selection,” Journal Applied Intelligence, vol. 9, no. 3, 1998. M. Robnki-Sikonija and I. Kononenko, “Theoretical and empirical analysis of ReliefF and RReliefF,” Machine Learning Journal, vol. 53, pp. 23-69, 2003. R. M. Sharkawy, R. S. Mangoubi, T. K. AbdelGalil, M. M. A. Salama, and R. Bartnikas, “SVM classification of contaminating particles in liquid dielectrics using higher order statistics of electrical and acoustic PD measurements,” IEEE Trans. on Dielectrics and Electrical Insulation, vol. 14, no. 3, pp. 669-678, 2007. M. H. Song, J. Lee, S. P. Cho, K. J. Lee, and S. K. Yoo, “Support vector machine based arrhythmia classification using reduced features,” International Journal of Control, Automation, and Systems, vol. 3, no. 4, pp. 571-579, 2005. M. D. Hanes, S. C. Ahalt, and A. K. Krishnamurthy, “Acoustic-to-phonetic mapping using recurrent neural networks,” IEEE Trans. on Neural Networks, vol. 5, no. 4, pp. 659-662, 1994. A. J. Eronen and A. P. Klapuri, “Music tempo estimation with k-NN regression,” IEEE Trans. on
[15]
[16]
[17] [18]
[19]
[20]
[21]
[22]
[23]
[24]
[25] [26]
[27]
[28]
[29]
Audio, Speech, and Language Processing, vol. 18, no. 1, pp. 50-57, 2010. V. Mitra, H. Nam, C. Y. Espy-Wilson, E. Saltzman, and L. Goldstein, “Retrieving tract variables from acoustics: a comparison of different machine learning strategies,” IEEE Journal of Selected Topics in Signal Processing, vol. 4, no. 6, pp. 1027-1045, 2010. Y.-H. Yang and H. H. Chen, “Prediction of the distribution of perceived music emotions using discrete samples,” IEEE Trans. on Audio, Speech, and Language Processing, vol. 19, no. 7, pp. 2184-2196, 2011. R. E. Thayer, The Biopsychology of Mood and Arousal, Oxford University Press, NY, 1989. C.-H. Yeh, H.-H. Lin, and H.-T. Chang, “An efficient emotion detection scheme for popular music,” Proc. of the IEEE International Symposium on Circuits and Systems, pp. 1799-1802, 2009. P. Laukka and P. N. Juslin, “Similar patterns of age-related differences in emotion recognition from speech and music,” Motivation and Emotion, vol. 31, no. 3, pp. 182-191, 2007. Y. H. Yang, C. C. Liu, H. H. Chen, Y. H. Yang, C. C. Liu, and H. H Chen, “Music emotion classification: a fuzzy approach,” Proc. of the ACM Multimedia, pp. 81-84, 2006. E. Montanes, I. Diaz, J. Ranilla, E. F. Combarro, and J. Fernandez, “Scoring and selecting terms for text categorization,” IEEE Intelligent Systems, vol. 20, no. 3, pp. 40-47, 2005. Y. Lu and Y. Huang “Document categorization with entropy based TF/IDF classifier,” Proc. of the WRI Global Congress on Intelligent Systems, vol. 4, pp. 269-273, 2009. D. P. Muni, N. R. Pal, and J. Das, “Genetic programming for simultaneous feature selection and classifier design,” IEEE Trans. on Systems, Man, and Cybernetics, Part B: Cybernetics, vol. 36, no. 1, pp. 106-117, 2006. J. Kim, K. Yoon, and J.-H. Lee, “An approach to extract informative rules for web page recommendation by genetic programming,” IEICE Trans. on Communications, vol. E95-B, no. 05, May 2012. AllMusic, http://www.allmusic.com/. T. Li and M. Ogihara, “Content-based music similarity search and emotion detection,” Proc. of the International Conference on Acoustic, Speech, Signal Process, Toulouse, France, pp. 17-21, 2004. S. M. Rho, B. J. Han, and E. J. Hwang, “SVRbased music mood classification and context-based music recommendation,” Proc. of the ACM International Conference on Multimedia, pp. 713-716, 2009. K. Bischoff, C. S. Firan, R. Paiu, W. Nejdl, C. Laurier, and M. Sordo, “Music mood and theme classification: a hybrid approach,” Proc. of the ISMIR, pp. 657-662. 2009. J. Skowronek, M. McKinney, and S. Par, “A demonstrator for automatic music mood estimation,”
An Approach of Genetic Programming for Music Emotion Classification
Proc. of the ISMIR, pp. 345-346, 2007. [30] Y. E. Kim, E. Schmidt, and L. Emelle, “Moddswings: a collaborative game for music mood label collection,” Proc. of the ISMIR, pp. 231-236, 2008. [31] T. Li, M. Ogihara and Q. Li, “A comparative study on content-based music genre classification,” Proc. of the SIGIR, pp. 282-289, 2003. [32] Y. Feng, Y. Zhuang, and Y. Pan, “Popular music retrieval by detecting mood,” Proc. of the SIGIR, pp. 375-376, 2003. [33] D. Liu, L. Lu, and H. J. Zhang, “Automatic mood detection from acoustic music data,” Proc. of the ISMIR, pp. 81-87, 2003. [34] E. Schubert, Measurement and Time Series Analysis of Emotion in Music, Ph.D. Thesis, University of New South Wales, 1999. [35] T. Eerola and J. K. Vuoskoski, “A comparison of the discrete and dimensional models of emotion in music,” Psychology of Music, vol. 39, no. 1, pp. 1849, 2011. [36] M. B. Bassat, “On the sensitivity of the probability of error rule for feature selection,” IEEE Trans. on Pattern Analysis and Machine Intelligence, vol. PAMI-2, no. 1, pp. 57-61, January 1990. [37] A. W. Moore, “Information gain,” School of Computer Science, Carnegie Mellon University, http:// www.cs.cmu.edu/~awm/tutorials, 2001. [38] J. R. Koza, “Genetic programming: a paradigm for genetically breeding populations of computer programs to solve problems,” Stanford University Computer Science Department technical report STAN-CS-90-1314, June 1990. [39] S. Nadarajah, “An explicit selection intensity of tournament selection-based genetic algorithms,” IEEE Trans. on Evolutionary Computation, vol. 12, no. 3, pp. 389-391, 2008. [40] C. N. Silla, C. A. A. Kaestner, and A. L. Koerich, “Automatic music genre classification using ensemble of classifiers,” Proc. of the IEEE International Conference on Systems, Man and Cybernetics (ISIC), pp. 1687-1692, 2007. [41] PsySound, http://psysound.wikidot.com/. [42] A. Ruiz and P. E. Lopez-de-Teruel, “Nonlinear kernel-based statistical pattern analysis,” IEEE Trans. on Neural Networks, vol. 12, no. 1, pp. 1632, 2001. [43] V. Vapnik, The Nature of Statistical Learning Theory, Springer Verlag, Heidelberg, December 1995. [44] J. Lee, J. Kim, J.-H. Lee, I.-H. Cho, J.-W. Lee, K.H. Park, and J. G. Park, “Feature selection for heavy rain prediction using genetic algorithm,” Proc. of the 6th International Conference on Soft Computing and Intelligent Systems, and the 13th International Symposium on Advanced Intelligent Systems, pp. 830-833, 2012. [45] X. Hu and J. S. Downine, “Exploring mood metadata: relationships with genre, artist and usage metadata,” Proc. of the ISMIR, pp. 67-72, 2007.
1299
Sung-Woo Bang received his M.S. degree in the Department of Electrical and Computer Engineering from Sungkyunkwan University, Suwon, Korea, in 2011. He is currently a counselor in LG CTS, Seoul, Korea. His current interest fields are web-based inference and intelligent systems.
Jaekwang Kim received his B.S. and M.S. degrees from Sungkyunkwan University, Suwon, Korea in 2004, and 2006, respectively. His research interests include networks, security, and intelligent systems. He is currently a Ph.D. student at the Department of Electrical and Computer. Engineering, Sungkyunkwan University, He received the best presentation paper award at ICUIMC, Suwon, Korea in Jan. 2009.
Jee-Hyong Lee received his M.S. and Ph.D. degrees in Computer Science from Korea Advanced Institute of Science and Technology (KAIST), Daejeon, Korea, in 1995 and 1999, respectively. He was an international fellow at SRI International, California from 2000 to 2001. He has been working as a faculty at Sungkyunkwan University, Suwon, Korea since March 2002. His current interest fields are web intelligence and intelligent information processing.