International Journal of Computational Intelligence Volume 3 Number 1
Genetic Programming Approach for Multi-Category Pattern Classification Applied to Network Intrusions Detection K.M. Faraoun, and A. Boukelif particular class give rise to a data distribution of that class in some region of the feature space. It is possible for data distributions of two classes to be either overlapping or non-overlapping in the feature space. A pattern classifier determines the decision boundaries between different classes. The complexity of these boundaries may range from linear to non-linear surfaces. The significance of decision boundaries lies in the fact that they can usually be generated by utilizing representative patterns from each class. The pattern classifier uses these decision boundaries and determines the class for a new pattern. In the present work, we consider the problem of classifying real number vectors form RN, where N is the features number of a given pattern. The basic problem in pattern classification is to develop decision functions that partition the feature space into regions each of which contains sample patterns belonging to a class. Intrusions in computer networks can be traced and detected by collecting information about the traffic in and out of the network. From a pattern classification point of view, the network intrusion detection problem can be formulated as follows: given the information about network connections between pairs of hosts, assign each connection to one out of N data classes representing normal traffic or different categories of intrusions (e.g., Denial of Service, access to root privileges, etc.). It is worth noting that various definitions of data classes are possible. The term "connection" refers to a sequence of data packets related to a particular service, e.g., the transfer of an image via the ftp protocol. The intrusion detection problem can then be viewed as a Multi-category pattern classification problem, when each connection features constitute one pattern to be assigned to one of the N existing classing (depending on the number of intrusions types taken into account). In this paper, an attempt is made to show the use of a new GP-classification approach to perform network intrusion detection. Section 2 gives some theoretic background about genetic programming approaches and related works. The section 3 explains the method developed in the present work with its different elements and parameters. In the section 4, we give a description of the two datasets used for experiments and the codification of the different data elements.
1
Abstract—This paper describes a new approach of classification using genetic programming. The proposed technique consists of genetically coevolving a population of non-linear transformations on the input data to be classified, and map them to a new space with a reduced dimension, in order to get a maximum inter-classes discrimination. The classification of new samples is then performed on the transformed data, and so become much easier. Contrary to the existing GP-classification techniques, the proposed one use a dynamic repartition of the transformed data in separated intervals, the efficacy of a given intervals repartition is handled by the fitness criterion, with a maximum classes discrimination. Experiments were first performed using the Fisher’s Iris dataset, and then, the KDD’99 Cup dataset was used to study the intrusion detection and classification problem. Obtained results demonstrate that the proposed genetic approach outperform the existing GP-classification methods [1],[2] and [3], and give a very accepted results compared to other existing techniques proposed in [4],[5],[6],[7] and [8]. Keywords—Genetic intrusion detection
P
programming,
patterns
classification,
I. INTRODUCTION
ATTERN classification concepts are important in the design of computerized information processing systems for many applications such as remote sensing, medical diagnosis, sonar, radar etc. Pattern classification involves the development of theory and techniques for the categorization of input data into identifiable classes [25]. A pattern class is a category determined by some common attributes. A pattern is the description of any member of a category representing a pattern class. The application determines the measurement of features. Classification typically involves the mapping of an N-dimensional feature vector to one of multiple classes. The N-dimensional feature vector is like a point in the Ndimensional feature space. The samples belonging to a Manuscript received December 29, 2005. K.M. Faraoun is with the Evolutionary Engineering and Distributed Information Systems Laboratory, EEDIS. Djillali Liabbès University. Sidi Bel Abbès – Algeria (Phone: (+213) 75 32 36 50; Fax: (+213) 48 57 77 50; e-mail:
[email protected]). A. Boukelif is with the “Laboratoire des télécommunications et du traitement numérique de signal, équipe de recherche des techniques vidées”. Djillali Liabès University Sidi Bel Abbès – Algeria (email : aboukelif @yahoo.fr)
79
International Journal of Computational Intelligence Volume 3 Number 1
Section 5 summarizes the different obtained results and gives a comparison with the other approaches with discussions. Enhancements of the proposed method are explained in the section 5. The paper is finally concluded with a summary of the most important points and future works.
a leaf node or a sub-tree. Finally, the leaf node or the sub-tree is replaced by a new leaf node or sub-tree generated randomly. Fitness functions ensure that the evolution is toward optimization by calculating the fitness value for each individual in the population. The fitness value evaluates the performance of each individual in the population.
II. THEORY
B. Genetic Programming and Classification Task
A. Genetic Programming Paradigm
Generally, GP trees can perform classification by returning numeric (real) values and then translating these values into class labels [10]. For binary classification problems the division between negative and non-negative numbers acts as a natural boundary for a division between two classes. This means that genetic programs can easily represent binary class problems. While evaluating the GP expression for an input data, if the result of the GP-expression is ≥ 0, the input data is assigned to one class; else it is assigned to the other class. Thus, the desired output D is +1 for one class and is -1 for the other class in the training set. Hence, the output of a GPexpression is either +1 (indicating that the input data belong to that class) or -1 (indicating that the input sample dose not belong to that class). During the genetic evolution of individuals, the best individual is those who correctly classify the maximum of training samples, the positive samples must give a value of +1 for the output, and negative samples must give -1.
Genetic programming is an extension of genetic algorithms [9]. It is a general search method that uses analogies from natural selection and evolution. In contrast to GA, GP encodes multi-potential solutions for specific problems as a population of programs or functions. The programs can be represented as parse trees. Usually, parse trees are composed of internal nodes and leaf nodes. Internal nodes are called primitive functions, and leaf nodes are called terminals. The terminals can be viewed as the inputs to the specific problem. They might include the independent variables and the set of constants. The primitive functions are combined with the terminals or simpler function calls to form more complex function calls. GP randomly generates an initial population of solutions. Then, the initial population is manipulated using various genetic operators to produce new populations. These operators include reproduction, crossover, mutation, dropping condition, etc. The whole process of evolving from one population to the next population is called a generation. A high-level description of GP algorithm can be divided into a number of sequential steps: •
•
• • • •
Given a set of training data DTrain={X1,X2,…..Xp}⊂ RN , a binary classifier is a GP-expression T, so that: T(Xi) ≤ 0 if Xi ∈ Class 1 (D=+1) T(Xi) > 0
Create a random population of programs, or rules, using the symbolic expressions provided as the initial population.
otherwise
(D=-1)
(1)
GP is guided by the fitness function to search for the most efficient computer program to solve a given problem. A simple measure of fitness has been adopted for the binary classification problem:
Evaluate each program or rule by assigning a fitness value according to a predefined fitness function that can measure the capability of the rule or program to solve the problem. Use reproduction operator to copy existing programs into the new generation. Generate the new population with crossover, mutation, or other operators from a randomly chosen set of parents. Repeat steps 2 onwards for the new population until a predefined termination criterion has been satisfied, or a fixed number of generations have been completed. The solution to the problem is the genetic program with the best fitness within all the generations.
Fitness(T) =
Num. samples classified correctly Num. samples used for training
(2)
Each genetic expressing evolved map the samples space of the Xi’s, to the real numbers set R, and attribute the interval ]∞, 0] to the class 1 and the interval ]0,+ ∞ [ to the class 2. This mapping is static, but it can achieve good results for 2category classification problems. Unfortunately, when more than two classes are involved (n-classes problem), finding meaningful division points over the set of reals the genetic programs return is more difficult. If boundary regions are chosen at arbitrary points over the set of reals then genetic programs face the problem of not only containing the necessary elements to distinguish between classes, but also must perform a translation task to provide output in the necessary range pre-specified for a given class. Many alternatives were proposed by many authors to solve this problem.
In GP, crossover operation is achieved firstly by reproduction of two parent trees; two crossover points are then randomly selected in the two offspring trees. Exchanging subtrees, which are selected according to the crossover point in the parent trees, generates the final offspring trees. The obtained offspring trees are usually different from their parents in size and shape. Mutation operation is also considered in GP. A single parental tree is firstly reproduced. Then a mutation point is randomly selected from the reproduction, which can be either
80
International Journal of Computational Intelligence Volume 3 Number 1
In [11], if there are n classes in a classification task, these classes are sequentially assigned n regions along the numeric output value space from some negative numbers to positive numbers by (n-1)*thresholds/boundaries. Class 1 is allocated to the region with all numbers less than the first boundary; class 2 is allocated to all numbers between the first and the second boundaries and class n to the region with all numbers greater than the last boundary n-1, as shown in the following:
⎧classe 1 ⎪ ⎪classe 2 ⎪ Classe (X i ) = ⎨...... ⎪classe n - 1 ⎪ ⎩⎪classe n
C. Related Works The use of genetic programming to solve the multi-category classification and the intrusion detection problems has been attempted in many researches in different ways. In [12], Loveard et al. proposed five methodologies for multi-category classification problems. Of these five methodologies, they have shown that dynamic range selection method is more suitable for multi-class problems. In this dynamic range selection scheme, they record the real valued output returned by a classifier (tree or program) for a subset of training samples. The range of the recorded values is then segmented into regions to represent class boundaries. If the output of the classifier for a pattern falls in the region, then the class is assigned to. Once the segmentation of the output range has been performed, the remaining training samples can then be used to determine the fitness of an individual (or classifier). Chien et al. [13] used GP to generate discriminator functions using arithmetic operations with fuzzy attributes for a classification problem. In [14], Mendes et al. used GP to evolve a population of fuzzy rule sets and a simple evolutionary algorithm to evolve the membership function definitions. These two populations are allowed to co-evolve so that both rule sets and membership functions can adapt to each other. For a C-class problem, the system is run C-times. Kishore et al. [3] proposed an interesting method which considers a class problem as a set of two-class problems. When a GP classifier expression (GPCE) is designed for a particular class, that class is viewed as the desired class and the remaining classes taken together are treated as a single undesired class. So, with GP runs, all GPCEs are evolved and can be used together to get the final classifier for the C-class problem. They have experimented with different function sets and incremental learning. In [15], Durga and Nikhil R. proposed a method to design classifiers for a C-class pattern classification problem using a single run of GP. For a class problem, a multi-tree classifier consisting of C-trees is evolved, where each tree represents a classifier for a particular class. The performance of a multi-tree classifier depends on the performance of its constituent trees. A new concept of unfitness of a tree was exploited in order to improve genetic evolution. Weak trees having poor performance are given more chance to participate in the genetic operations so that they get more chance to improve themselves. In [10], Mengjie and Will proposed two new approaches to ameliorate the performances of genetic classification algorithms. Rather than using fixed static thresholds as boundaries to distinguish between different classes, this approach introduces two methods of classification where the boundaries between different classes can be dynamically determined during the evolutionary process. The two methods are centred dynamic class boundary determination and slotted dynamic class boundary determination. Their obtained results suggest that, while the static class boundary method works well on relatively easy object classification problems, the two dynamic classes boundary determination methods outperform the static method for more difficult, multiple class object classification problems.
if T(X i ) ≤ b1
if b1 ≤ T(X i ) ≤ b 2
(3)
if b n -3 ≤ T(X i ) ≤ b n -2 if b n -2 ≤ T(X i ) ≤ b n -1
In this equation, n refers to the number of object classes, T is the GP-expression evolved, T(Xi) is the output value, and b1, b2, bn-1, bn are static, pre-defined classes boundaries. An alternative approach to static range selection, where ranges are arbitrarily chosen to correspond to class boundaries that all programs for the run must adhere to, is to allow each program to use a separate set of ranges for class boundaries that are dynamically determined for each individual program. Given a classification problem with many training examples and an individual from a GP population it is possible to use a subset of the training examples and record the values that are returned when attributes for specific classes are used as inputs. Based upon these outputs the effectively infinite range of the reals can then be segmented into regions corresponding to class boundaries based upon areas the program has returned values for each class in the subset of training examples, this method was implemented in [11]. The GP employed for classification tasks do however have a requirement for long training times when compared to many other classification methods. It is also often quite difficult to extract a meaningful reason as to why a given class was chosen. Because of these factors the GP method is seen to be applicable to tasks where accuracy is the most important factor in classification, and training times and understand ability are seen as relatively unimportant. The major considerations in applying GP to pattern classification are: • GP-based techniques are data distribution-free, so no a priori knowledge is needed about statistical distribution of the data; • GP can directly operate on the data in its original form; • GP can detect the underlying but unknown relationship that exists among data and express it as a mathematical expression; • GP can discover the most important discriminating features of a class during training phase ; The generated expression can be easily used in the application environment.
81
International Journal of Computational Intelligence Volume 3 Number 1
If the value of T(Y) dose not appears in any set T(DTrainj), we assign Y to the nearest class using the algorithm presented below in the Fig. 4. We can see that the proposed classification method transform the problem from an N-dimensional vectors classification to a 1-dimentional values classification one. The classification of the transformed vectors becomes much easier, but this is assured if a maximum discrimination exist between the sets T(DTraini). It is role of the genetic programming system to assure such criteria, the fitness of each transformation T depend on its ability to give a maximum discrimination between the T(DTraini)’s. There is a trade-off between the generality and power of this classification approach search. To perform a relatively unbiased search and allow the saliencies of the problem to emerge the proposed approach has many degrees of freedom in its representation of the solution. Rather than evolve the class predictors directly and further encumber the genetic program, features are evolved which are then passed to a simple classifier. This hybrid approach assists the global search of the genetic program with the local search of the simple classifier. The classifier, with its malleable decision boundaries, performs local tuning of the solution to compensate for the genetic program’s difficulty with evolving constants. In the following, we present the different steps of the classification approach: the learning phase, witch consist to search for the best transformation of the raining data DTrain , and the test phase that classify each test sample from a set of new vectors DTest.
The mentioned approaches were tested on different dataset publicly available, like the IRIS dataset, the Cancer dataset, the Australian Credit Card and the Fisher’s Iris data or the Heart Disease datasets, witch are relatively very small and limited compared to the intrusion detection problem ones. The most important work on GP-classification for intrusion detection is the one presented in [1] by Dong Song, where a Page-based Linear Genetic Programming is implemented with a two-layer Subset Selection scheme to address only the twoclass intrusion detection classification problem, the same author introduce and hierarchical RSS-DSS algorithm for dynamically filtering large datasets to enhance the system performances in [2]. Less important works can be found in [16], [17] with the Chimera model, and [18]. III. PROPOSED GP-CLASSIFICATION APPROACH The present work propose a new approach of a dynamic GP-based classifier witch consist of genetically coevolving a population of non-linear transformations on the input data to be classified, and map them to a new space with a reduced dimension (1-D), in order to get a maximum inter-classes discrimination. Let DTrain={X1,X2,…..Xp}⊂ RN be the set of training data. Because the proposed approach belongs to the supervised learning category, each sample Xi can be labelled with its class identifier j and become Xij. The set DTrain can then be subdivided into n sub-set corresponding to n learned classes, such that:
D Train =
j U D Train
,
j≤ n
{
}
j j j D Train = X i ∈ D Train / class(X i ) = j
(4)
A. The Learning Phase
1. Terminals and Functions The GP-transformations are built using a terminal set Tr and a function set Fn. The terminals are the fields of the used training dataset: Tr={V1,V2,….,VN}, in addition, we also used constants as terminals. These constants are randomly generated using a uniform distribution. To be consistent with the feature terminals, we also set the range of the constants as [-100, 100]. The functions set include: • Arithmetic operators: +, -, /, *, ^; • Non-linear functions: Sin ,Cos ,Ln , Log ,Exp ,Tan;
The output value for each sample from the each training sample is computed using the GP-expression T, this allows to compute the transformed map for each sub-set DTrainj , using the GP-expression T, T(DTrainj) given by: j
{
j
j
j
T(D Train ) = Y = T(X i ) / X i ∈ D Train
}
(5)
The classification approach assign to each class j, the region covered by the set T(DTrainj). When a new sample Y is presented to the classifier, the corresponding class is deduced according to the following: ⎧classe 1 if ⎪ ⎪ ⎪classe 2 if ⎪ Classe (Y) = ⎨...... ⎪ ⎪classe n - 1 if ⎪ ⎪classe n if ⎩
The +, - , and * operators have their usual meanings: addition, subtraction and multiplication, while / represents “protected” division which is the usual division operator except that a divide by zero gives a result of zero. Each of these functions takes two arguments. The transformations Ti is represented by hierarchical S-expressions trees, like proposed in the standard Koza implementation.
T(Y ) ∈ T(D1Train ) 2 T(Y ) ∈ T(D Train )
(6)
2. The Fitness Function
n -1 T(Y ) ∈ T(D Train )
For a given training set DTrain⊂ RN, the genetic programming system evolves a population of transformations T. In order to compute the fitness of each one, we need to define a distance between the mapped sets T(DTraini).
n T(Y ) ∈ T(D Train )
82
International Journal of Computational Intelligence Volume 3 Number 1
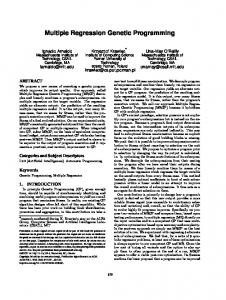
The value of the fitness must express the inter-classes discrimination and separation. During our experiments, we have tested many fitness measurements, such as the Maximum distance between gravity centres of the mapped classes and the inter-classes and intra-classes variance criterion. But theses functions assume that the transformed sets T(DTraini) must be homogeneous and linearly separable, this condition is not always easy to achieve, so it can be better to give to the classification system the ability to generate separated but alternate transformed sets. The Fig. 1 illustrate the two situations: (a) represent two pointes sets linearly separable (in a one dimensional space), and (b) show two separated pointes sets but in an alternated situation. For this reason, we have proposed a new fitness function formula, witch try to minimize the total intersection between point sets, and search for a minimum number of common points between the mapped classes. The fitness function is inversely proportional to the computed number of common points between transformed sets T(DTraini). Height values of the fitness signify that the transformed sets have a very small intersection region, and then the discrimination between each set elements become easier. The fitness value is computed by: Card( Fitness(T) =
I T(D iTrain ))
i≤ n
Card(T(D Train ))
During the evolution process, the result of each transformation Ti is bounded in a fixed interval ( [-100,100] by default), to avoid to have scatter sets in R. The result of the genetic evolution during the training phase is the best generated transformation T, with the transformed sets T(DTraini). This output is used in the test phase to classify new samples.
B. The Test Phase: Classification of Unseen Samples Let DTest={Y1,Y2,…,Yk} be a new set of samples to be classified. Each vector Yi∈DTest must be assigned to one of the n involved classes. To accomplish this task, the classification system operates like the following: First, a post-treatment algorithm is added to the classification system to compute a density array for the points of T(DTrain). This array is used with the transformation T during the test phase to deduce the class of each elements Yi form DTest. This algorithm is presented like the following (Fig. 2): Let T(DTrain) be the training Set; Dens: array of density for T(DTrain) elements; For each element p∈ T(DTrain) do {For each sample X ∈ DTrain do {For each class i (i form1 to n) do {if (classe(X)=i)and(T(X)=p) then Dens[p,i]:= Dens[p,i]+1;} } }
(7)
Fig. 2 A Post-treatment algorithm to generate density array, used during the testing phase TABLE I SET OF PARAMETERS USED TO CONTROL THE GENETIC EVOLUTION PROCESS
Parameter Generating constant probability Generating functions probability Crossover rate Pc Mutation rate Pm Population size Maximum generations count Maximum individual’s length Minimum individual’s length Selection strategy Functions set
Fig. 1 The two possible separation situations between two point sets
When the function Card(X) gives the cardinality of a given set X. The performed experiments show that this function give the best classification rates with respect to other fitness function mentioned above. 3. Genetic Operators and Parameters The standard crossover and mutation operators presented in the section 1.1 are used in this implementation. Each transformation T is represented by a binary tree and the genetic operators produce always valid binary expressions. To control the maximum depth of the generated expressions, we use a modifiable parameter to control the length of the generated expressions. The genetic evolution process stop when it reach a given generations count (termination criteria). The Table I gives an overview of the parameters used in our implementation and the default value used for each one.
Terminals set
Value 5% 70% 70% 10% 100 1000 350 30 Roulette selection {+, - ,/ ,*, sin, cos, log, ln, tan, exp } [-100,100]∪ {input variables}
Then, for each new sample Yi form DTest, the corresponding class is determined using the following algorithm (Fig. 3):
83
International Journal of Computational Intelligence Volume 3 Number 1
Hence, pre-processing was required before pattern classification models could be built. Pre-processing consisted of two steps: first step involved mapping symbolic-valued attributes to numeric-valued attributes and second step implemented scaling. In the present work, we have used the data codification and scaling presented in [21]. All the resulting scaled fields belong to the interval [0, 1].
Let Y be any new sample from DTest; Ne: the nearest point from T(DTrain) to T(Y); Max: a height random value; Class_Y: the deduced class for the sample Y; For each element p∈ T(DTrain) do {d:=Distance (T(Y), p); If dDens(p,Class_Y) then {Class_Y:=classe(p); Ne:=p} } }} Result := Class_Y;
TABLE II DISTRIBUTION OF THE NORMAL AND ATTACK RECORDS IN THE USED TRAINING AND TESTING SETS Training Set Testing Set 11673 47.09 % 60593 19.48 % Normal 7829 31.58 % 229853 73.90 % DOS 4107 16.56 % 4166 1.34 % PBR 1119 4.51 % 16347 5.25 % R2L 52 0.24 % 70 0.02 % U2R
The Table III summarizes the 41 fields used in the KDD99 dataset regrouped in three mentioned categories. Each field is labelled with a symbolic notation (F1, F2,…, F41) to be used as terminals during the genetic process. All tests were performed on an Intel-Pentium 4 CPU 2.66Ghz with 256 Mb Ram size. The performances of intrusion detection for the classifier are computed using the following expressions:
Fig. 3 The proposed algorithm to deduce the class of new test samples Yi, used during the testing phase
As shown by the experiments, these algorithms combined with the fitness function mentioned above, give much better results than using classical fitness measurement, this is due to the flexibility of the classes distribution accorded to the genetic classification system.
False negatives number Total Number of Attaks False Positives False positive rate FP = Total Number of normal connections Detection rate DR = 1 -
IV. DATASETS AND EXPERIMENTS The proposed classification approach is benchmarked using two different datasets: the Fisher IRIS [19] dataset and the MIT KDD99 dataset [20]. The first one is used just for comparison purpose, and to demonstrate the proposed method capabilities, it is relatively very small and limited compared to the intrusion detection problem datasets. The second one concerns our problem of interest: the network intrusion detection. The KDD99 dataset is the most used one for intrusion detection problems, collected at the Lincoln Laboratory of MIT, under DARPA sponsorship, witch consists of about 5,000,000 connection records, with 41 data fields. The most important work on GP-classification using the KDD99 dataset is the one presented in [1, 2] by Dong Song, where a Page-based Linear Genetic Programming is implemented with a two-layer Subset Selection scheme to address only the two-class intrusion detection classification problem. The first IRIS dataset was divided equally into a training set and a test validation set. The specific training sets for Iris setosa, versicolor and viginica are derived from the training set. To perform the experiments with the KDD99 dataset, the ’10% KDD’ set was sampled and only 24788 records are used to train our system. For the test purposes, we use the whole ’Corrected (Test)’ used in almost all the implemented approaches. The Table II lists the class’s distributions of our used sets. Attributes in the KDD datasets had all forms :continuous, discrete, and symbolic, with significantly varying resolution and ranges. Most pattern classification methods are not able to process data in such a format.
(8.a) (8.b)
TABLE III THE KDD99 USED FEATURES, GROUPED IN 3 CATEGORIES Basic features of individua Traffic features computed using a l TCP connections two-second time window duration protocol_type service flag src_bytes dst_bytes land wrong_fragment urgen
F1 F2 F3 F4 F5 F6 F7 F8 F9
Count srv_count serror_rate srv_serror_rate rerror_rate srv_rerror_rate same_srv_rate diff_srv_rate srv_diff_host_rate dst_host_count dst_h_srv_count dst_h_same_srv_rate dst_h_diff_srv_rate dst_h_s_src_port_rate dst_h_srv_diff_h_rate dst_h_serror_rate dst_h_srv_serror_rate dst_h_rerror_rate dst_h_srv_rerror_rate
F23 F24 F25 F26 F27 F28 F29 F30 F31 F32 F33 F34 F35 F36 F37 F38 F39 F40 F41
Content features suggested by domain knowledge hot num_failed_logins logged_in num_compromised root_shell su_attempted num_root
84
F10 F11 F12 F13 F14 F15 F16
num_file_creations num_shells num_access_files num_outbound_cmds is_hot_login is_guest_login
F17 F18 F19 F20 F21 F22
International Journal of Computational Intelligence Volume 3 Number 1
The following table (Table VII) give a comparison between the detection rate obtained with different classifiers as presented in [24, 3], and our proposed classification approach.
V. RESULTS AND COMPARISON
This section presents the results of the proposed GP classification approach for the 2 n-classes pattern classification problems described above, using the set of parameters presented in the Table I.
TABLE VII A SUMMARY OF THE DETECTION RATES OBTAINED USING DIFFERENT CLASSIFIERS FOR THE FISHER’S IRIS DATASET Method Classification rate 96 % NN 96 % Naive Bayse 94.667 % Bayse Net 94.67 % C4.5 96 % GPCE [3] 97.3 % Maximum likelhood 98.6 % Proposed GP-classification
A. Fisher IRIS Classification Problem The dataset was divided equally into a training set and a test validation set (75 samples in each set). The result of each test is a classification matrix C computed by the algorithm presented in Fig.4. The classification rate is then computed using the following expression: CR =
Number of samples classified *100 Number of samples used for training
The Fig. 5 show the distribution of the transformed training set T(DTrain) obtained with this transformation.
(9)
Let T(DTest) be the training Set; n is the number of classe i is the true class of the sample and k is the assigned class. For i=1 to n do For j=1 to n do { C[i,j]:=0 For i=1 to Card(T(DTtest)) do {Apply the classifier and assign class k to input sample; C[i,k]:=C[i,k]+1; }}
Fig. 5 Distribution of the transformed training set T(DTrain) of the best obtained individual
From Table VII, we can see that our proposed approach give best classification rate compared to other proposed approaches, one sample only from the “Viginica” set is misclassified.
Fig. 4 The algorithm used to compute the classification matrix
Table IV gives the classification matrix obtained using the proposed approach. Tables V and VI give the results of the classification process using a maximum likelihood classifier and a GP-based classification approach proposed in [3].
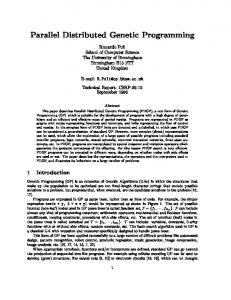
B. KDD99 Dataset: The Intrusion Detection Problem As we see in the Table I, the KDD99 dataset is more voluminous than the Iris fisher’s one, and contain more classes (5 classes). Discrimination is also very difficult in the intrusion detection case because the classes are not clearly separable, so the classification task will become harder. To evolve the GP classification system, the same parameters set presented in the Table I is used. In the Table VIII, we present the classification matrix obtained. The Figs. 6 and 7 illustrates the transformed training set T(DTrain) repartition, and the fitness value evolution during the GP evolution. The best individual T is presented by the following expression:
TABLE IV CLASSIFICATION MATRIX FOR GPCE WITH INTERLEAVED TRAINING SETS FOR IRIS DATA [3] Setosa Versicolor Viginica Setosa 25 0 0 Versicolor 0 24 1 Viginica 0 2 23 TABLE V OBTAINED CLASSIFICATION MATRIX USING THE PROPOSED APPROACH Setosa Versicolor Viginica Setosa 25 0 0 Versicolor 0 25 0 Viginica 0 1 24
T: ((((log2(tan(-(F3))))*(cos((tan((F5)+(((log2(tan((F3))))*(((log2(tan(-(F3))))*(F30))+(cos(F5))))* ((tan(F13))+(F30)))))+((tan(log2(F2)))+(F30)))))*(cos(F5)))*( (18)+(cos((tan(log2(F13)))+(F30)))))
TABLE VI CLASSIFICATION MATRIX FOR IRIS DATA SET WITH MAXIMUM LIKELIHOOD CLASSIFIER [3] Setosa Versicolor Viginica Setosa 25 0 0 Versicolor 0 24 1 Viginica 0 2 23
85
International Journal of Computational Intelligence Volume 3 Number 1
We can see from the presented results that the proposed classification approach give very acceptable results compared to the other techniques. The highest detection rate is obtained using support vectors machine technique implemented in [7], but with a very height false positive rate (10 %) compared to 1.35% obtained with our proposed GP-classification approach. It is reasonable to state that the set of pattern recognition and machine learning algorithms mentioned above offered an acceptable level of misuse detection performance for only two attack categories, namely Probing and DoS when tested on the KDD data sets, and failed to demonstrate an acceptable level of detection performance for the remaining two attack categories, which are U2R and R2L. To enhance the detection capabilities of our classification system, especially for the two categories R2L and U2R, we propose in the following an improvement of the proposed classification approach using a multi-transformation approaches. The obtained results demonstrate that the capabilities can be highly ameliorated compared to the standard approach.
TABLE VIII CLASSIFICATION MATRIX OBTAINED USING THE PROPOSED APPROACH Normal Prob Dos U2R R2L % Normal Probe Dos U2R R2L % Correct
59769 562 8411 25 10612 75.29 %
500 3443 768 11 2107 50.42 %
112 113 220662 6 8 99.89 %
49 3 0 19 2059 0.89 %
163 45 11 9 1611 87.60 %
98.64 % 82.65 % 96.00 % 09.82 % 27.14 %
Fig. 6 Distribution of the transformed training set T(DTrain) of the best individual
The following values of detection rate and the false positive rates were computed for the best obtained individual T: Detection rate:
V. GP CLASSIFIER ENHANCEMENT: THE MULTITRANSFORMATIONS CLASSIFICATION
DR = 0.925 (92.5 %)
False positive rate FP = 0.0135 (1.35 %)
A. Method Description As explained in the section 2. the classification system use a single transformation (the best obtained individual) to transform each new sample, and then deduce the corresponding class using the algorithm presented in the figure 4. The main idea of the multi-transformation system is to use a set of multiple transformations TRset ={T1,T2,….,Tp}obtained genetically (the best ones) on the sample to be classified. Each transformation will output a corresponding class with a confidence factor for each sample Y from the testing dataset computed using the following expression: Dens(Ne, Class_Y) Confidence (Y, T) = * Fitn(T) (10) Class_Y Card(T(D Train ))
Classification rate = 91.7 %
Fig. 7 Evolution of the fitness value during the genetic process
The Table IX summarize and compare the detection rates and false positive rates obtained using the approaches mentioned above, and some recent results on KDD benchmark presented in [7]and [8]. All the mentioned approaches were tested using the ’Corrected (Test)’ set of the KDD99 cup competition.
when : - Ne is the nearest point from the T(D Train ) set;
- Class_Y is the deduced class for the sample Y Class_Y
- Card(T(D Train
TABLE IX COMPARISON OF THE DETECTION PERFORMANCES BETWEEN THE PROPOSED APPROACHES AND THE EXISTING TECHNIQUES Classification method Detection False Alarm rate rate GP-classifier (proposed) 92.5 % 1.35 % KDD99 wining entry[5] 91.0 % 0.50 % KDD99 second place[6] 91.5 % 0.58 % Linear GP classifier [1,2] 90.8 % 3.26 % Data-mining techniques [22] 70%-90% 2.00 % Support vector machine[7] 10.00 % 98.0 % Self organized Maps [8] 89.0 % 4.60 % Clustering techniques [7] 93.0 % 10.00 % K-nearest neiberhood [7] 91.0 % 8.00 %
)) is the number of the samples
from the training set belonging to Class_Y. - Fitn(T) is the fitness value of the transformation T - Dens(Ne, Class_Y) is the density value computed by the algorithm of Fig.3 It is clear from the equation (10) that the confidence factor of a given sample in relation to a transformation Ti range in the interval [0, 1]. All the mentioned parameters are taken from the algorithm of the Fig. 4. The equation (10) was introduced in the algorithm like the following (Fig. 8):
86
International Journal of Computational Intelligence Volume 3 Number 1
Let Y be any new sample from DTest; Ne: the nearest point from T(DTrain) to T(Y); Max: a height random value; Class_Y: the deduced class for the sample Y; For each element p∈ T(DTrain) do {d:=Distance (T(Y), p); If dDens(p,Class_Y) then {Class_Y:=classe(p); Ne:=p} } } Confidence(Y, T) := Dens(Ne,Class_Y) /Card(T(Dtrainclass_y) ; Ret_Class(Y,T) :=Class_Y ;
B. Results and Comparison This section summarize the results obtained using the multitransformations classification system described above to detect and classify the intrusions in the KDD99 dataset. The test phase use the KDD99 ’Corrected (Test)’ set. The number of transformations p used in this experiment is fixed to 50 transformations collected during the learning phase realised by the genetic process. The following results give the average accuracy obtained for 40 GP trials conducted on the input training set. The classification rates, detection rates and the false positive rates were computed in each GP trial. The Fig. 10 show the variations of the detection rate for each class with respect to the number of used transformation, it is clear that better classification rates are allowed for the two classes R2L and U2R. The classification is ameliorated when augmenting the number of the used transformations. For the classes Normal and Dos, the maximum classification performances are reached starting form 6 or 7 transformations. By the same way, it can be seen from the Figure 11 that the system reaches its maximum performances when the number of used transformations is maximum (a higher detection rate and a lower false positive rate). The Table X illustrates the classification matrix obtained with the best GP-trail using the multi-transformation method to classify the intrusions of the used KDD99 Test dataset with 50 collected transformations. The performances rates obtained by the obtained solution are given by: Detection rate DR = 0.980 (98.0%)
Fig. 8 The modified version of the algorithm used to deduce the class of new test samples, and compute their confidence factor
This algorithm return for each sample Y, its corresponding class Ret_Class(Y, T), with the corresponding confidence factor Confidence(Y,T). The new classification system take the best individuals collected during the genetic evolution to construct a transformations set TRset ={T1,T2,….,Tp}. All this transformations are applied on each test sample Y during the testing phase to obtain p possible class and p corresponding confidence factor. These obtained outputs are combined to compute the membership factor of Y to each class c from the existing n classes using the following algorithm (Fig. 9):
False positive rate FP = 7E-4 (0.07%)
Membership(Y,c):=0; For each transformation Ti from TRset do {If Ret_Class(Y,Ti) = c then Membership(Y,c):= Membership(Y,c) +Confidence(Y,Ti);} Membership(Y,c):= Membership(Y,c) / p;
Classification rate = 99.05 % TABLE X CLASSIFICATION MATRIX OBTAINED USING THE MULTI-TRANSFORMATIONS METHOD WITH 50 TRANSFORMATIONS Normal Prob Dos U2R R2L % Normal Probe Dos U2R R2L
Fig. 9 The algorithm proposed to compute the membership factor of a sample Y to a given class c
It is clear from the formulas used above that the value of the membership factor range always in the interval [0, 1]. The classification system assigns to Y the class with the highest membership factor: Class(Y) = c such that : Confidence(Y, c) = MAX(confidence(Y, i)) 1≤i≤ n
% Correct
60550 93 1792 21 2973
21 4053 911 6 154
10 4 8 15 0 5 227117 15 18 2 38 3 21 85 13114
92.54 %
78.77 99.97 26.7 99.74 % % % %
99.93 % 97.29 % 98.81 % 45.20 % 80.22 %
In the Table XI, obtained classification rates using the multi-transformations classification system are compared to the results presented in [23] using multiple classification systems such as Multilayer perceptron (MLP), Gaussian classifier (GAU), nearest cluster algorithm (NEA), incremental radial basis function, K-means clustering (KM), C4.5 decision tree and many other techniques. The results shows that classification rates obtained using the multitransformations classification system for the two classes R2L and U2R are very satisfactory with respect to the other techniques.
(11)
This method benefit from the detection capabilities of each transformation T from the generated set TRset, it act like a rule system that average the obtained decisions to elaborate the final one. The following results demonstrate the improvement achieved by this technique compared to the single transformation one.
87
International Journal of Computational Intelligence Volume 3 Number 1
The false positives detection rate of each attack class is not available for the SOM [8] and the linear GP [1, 2] techniques, since they are 2-category classifiers (normal and attack), their false positive rates can be given only in term of whole attacks classification.
Fig. 10 Evolution of the detection rate for each attack class with respect to the number of applied transformation: (a) Normal, (b) Dos, (c) Prob, (d) R2L and (e) U2R TABLE XI COMPARISON OF THE CLASSIFICATION RATES OBTAINED WITH DIFFERENT TECHNIQUES USING THE 4 ATTACK CLASSES OF THE KDD99 DATASET Classification method Dos Prob KDD cup Winner [4] Agrawal and joshi [26] GP 1-transformation multi-transformations SOM map [8] Linear GP [1,2] Multilayer perceptron[23] Gaussian classifier[23] K-means clustering[23] Nearest cluster[23] Radial basis function [23] Leader algorithm [23] Hypersphere algo.[23] Fuzzy ARTMAP [23] C4.5 decision tree [23]
DR
FP
DR
FP
0.971 0.969 0.960 0.988 0.951 0.967 0.972 0.824 0.973 0.971 0.730 0.972 0.972 0.970 0.970
0.003 0.001 7E-4 1E-4 0.003 0.009 0.004 0.003 0.002 0.003 0.003 0.003 0.003
0.833 0.730 0.826 0.972 0.643 0.857 0.887 0.902 0.876 0.888 0.932 0.838 0.848 0.808 0.808
0.006 8E-5 0.010 0.003 0.004 0.113 0.026 0.005 0.188 0.003 0.004 0.007 0.007
DR
FP
DR
FP
0.084 0.107 0.271 0.802 0.113 0.093 0.056 0.096 0.064 0.034 0.059 0.001 0.010 0.037 0.046
5E-5 8E-4 7E-4 1E-4 1E-4 0.001 0.001 1E-4 0.003 3E-5 5E-5 4E-5 5E-5
0.123 0.066 0.100 0.452 0.229 0.013 0.132 0.228 0.298 0.022 0.061 0.066 0.083 0.061 0.018
3E-5 4E-5 0.006 3E-4 5E-4 0.005 0.004 6E-6 4E-4 3E-4 9E-5 1E-5 2E-5
Classification method KDD cup Winner [4] Agrawal and joshi [26] GP 1-transformation multi-transformations SOM map [8] Linear GP [1,2] Multilayer perceptron[23] Gaussian classifier[23] K-means clustering[23] Nearest cluster[23] Radial basis function [23] Leader algorithm [23] Hypersphere algo.[23] Fuzzy ARTMAP [23] C4.5 decision tree [23]
88
R2L
U2R
International Journal of Computational Intelligence Volume 3 Number 1
(byte) at maximum, and can be easily transformed to an assembly routine and evaluated using a stack base schema, to be integrated in a real time detection system. In terms of future work, the proposed classification approach can be extended to map the classes to a higher dimensionality space (especially for the 2D and 3D spaces). That is to say, a population of combinations of transformation is evolved for the training dataset to get the optimal combination witch project the data to the specified space of dimensionality p. For example, in the 2D case, each individual is a couple that project each sample Xi from RN to R2 like the following:
In the present work, the multi-transformations classification system requires approximately 1 hour and 48 minutes to generate a set of 50 optimal transformations, when addressing the problem of intrusions classification using the mentioned KDD99 dataset. Compared to other existing solutions, the proposed classification approach represents the potential to achieve best classification performances in shorter training time like illustrated in the Table XII. TABLE XII COMPARISON OF THE TIME AND SOLUTION COMPLEXITY OF DIFFERENT CLASSIFICATION METHODS Classification Training time Solution complexity method KDD best entry 500 decision tree ≈ 24 Hours KDD 2nd place 755 decision tree ≈ 22 Hours Linear GP [2] ≈ 7 Hours and A linear program with 86 instruction in 2 address format 30 m GP with Multi≈ 1 Hours and 50 transformation with an average transformation length of 150 character 48m
T(X i ) =< T1 , T2 > (X i ) = (y1 , y 2 )
(12)
⎧ y1 = T1 (X i ) such that ⎨ , (y1 , y 2 ) ∈ ℜ 2 ⎩ y 2 = T2 (X i )
The same principal can be used for any p-dimensional space. Such approach has the potential to reduce the information loss due to the transformation operation, since a higher dimension can handle more information and relationship between the different initial components. Another important advantage is the possibility to generate a graphical visualisation of the transformed data (in the 2D or 3D case) witches allow to have different possible profiles of the classes’ distribution, and to give some interpretations like inter-classes proximity and intersections.
VII. CONCLUSION AND FUTURE WORK In this work, a new Genetic Programming classification system with a dynamic class’s projection was implemented and tested on both Fisher’s Iris dataset and the KDD'99 benchmark dataset, a problems involving a multi-category classification task. To do so, populations of non-linear transformations are evolved to transform the input training data to be classified to a new one dimensional space with a maximum discrimination between the projected classes. The classification task become much easier with the transformed data and the new testing samples are then transformed with the generated transformation and assigned to their corresponding class using a simple search algorithm (Figure 4). The technique is independent of the dataset and structure of GP employed. Moreover, the framework has no specialist hardware requirements, making use of the generic classifiers design already widely supported in computing systems. The proposed system is shown to be capable of learning attack and normal behaviour from the training data and make accurate predictions on the test data, which also contains new attacks that the system was not trained on. In order to enhance the classification performances, especially for some bad handled categories, a multitransformation system was implemented and tested to combine the classification decisions of a large transformations set. The obtained results show that the proposed system can achieve much better classification performances, without significant increasing of the learning and detection run time. The study of our proposed method shows that higher number of combined transformations will enhance significantly the system performances. In comparison to artificial intelligence approaches currently proposed, the approach provides competitive performance whilst utilizing a relatively small set of training samples. The time complexity of the approach is independent from the number of used fields and is very acceptable in relation to the other approaches (Table XII). The complexity of the generated solution is reduced in comparison to the solutions of other techniques. Each transformation is represented as a string with 150 characters
REFERENCES [1]
[2]
[3] [4] [5] [6] [7]
[8] [9] [10]
89
Dong Song, Malcolm I. Heywood, and A. Nur Zincir-Heywood. "Training Genetic Programming on Half a Million Patterns: An Example from Anomaly Detection", IEEE Transactions on Evolutionary Computation, 9(3), pp 225-240, 2005 Dong Song, Malcolm I. Heywood, and A. Nur Zincir-Heywood. “A Linear Genetic Programming Approach to Intrusion Detection ». E. Cantú-Paz et al. (Eds.): GECCO 2003, LNCS 2724, pp. 2325–2336, 2003. © Springer-Verlag Berlin Heidelberg 2003 J. K. Kishore, L. M. Patnaik, V. Mani, and V. K. Agrawal, “Application of genetic programming for multicategory pattern classification,” IEEE Trans. Evol. Comput., vol. 4, pp. 242–258, Sept. 2000. Pfahringer B.: Winning the KDD99 Classification Cup: Bagged Boosting. SIGKDD Explorations. ACM SIGKDD. 1(2) (2000) 65- 66 Levin I.: KDD-99 Classifier Learning Contest LLSoft’s Results Overview. SIGKDD Explorations. ACM SIGKDD. 1(2) (2000) 67- 75 Vladimir M., Alexei V., Ivan S.: The MP13 Approach to the KDD'99 Classifier Learning Contest. SIGKDD Explorations. ACM SIGKDD. 1(2) (2000) 76-77 Eskin E., Arnold A., Prerau M., Portnoy L., and Stolfo S. A Geometric Framework for Unsupervised Anomaly Detection: Detecting intrusions in unlabeled data. In D. Barbara and S. Jajodia, editors, Applications of Data Mining in Computer Security. Kluwer, 2002. ISBN 1-4020-70543, 2002. Kayacik G., Zincir-Heywood N., and Heywood M. On the Capability of an SOM based Intrusion Detection System. In Proceedings of International Joint Conference on Neural Networks, 2003. Koza, J. R. 1994. Genetic Programming II: Automatic Discovery of Reusable Programs. The MIT Press. Mengjie Zhang and Victor Ciesielski. Genetic programming for multiple class object detection. In Norman Foo (editor), Proceedings of the 12th Australian Joint Conference on Artificial Intelligence, Volume 1747, Lecture Notes in Artificial Intelligence, pages 180–191. Springer, Heidelberg, Dec 1999.
International Journal of Computational Intelligence Volume 3 Number 1
[11] Mengjie Zhang, Will Smart. “Multiclass Object Classification Using Genetic Programming“. Technical Report CS-TR-04/2, Feb 2004, School of Mathematical and Computing Sciences, Victoria University. [12] Loveard, T. & Ciesielski, V. Representing classification problems in genetic programming, in 'Proceedings of the Congress on Evolutionary Computation', Vol. 2, IEEE Press, COEX, World Trade Center, 159 Samseongdong, Gangnam-gu, Seoul, Korea, pp. 1070—1077 (2001). http://goanna.cs.rmit.edu.au/toml/cec2001.ps [13] B.-C. Chien, J. Y. Lin, and T.-P. Hong, “Learning discriminant functions with fuzzy attributes for classification using genetic programming,” Expert Syst. Applicat., vol. 23, pp. 31–37, 2002. [14] R. R. F. Mendes, F. B.Voznika, A. A. Freitas, and J. C. Nievola, “Discovering fuzzy classification rules with genetic programming and co-evolution,” in Lecture Notes in Artificial Intelligence, vol. 2168, Proc. 5th Eur. Conf. PKDD, 2001, pp. 314–325. [15] Durga Prasad Muni, Nikhil R. Pal, Senior Member, IEEE, and Jyotirmoy Das, “A Novel Approach to Design Classifiers Using Genetic Programming », ieee transactions on evolutionary computation, vol. 8, no. 2, pp. 183-196. April 2004. [16] Crosbie, Mark and Spafford, Gene, Applying Genetic Programming Techniques to Intrusion Detection, In Proceedings of the AAAI 1995 Fall Symposium, November 1995. [17] Bob Adolf . New Paradigms for Intrusion Detection Using Genetic Programming. Technical report January 2004. [18] Cosbie M. Gene Spafford. Applying genetic programming to intrusion detection October 1998. In procedding of the 18 th NISSC Conference October 1998. [19] R. A. Fisher, “The use of multiple measurements in taxonomic problems,” Ann. Eugenics, pt. II, vol. 7, pp. 179–188, 1936. [20] KDD data set, 1999; http://kdd.ics.uci.edu/databases/ kddcup99/kddcup99.html, cited April 2003 [21] C. Elkan, “Results of the KDD’99 Classifier Learning”, SIGKDD Explorations, ACM SIGKDD, Jan 2000. [22] Lee W. and Stolfo S. A Framework for Constructing Features and Models for Intrusion Detection Systems. Information and System Security, 3(4):227–261, 2000. [23] Application of Machine Learning Algorithms to KDD Intrusion Detection Dataset within Misuse Detection Context, Maheshkumar Sabhnani, Gursel Serpen, Proceedings of the International Conference on Machine Learning, Models, Technologies and Applications (MLMTA 2003), Las Vegas, NV, June 2003, pages 209-215. [24] Ayse Küçükyılmaz; Pattern Classification: A Survey and Comparison. Department of Computer Engineering, Bilkent University, 06800, Ankara, Turkey. http://www.cs.bilkent.edu.tr/~guvenir/ courses/cs550/ Workshop/Ayse_Kucukyilmaz.pdf . April 7, 2005 [25] Anil K. Jain, Robert P.W. Duin, and Jianchang Mao, Statistical pattern recognition: a review, IEEE Transactions on Pattern Analysis and Machine Intelligence, Vol. 22. No. 1, pp. 4-37, January 2000. [26] R. Agarwal, and M. V. Joshi, “PNrule: A New Framework for Learning Classifier Models in Data Mining”, Technical Report TR 00-015, Department of Computer Science, University of Minnesota, 2000.
A. Boukelif received a bachelor of science in electrical engineering from the University of Pittsburgh and a Ph.D. honours degree in electrical engineering, image processing option. He is currently an assistant professor at the University of Sidi Bel Abbes and head of a research team dealing with information and communication technologies applied to distant learning. His main research areas include digital television , digital image compression, satellite communications information and communication technologies (ICTs ). He is the author of many publications, including HDTV (Centre National des Etudes en Telecommunications, Paris, 1994), Digital Television Techniques (Masson and Paris, 1997), and Image Compression Techniques (Algiers, 2004). Prof. Boukelif is a member of the Telecommunication and digital signal processing laboratory at the Sidi bel abbes university.
K.M. Faraoun was born in Sidi Bel abbes, Algeria, in February 23, 1978. He received his master’s degree in computer science at the computer science department of Djilali Liabbes University- Sidi-Bel-abbes – Algeria in 2002. His current research areas include computer safety systems; genetic algorithms, fractal images compression evolutionary programming and grammatical inferences and physical materials structures modeling. He is currently a teacher at the computer sciences Institute of Djilali Liabess University, he teaches operational researches and human-machine interaction, and is actually preparing his Ph.D thesis in the field of computer security using artificial intelligence systems. He has published several papers in international journals: Genetic Fractal images compression (Multidimensional Systems and Signal Processing, Springer Science 2005). Dr. Faraoun is a member of the Evolutionary Engineering and Distributed Information Systems Laboratory, EEDIS.
90