A Genetic Programming Approach to Business Process Mining Chris J. Turner
Ashutosh Tiwari
JÖrn Mehnen
School of Applied Sciences Cranfield University Bedfordshire, MK43 0AL, UK
School of Applied Sciences Cranfield University Bedfordshire, MK43 0AL, UK
School of Applied Sciences Cranfield University Bedfordshire, MK43 0AL, UK
[email protected]
[email protected]
[email protected]
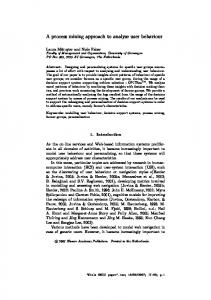
software process models. The first use of process mining in the context of business processes was made by Agrawal et al. [3]. The mining technique developed by [3] reconstructed process models from the event logs produced by the IBM Flowmark system. The aim of process mining is to identify and extract process patterns from data logs to reconstruct an overall process flowchart, an example is shown in Figure 1. The data logs, more commonly known in the business process field as event logs, contain execution data for a live process (an excerpt from an event log, used in this papers experiment set, is shown at the end in Figure 8). Such event logs may be hosted within Business Process Management (BPM) and workflow systems, owned by medium and large organisations; recording the task by task completion of computer assisted processes. In some organizations event logs will be hosted by Enterprise Resource Planning (ERP) systems [2].
ABSTRACT The aim of process mining is to identify and extract process patterns from data logs to reconstruct an overall process flowchart. As business processes become more and more complex there is a need for managers to understand the processes they already have in place. To undertake such a task manually would be extremely time consuming so the practice of process mining attempts to automatically reconstruct the correct representation of a process based on a set of process execution traces. This paper outlines an alternative approach to business process mining utilising a Genetic Programming (GP) technique coupled with a graph based representation. The graph based representation allows greater flexibility in the analysis of process flowchart structure and offers the possibility of mining complex business processes from incomplete or problematic event logs. A number of event logs have been mined by the GP technique featured in this paper and the results of the experimentation point towards the potential of this novel process mining approach.
Increasingly modern business practice requires managers to fully understand how business processes operate in a live environment. To manually reconstruct a live process from a set of process execution traces would be very time consuming and error prone so software based process mining techniques are employed to automate this task.
Categories and Subject Descriptors I.2.6 [Artificial Intelligence]: Learning --- Induction; I.2.8 [Artificial Intelligence]: Problem Solving, Control Methods, and Search --- Graph and tree search strategies.
General Terms Algorithms, Experimentation
Keywords Business process mining, Genetic programming, Graph based representation
1. INTRODUCTION Process mining, as a practice adopts many of the techniques used for data mining [9]. One of the first techniques for process mining was developed by Cook & Wolf [9] for use in the discovery of Permission to make digital or hard copies of all or part of this work for personal or classroom use is granted without fee provided that copies are not made or distributed for profit or commercial advantage and that copies bear this notice and the full citation on the first page. To copy otherwise, or republish, to post on servers or to redistribute to lists, requires prior specific permission and/or a fee. GECCO’08, July 12–16, 2008, Atlanta, Georgia, USA. Copyright 2008 ACM 978-1-60558-130-9/08/07…$5.00.
Figure 1: Process data 1, an example of a process flowchart (template provided by [4])
1307
individuals’ fitness may be evaluated more efficiently (as explained later on). In a GP approach an individual is effectively an executable program [8].
It is also the case that managers need to identify departures from normal process execution; a call centre manager may need check for parts of a process being bypassed by telephone operatives and financial institutions could detect instances of fraud through the identification of suspicious process execution traces. Event logs containing process traces also present a range of mining problems such as noise (due to incorrect or missing entries in the log, or partially executed jobs), process loops and parallel paths of execution [1]. In this paper the practice of process mining using genetic based approaches will be explored and particular reference given to a new GP based approach put forward by the authors. A number of test process event logs, developed for current process mining techniques, will be mined by the GP approach and the results presented later on. The test event logs used in this paper are not obtained from ‘live’ business processes but aim to model the most common process features. However, the next stage of development of this technique will include the use of actual corporate process data.
The use of graph structures in combination with genetic algorithms is not a new concept [7]. Genetic Programming is generally known for the generation of either tree structures or linear programming code [14] (in [21] Daida et al. give guidance on the visualisation of tree structures). However, GP has been used for generating graphs for Artificial Neural Networks [12], bond graphs [18], electronic circuits [15], and algorithm structures [17]. Genetic Network Programming [11] deals with the evolution of graph structures in which the numbers of nodes and their functional behaviour is fixed. Graph structured program evolution (GRAPE) as introduced by [17] is a GP technique using graph structures for generating computer programs with branches and loops. GRAPE uses a linear string of integers as its genotype. The visualisation A directed graph of a process provides executable decision points, such as ‘XOR’ and ‘AND’, between tasks. A graph may in effect be parsed against a set of criteria or overall graph schema for fitness. This is the approach attempted by [4]; however their binary causal matrix requires substantial effort in decoding for fitness assessment, crossover and mutation activities. A graph structure with API can be far easier manipulated for such activities. A graph structure representation, when used with GP, can also deal with loop constructs [8]. As with a GA approach GP evolved individuals benefit greatly from crossover and mutation operations.
2. GA APPROACHES TO PROCESS MINING Currently many approaches to process mining make use of heuristic algorithms [5] (‘rules of thumb’ based on the relationships between tasks in business process patterns [20]). One heuristic approach to process mining has been developed by Weijters [19] [20]. The approach of [20] involves a set of rules that are used to determine dependency relations between tasks in a process event log (order and precedence between process tasks). Such rules have also been tested for mining process patterns that contain loops and event logs with incomplete/noisy data by [20].
3. GP PROCESS MINING ALGORITHM While the process mining approach outlined by this paper and the approach of [4] both manipulate graph structures only the GP approach acts directly upon a graph based representation. This provides benefits in operations such as crossover, where the approach of [4] can only swap the input and output edges of a single task as opposed to the GP approach which has the potential to allow entire sub-graph structures to be swapped over with comparative ease.
Genetic based techniques for process mining are now being explored due to their resilience to noisy data and their ability to produce novel sub-process combinations from a given set of data. A GA based technique has been introduced by Alves de Medeiros [4] which aims to mine processes in the presence of a range of mining problems. The approach of [4] utilises a causal matrix which details input and output edges for each task of a process instance (an edge is a link between two process tasks). The relationships between edges are also detailed in the causal matrix; such relationships are restricted to ‘AND’ and ‘XOR’ operators only. For the GA of [4], the causal matrix had to be represented as a binary string. The technique draws on the work of [20] in its use of heuristics to determine the relationships between process tasks. Heuristics are used to build the initial generation of individuals for use within the GA. The GA technique has already provided some positive results with simple processes exhibiting limited levels of parallel constructs [4]. However, the GA approach as implemented by [4] experiences drawbacks in that the mining of more complex processes, especially those exhibiting high levels of parallel execution, is error prone. This paper outlines an evolutionary approach to process mining utilising Genetic Programming (GP). A GP technique is beneficial in the practice of process mining in that the representation of individuals need not be abstracted to the level of a binary string. Instead the GP process mining technique presented here utilises a directed graph structure, provided by the JGraphT software Application Programming Interface (API) [13]. This abstraction allows a better fit to the practice of process mining in that
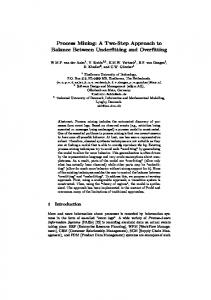
Figure 2: GP Process Mining Algorithm Stages
1308
3.1 Outline of the GP approach As can be seen from Figure 2 the five stages are followed in the operation of a GP process mining algorithm. In the first stage the event log, containing process execution data, is read (this data in the XML format accepted by the ProM [10] process mining suite). The second stage involves calculating dependency relations between the activities recorded in the process log (based on a set of heuristics). The third stage builds individuals from the event log relationships discovered in stage 2. For the purposes of the experiments detailed in this paper stages 2 and 3 are based on the heuristics used by [4]. The heuristics try to determine the precedence and order of tasks in a process log by utilising a dependency measure. The dependency measure aims to ascertain the strength of the relationship between tasks by calculating the amount of times one task is directly preceded by another. The measure is also able to determine which tasks are in loop constructs [4]. Once a set of individuals has been created their causal matrix representations are then translated automatically into JGraphT objects (allowing each individual to be manipulated by JGraphT API functions).
In equation 1 L is an event log and CM an individual. The notation CM[] represents a generation of process models. Each individual in a generation is being measured for completeness and preciseness in its reflection of the event log process traces. For completeness if all of the traces in the event log can be parsed against an individual without error then the fitness will be 1.0 [6]. When a trace cannot be parsed against an individual correctly, either because a task has not been enabled or missing inputs have disabled a task, that individual’s fitness is reduced.
Stage 4 of the GP process mining algorithm involves the measurement of an individual’s fitness. Again for the purposes of this paper the fitness measure of [4] will be used. In practice a number of adaptations have had to be made in the coding of the fitness function to take account of the graph structure used by the GP approach while not affecting the overall behaviour of the fitness function in general. Each process trace in the event log is parsed against every individual generated for the process mining algorithm. For comparison purposes the parsing process used by [4] has been adapted for the GP mining approach. The parsing technique employed involves the stages shown in Figure 3. Each trace in the event log is parsed against the individual in a task by task fashion. A task from an event trace is compared to the individual and the input edges (edges are the directed links between tasks) are examined to see whether they have been marked as possibly enabled. Particular attention is given to incoming edges that are in an AND relationship. If such edges are not marked as possibly enabled then the task is marked as disabled. Edges that are in an AND relationship, unlike XOR edges, are mandatory for the task to execute correctly.
Figure 3: The Parsing Cycle (GP Fitness Function) In equation 2 the PFcomplete function of equation 1 is detailed along with the fitness reduction measure. When mandatory inputs to a task are missing a token is added for each missing input which acts as a penalty in the fitness calculation. It is possible that there may be tokens left behind when a trace has been fully parsed (that is edges still set to possibly enabled as the task they refer to has not been enabled).
Once all of the mandatory incoming edges of a task can be marked as enabled all of the output edges of that task can then be marked as possibly enabled. This parsing cycle continues until the last task of a process trace has been parsed; at which point the next process trace is parsed against the same individual. Once all traces have been parsed against the individual the next individual is parsed in the same manner until all individuals in a generation have been parsed against the set of traces in the event log.
Tokens left behind are counted and used to reduce the fitness score for that individual as they are an indication that the individual is potentially incorrect. For an XOR set that still has all its edges marked as ‘possibly enabled’ one token is added; a token is added for each AND that is left as ‘possibly enabled’ at the end of parsing for a trace.
3.2 Fitness Function of the GP Approach The algorithm shown in equation 1 details part of the fitness function of [4] that is used in the experiments with the GP mining approach. Once the entire event log has been parsed against an individual, equation 1 is used to assign that individual a fitness score.
Fitness ( L, CM , CM []) = PFcomplete( L, CM )
PFComplete ( L, CM ) = allParsedA ctivities ( L, CM ) − punishment ( L , CM ) numActivit iesLog ( L )
(1)
− κ * PFprecise( L, CM , CM [])
1309
(2)
An incoming XOR edge even when set to 1.0 does not necessarily indicate a problem, as another branch of the XOR may be set to 3.0 or the XOR is not involved in that particular process trace. When a trace has been parsed against an individual all XOR edge sets are examined to check that one edge has been set to ‘enabled’ or all edges are ‘not-enabled’. If all the edges of an XOR set are found to be marked as ‘possibly enabled’ a single token is added (counted in equation 2 as an extra token left behind). Both missing tokens, tokens left behind and disabled tasks reduce the fitness score for an individual.
where punishment ( L, CM ) = allMissingTokens ( L, CM ) numTracesLog ( L) − numTracesMissingTokens ( L, CM ) + 1
+
allExtraTokensLeftBehind ( L, CM ) numTracesLog ( L) − numTracesExtraTokensLeftBehind ( L, CM ) + 1
In terms of preciseness the individual should not contain behaviour (expressed as tasks and edges) that is not detailed in the event log traces. The measure PFprecise in equation 1 provides an approximate measure of the amount of extra behaviour (additional edges not recorded in the event log but present in the mined process) an individual allows for in comparison to other individuals in the generation [6]. According to [6] on average individuals with a higher amount of enabled tasks tend to be more likely to express extra behaviour. In equation 3 the amount of enabled activities in an individual is divided by the maximum value obtained for enabled tasks from parsing the entire generation of individuals.
PFprecise( L, CM , CM []) =
allEnabledActivities( L, CM ) max(allEnabledActivities( L, CM []))
Table 1. GP Fitness Parsing Rules Rule
Reason
If incoming XOR edge is ‘not enabled’ then leave
An incoming XOR edge that is ‘not enabled’ could mean that another edge in that XOR set is ‘enabled’ or will be enabled in the future A task cannot execute unless all of its mandatory inputs (AND edges) are marked as ‘enabled’ In order to register that a task has fired correctly all mandatory AND edges and XOR edges that are marked as ‘possibly enabled’ must be marked as ‘enabled’ Only one edge of an XOR set can be marked as ‘enabled’, all other edges must be set to ‘not enabled’
Any incoming edges that are ‘AND’ and are not marked as ‘possibly enabled’ – set task as disabled Mark all incoming AND edges, that are currently marked as ‘possibly enabled’, as ‘enabled’
(3)
Once PFcomplete and PFprecise have been calculated the value κ , shown in equation 1, acts as a punishment weighting for the amount of extra behaviour found in an individual. The value of κ may be within the interval [0, 1] [6].
When an incoming possibly enabled edge is marked as possibly enabled visit edge set to mark as ‘enabled’ and mark the other edges in that XOR to ‘not enabled’ If a task in the trace does not exist in the individual, register the task as missing If an XOR edge (or edges) is the only input into a task and an edge in that edges’ XOR set is already marked as ‘enabled’ add a token and mark task as disabled Additional rule (after a trace has been parsed against an individual)
3.3 GP Approach Fitness Parsing and Process Marking Rules The parsing process used for the GP approach uses a different marking schema than that used by [4]. Each edge in an individual can be marked. In total 3 markings are used – Marking 1.0 – Edge is not enabled Marking 2.0 – Edge is possibly enabled Marking 3.0 – Edge is enabled A number of parsing rules have been used with the GP parser shown in Table 1.
Check each XOR edge set; if all edges in a set are still marked as ‘possibly enabled’ add a token
Parsing takes place in a directed fashion as all trace tasks are arranged in order of execution with each trace possessing a generic start and end task. For each task that is parsed against an individual the input edges to that individual are assessed for the presence of mandatory AND edges. Such edges must be marked as 2.0 (possibly enabled) for the parser to progress to the next task. If all the mandatory (AND) incoming task edges are set to 2.0 (possibly enabled) they can then be set to 3.0 (enabled) to show that the preceding task and edges in the individual match the trace being parsed. If this is not the case the task is noted as disabled and token is added for each non-enabled AND edge (counted in equation 2 as a missing token).
Check each AND, if still marked as ‘possibly enabled’ add a token
1310
A missing task is a serious omission from an individual An XOR can only have one edge marked as ‘enabled’
Reason
Any ‘possibly enabled’ XOR edge sets that have not been enabled indicate a potential error, a token must be added as punishment for this Any ‘possibly enabled’ AND edges that have not been enabled indicate a potential error, a token must be added as punishment for this
3.4 Crossover Operator
If mutation rate = mutate Input set task A = AND(B), AND(E), XOR(B,C,D) For each set in input set s
For the purposes of the experiments in this paper the crossover operator of [4] has been adapted for the GP approach. Further discussion of GP genetic operators and their effects may be found in [22]. In terms of this operator a five individual tournament selection process is used to select two parent individuals from a generation. A task, which exists in both individuals, is selected at random as the crossover point. The input and output edge sets of the task are then split at a randomly chosen swap point. In Figure 4 below example input sets for two parent tasks are shown. The letters in the sets refer to the names of process tasks that link to the task in the form of an edge. The operator for each set defines the edge relationships. In Figure 4 assume the swap point is after the second set in each parent.
1. Choose a set and add a task edge to the set (randomly chosen from the complete set of available tasks in the individual) AND(B), AND(F, E), XOR(B,C,D) Task F is added 2. Remove a task edge from a set AND(B), AND(E), XOR(B,D) Task C is removed 3. Random redistribution of task edges AND(C), XOR(B,E,D)
parentTask1 = AND(B), AND(E), XOR(B,C,D) parentTask2 = XOR(B, E), AND(C), AND(B), AND(D) swapset1 = XOR(B,C,D), remainder1 = AND(B), AND(E) swapset2 = AND(B), AND(D), remainder2 =XOR(B,E), AND(C) swapset2 + remainder 1 swapset1 + remainder 2
Figure 5: An Illustration of GP Mutation (adapted from [4])
4. OUTLINE OF EXPERIMENTS
If crossover rate = crossover
The following Koza Tableau [8], shown in Table 2 describes the key parameters used in the GP.
For each set in swapset 1 select, with equal probability, one of the following three crossover methods –
Table 2. Koza Tableau for the GP approach Parameters Objective
For each set in swapset1 do -
Terminal Set
1. Add set as a new subset in remainder2 XOR(B,E), XOR(B,C,D) 2. Join set with an existing set in remainder2 XOR(B,E,C,D)
Function Set Fitness Cases
3. Select a set in remander2 and remove the edges that are in common between that set and the set from swapset 1 XOR(B,E,C,D)
Raw Fitness Standardized Fitness
Repeat for the combination swapset2 & remainder1 Figure 4: An Illustration of GP Crossover (adapted from [4]).
The cycle shown in Figure 4 is repeated for both input and output sets of the selected crossover task. A pre-selected crossover rate determines how often crossover will take place in a generation. In the GA approach of [4] the crossover and mutation operators utilise a repair routine which is executed after an input or output set has been changed to make sure that only viable changes are made to individuals, the need for similar routines is very much reduced in the GP approach due to the inherent error checking provided by JGraphT [12] graph objects.
Termination criterion Selection Initialization Method
Values To mine a best fit process from the given event log data The process task marked as STOP terminates the parsing of the process it is contained in. Similarly the START task initiates the parsing of a process. AND, XOR, Node Marking Parse event log traces against each individual Number of correctly parsed traces for each individual Number of correctly parsed traces for each individual with a penalty for each missing task and for non enabled tasks calculated against the values for the generation as a whole (see Table 1 for parsing rules and equation 1 for the fitness measure) Fitness of 1.0 or maximum number of generations chosen Tournament section, five individuals Parse first event log trace against first individual (of a generation created by heuristics)
The experiments presented in this section give an indication of the abilities of the GP process mining approach. The following parameters are being used for the GP approach.
In addition to the crossover operator and as practiced by [4], elitism is used to copy over a percentage of the best individuals to the next generation.
Population size 100 Maximum generations 1000
1311
Elitism rate 0.02 Crossover rate 0.8 κ (extra behaviour fitness reduction) 0.025 The event logs for three processes will be mined by the GP approach and the mining result compared to a ‘correct’ template for that process. Table 3 details the three processes to be mined. The processes have been used as test data in the work of [4]. For the experiments the GP approach will use just crossover (using crossover technique 1 - add set as a new subset) and elitism in its operation. The GP code is written in Java and hosted in the ProM process mining framework [10]. The experiments are being carried out on a Windows XP PC with 500MB RAM and a Pentium 4 3GHz processor.
(C) GP Result
(D) GA Result
Table 3. Process Test Data Sets for Experiments Sequences
Parallelism
Process data 1
Low
Low
Process data 2
Medium
Medium
Process data 3
Medium
High (E) GP Result
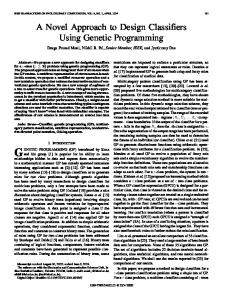
5. RESULTS For interest the processes in Table 3 have also been mined by the GA of [4] using the same parameter settings outlined before; and unlike the GP approach, the addition of a mutation operator using a rate of 0.02. Process data 1 could be mined correctly by both GP and GA techniques and the mined process is shown in Figure 1. The results for process data 2 and 3 are displayed in Figure 6 below.
(F) GA Result
Figure 6: The results of mining process data 2 and 3 with the GP and GA process mining approaches (event logs provided by [4]).
Process data 2 could also be mined by both the GA and GP techniques (flowchart A for GP and B for GA). However, the mining of process data 3 caused problems for the GA (flowchart F is GA). The GP mined this process with a higher level of structural accuracy (flowchart E in Figure 6). It is known that processes containing highly parallel constructs are difficult for the GA approach to mine [4]. The process templates for each process data set are shown in Figure 7. As mentioned earlier the GP approach did not utilise a mutation operator to obtain the results presented. The initial GP code implemented an adapted version of the mutation function used by [4] but tests showed that this operator was quite destructive in terms of the process flow diagrams returned, even when the mutation rate was reduced from 0.02 to 0.0002.
(A) GP Result
In the GA of [4] the crossover operator acts in a way that is not too dissimilar to a mutation operator, just crossing over edge sets for the same single task in each of the two offspring at any one time. After experimentation with the GP it was found that the ‘Add set as a new subset’ method of crossover from [4] gave the best results. The GP parameters, such as population size and number of generations through to elitism and crossover rates, were set to the values recommended and used in the work of [4]. Overall 10 runs were conducted with each of the three process data sets for the GP and GA techniques, with each run taking approximately 10 minutes to complete. The main observations for
(B) GA Result
1312
process data 1 was that the flowchart for the process could be mined correctly on each of the runs with both techniques. There was a similar outcome for process data 2 though on one or two runs of the GP one extra link was generated between two tasks. For process data 3 the GA consistently produced extra links between the parallel tasks. The GP produced either two or three superfluous links emanating from task A. From these tests the GP offers both consistency of results and a level of robustness when mining a range of structures, including parallel constructs. In conducting process mining with the GP approach there is, at this initial stage, a concentration on mining process structure rather than process behaviour expressed as semantic operators (such as XOR, AND).
Process Data 3
6. CONCLUSIONS AND FUTURE WORK
Figure 7: Correct process templates for each of the three process data sets (provided by [4] through ProM [10])
The GP approaches’ use of the graph abstraction for representing the individuals provides a major advantage in terms of flexibility. This allows for more reliable crossover operations as the graph abstraction helps to ensure valid connections are made between tasks. This is due to the implicit error checking in the creation of edges with the JGraphT API. Manipulation and traversal of input and output edge sets is also relatively straightforward with a graph abstraction.
START
The GP process mining technique outlined in this paper holds much promise for the mining of more complex processes. The GP technique takes an alternative approach to the practice of process mining and gives rise to the possibility that a greater range of real life processes can be mined automatically. This approach may eventually be able to mine processes from event logs containing noise and other mining problems. A more formal assessment of the GP approach will be undertaken in the near future which will assess the technique with a wider range of process data, alternative parameter values and the use of a mutation operator. As mentioned earlier on in this paper, the test event logs used in this paper are not obtained from ‘live’ business processes but aim to model the most common process features. However, the next stage of development of this technique will include the use of actual corporate process data. Further work will also focus on the mining and placement of semantic operators within the completed process flowchart. Alternative approaches to mutation and crossover, that are more suitable to a graph based representation, are currently being developed for use with this GP process mining technique.
A C
Figure 8: An excerpt from the event log for process data 3
7. ACKNOWLEDGMENTS This research is funded in part by the Engineering and Physical Sciences Research Council (EPSRC) grant no: EP/C54899X/1, UK, and British Telecommunications plc (BT).
8. REFERENCES [1] Aalst, W.M.P. Process mining: a research agenda, Computers in Industry, 53(3):pp. 231-244, 2004. [2] Aalst, W.M.P., van Dongen, B.F., Herbst, J., Maruster, L., Schimm, G., Weijters, A.J.M.M. Workflow mining: A survey of issues and approaches, Journal of Data & Knowledge Engineering, 47: pp. 237-267. 2003. [3] Agrawal, R., Gunopulos, D., Leymann, F. Mining process models from workflow logs, in Schek, H.J, ed., Proceedings of the 6th International Conference on Extending Database Technology: Advances in Database Technology, Springer Verlag, Heidelberg, pp. 469-483. 1998.
Process Data 1
[4] Alves de Medeiros, A.K., Genetic Process Mining. Ph.D Thesis, Eindhoven Technical University, Eindhoven, The Netherlands, 2006.
Process Data 2
1313
[5] Alves de Medeiros, A.K., van Dongen, B.F., van der Aalst, W.M.P., Weijters, A.J.M.M. Process mining: extending the a-algorithm to mine short loops, Beta Working Paper, Eindhoven University of Technology, The Netherlands, 2004.
[14] Koza, J.R. Genetic Programming, MIT Press, London, 1992. [15] Miller, J.F., Banzhaf, W. Evolving the program for a cell: from French flags to Boolean circuits, in On Growth, Form and Computers, S. J. Kumar and P. J. Bentley, Eds. New York: Academic, pp. 278-301, 2003.
[6] Alves de Medeiros, A.K., Weijters, A.J.M.M., van der Aalst, W.M.P. Genetic process mining: an experimental Evaluation, Journal of Data Mining and Knowledge Discovery, 14(2):pp. 245-304, 2007.
[16] Poli R. Evolution of graph-like programs with parallel distributed genetic programming, In E Goodman, Ed. Proceedings of Seventh International Conference on Genetic Algorithms, Michigan State University, pp. 346-353, East Lansing, USA, Morgan Kaufmann, 1997.
[7] Ashlock, D., Smucker, M., Walker, J. Graph based genetic algorithms, Congress on Evolutionary Computation-CEC99, Vol. 2, 6-9 July 1999, IEEE, Washington, DC, USA, pp. 1362-1368, 1999.
[17] Shirakawa, S., Ogino, S. and Nagao, T. Graph structured program evolution, 9th Annual Genetic and Evolutionary Computation Conference, GECCO 2007, Jul 7-11 2007, Association for Computing Machinery, New York, NY 10036-5701, United States, London, United Kingdom, pp. 1686-1693, 2007.
[8] Banzhaf, W, Nordin, P, Keller, R.E, Francone, F.D. Genetic Programming: An Introduction, Morgan Kaufmann, San Francisco, 1998.
[18] Wang, J., Fan, Z., Terpenny, J. P. and Goodman, E. D. Knowledge interaction with genetic programming in Mechatronic systems design using bond graphs", IEEE Transactions on Systems, Man and Cybernetics Part C: Applications and Reviews, 35(2):pp. 172-182, 2005.
[9] Cook, J.E., Wolf, A.L. Discovering models of software processes from event-based data, ACM Transactions on Software Engineering and Methodology, 7(3): pp. 215-249, 1998. [10] Dongen, B.F., Alves de Medeiros, A. K., Verbeek, H.M.W., Weijters, A.J.M.M., Aalst, W.M.P. The ProM framework: a new era in process mining tool support, in Proceedings of 26th International Conference on Applications and Theory of Petri Nets (ICATPN 2005),G. Ciardo, and P. Darondeau, Eds. Heidelberg, Springer Verlag, pp. 444-454, 2005.
[19] Weijters, A.J.M.M., van der Aalst, W.M.P. Process mining: discovering workflow models from event based data, in Kröse, B, Rijke., M, Schreiber, G, Someren, M, Eds. Proceedings of the 13th Belgium-Netherlands Conference on Artificial Intelligence, Amsterdam, The Netherlands, pp. 283-290, 2001.
[11] Hirasawa, K., Okubo, M., Katagiri, H., Hu, J. and Murata, J. Comparison between Genetic Network Programming (GNP) and Genetic Programming (GP), Proceedings of the 2001 Congress on Evolutionary Computation, Vol. 2, 27-30 May 2001, IEEE, Seoul, South Korea, pp. 1276-1282, 2001.
[20] Weijters, A.J.M.M., van der Aalst, W.M.P., Rediscovering workflow models from event-based data using little thumb, Integral Computer-Aided Engineering, 10(2):pp. 151-162, 2003.
[12] Hornby, G.S. Shortcomings with using edge encodings to represent graph structures”, Genetic Programming and Evolvable Machines, 7(3): pp. 231-252, 2006.
[21] Daida, J.M., Hilss, A.M., Ward, D.J., Long, S.L., Visualising tree structures in genetic programming, Genetic Programming and Evolvable Machines, 6: pp.79-110, 2005.
[13] JGraphT, An open source Java graph library that provides mathematical graph-theory objects and algorithms, http://www.jgrapht.org/, viewed 01/18/2008.
[22] Daida, J.M., Hilss, A.M., Identifying structural mechanisms in standard genetic programming, in Genetic and evolutionary computing - GECCO 2003, E. Cantu - Paz et al., Eds. Berlin: Springer-Verlag., pp. 1639-1651, 2003.
1314