Human Geographies – Journal of Studies and Research in Human Geography Vol. 9, No. 1, May 2015 | www.humangeographies.org.ro ISSN-print: 1843–6587 | ISSN-online: 2067–2284
A GIS-based multicriteria decision making approach for evaluating accessibility to public parks in Calgary, Alberta
a
Yunliang Meng *, Jacek Malczewski
b
a Central Connecticut State University, USA b Western University, Canada
This paper presents a Geographic Information System based Multicriteria Decision Making approach for evaluating accessibility to public parks in Calgary, Alberta. The approach involves the weighted linear combination with the entropy weighting method for obtaining the criterion (attribute) weights. The paper demonstrates a core-periphery pattern of accessibility to public parks in Calgary. Furthermore, the pattern has shown tendency to be more polarized between the year of 2006 and 2011. The results of this research can help the park planning authorities in identifying the needs for improving the accessibility to public parks, monitoring the changes of accessibility patterns over time, and locating new public parks. The results can also help the general public to better understand the spatial relationship between their neighbourhoods and public parks in the city. Key Words: GIS, MCDM, Accessibility Evaluation, Public parks. Article Info: Received: February 22, 2015; Revised: May 15, 2015; Accepted: May 22, 2014; Online: May 30, 2015.
Introduction Public parks are considered as amenities representing desirable land-use to urban residents when they are assessed in the context of environmental planning. They can provide urban residents with the leisure opportunities and aesthetic enjoyment (Kong et al., 2007). The accessibility to public parks is directly related to the life quality of urban residents (Pred, 1977). Moreover, proximity to public parks has been proved to have positive effects on human health by lowering the rates of mortality, cardiovascular disease, diabetes, and obesity (Gordon-Larsen et al., * Corresponding author Address: Yunliang Meng, Assistant Professor, Central Connecticut State University, 1615 Stanley Street, New Britain, Connecticut, 06053, USA. Phone: +1-860-832-2789 | Email:
[email protected] ©2015 Human Geographies; The authors
DOI:10.5719/hgeo.2015.91.3
30
Y. Meng & J. Malczewski
2006; Berke et al., 2007; Rundle et al., 2008; Rundle et al., 2013). However, these benets are lack of a clear market price. Consequently, the importance of public parks is usually underestimated by planning authorities. In reality, some public parks are gradually encroached upon and transformed into residential or commercial land use over time as a result of urban land shortage. Therefore, the ongoing evaluation of accessibility to public parks for urban neighbourhoods is needed to provide empirical evidence to support urban planning. Geographic Information Systems (GIS) has widely been applied for analyzing accessibility to public parks (Talen, 1998; Talen and Anselin, 1998; Chakraborty et al., 1999; Nicholls, 2001; Maantay, 2002; Maroko et al., 2009; Weiss et al., 2011; Zhu et al., 2011). However, those studies do not typically consider park characteristics (e.g., type, size, and facilities). In addition, the population size of the affected neighbourhoods is often ignored. Consequently, the inducted conclusions based on accessibility to public parks are questioned by some researchers (Maroko et al., 2009). Therefore, the rst objective of this paper is to include the park characteristics – park type and neighbourhood population into the procedure for measuring accessibility. There are also other drawbacks of the research on accessibility to public parks. Although the spatial relationship between the distribution of public parks and characteristics of affected residents can be determined, it is unclear where exactly improvements in accessibility should be implemented. Residents living in a neighbourhood may have high levels of accessibility to some types of parks (e.g., mini park), but not others (e.g., community park). In addition, the residents may have high levels of accessibility in terms of the number of parks surrounding their neighbourhood, but not in terms of the distance to parks. Therefore, it is necessary to trade off between the benets and limitations of having access to various types of parks to determine the accessibility levels to public parks for different neighbourhoods. In the trade-off procedure, the neighbourhoods need to be evaluated, classied and prioritized according to the overall accessibility levels. This type of problems can be tackled using GIS-based Multicriteria Decision Making (GISMCDM) procedures (Malczewski, 1999; Malczewski and Rinner, 2015). Therefore, the second objective of this paper is to use GIS-MCDM procedures to evaluate the overall accessibility to public parks for neighbourhoods in different years, so that the areas with low levels of accessibility to public parks could be identied and compared spatially and temporally. The two objectives will be investigated by conducting a case study in Calgary, Alberta. The paper is organized as follows. Section 2 provides a brief review of accessibility and GIS-MCDM. Section 3 presents a case study of accessibility to public parks in Calgary, Canada. The case study outlines a description of the study area, data source, variables used in this study, and analysis results, followed by a discussion and conclusions in Sections 4 and 5.
Accessibility and GIS-MCDM Accessibility Measures Accessibility refers to the ease with which any land-use activity can be reached from a particular location, using a particular transportation system (Dalvi, 1978).
A GIS-based Multicriteria Decision Making Approach
31
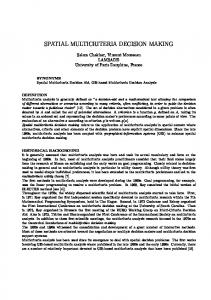
It is a measure quantifying the relative opportunity for interaction with a given element of urban system, such as a park (Gregory, 1986). The accessibility to public parks can be operationalized in terms of the following three models: (i) the covering model (Hodgart, 1978), (ii) the travel cost model (McAllister, 1976; Morrill and Symons, 1977), and (iii) the minimum distance model (Talen, 1998). In the covering model, accessibility to a park can be measured according to the park service area, represented by a circle drawn around a park (Hodgart, 1978). The circle radius (Euclidean distance) equals to the maximum distance the users have to travel to get to the park facility. This method assumes that the facility is equally enjoyed by residents living within its service area, even if its utility is diminished or vanishing beyond the border of the service area. It should be noted that different types of public parks, such as mini, neighbourhood, and community parks, have different sizes of service areas. The size of various types of public parks and their service areas can be determined according to the public park and open space classication scheme dened by U.S. National Recreation and Park Association (Table 1). In this study, the number of public parks located within a critical distance (road network based distance) surrounding a DA is used to quantify the accessibility level for residents living in the DA (see Figure 1A. as an example). The larger number of public parks within the critical distance, the higher the level of accessibility. The concept of accessibility can also be operationalized using the travel cost method (e.g., McAllister, 1976; Morrill and Symons, 1977). This method of measuring accessibility originates from a normative perspective on location analysis, in which the most often used objective is to minimize the total travel cost for customers. In this study, the average distance between each origin (e.g. the centroid of a DA) and destinations (e.g. public parks within the service area) is used as a measure of accessibility (see Figure 1B as an example). It should be noted that the average distance is measured based on the actual road network in Calgary. Since the goal of improving accessibility is to minimize the travel cost, the shorter is the average distance, the higher is the level of accessibility. In addition, the minimum distance between each point of origin (e.g., the centroid of a DA) and the nearest park facility is used as a measure of accessibility (see Figure 1C as an example). The rationale behind this approach is that residents would most often visit the closest park to conduct daily leisure activities. In this study, the minimum distance is a measure based on the road network. Some neighbourhoods are always closer than others to any given park facility, so the smaller the minimum distance, the better. Table 1. Public Park and Open Space Classification Scheme (Mertes and Hall 1995) Type of park
Location criteria
Site criteria
Population served
Mini Park
Service area usually less than 0.25 mile or 0.4 km
Usually between 2,500 square feet and 1 acre; maximum 5 acres
500 to 2,500
Neighbourhood Park
Service area usually no more than 0.5 mile or 0.8 km
Minimum of 5 acres, 7 to 10 acres optimal, maximum 20 acres
2,500 to 10,000
Community Park
Usually serves 2 or more neighbourhoods within 3 mile or 4.83 km
Between 20 and 50 acres
10,000 to 50,000
32
Y. Meng & J. Malczewski
Figure 1. Three GIS-based Techniques for Measuring Accessibility to Public Parks
GIS-MCDM GIS-MCDM can be dened as a process that transforms and combines geographical data (criterion maps) and value judgement to obtain overall assessment of the decision alternatives (Laaribi, 2000; Chakhar and Martel, 2003; Malczewski, 2006; Malczewski and Rinner, 2015). The rationale behind the integrating GIS and MCDM is that these two distinct areas of research can benet from each other. GIS plays an important role in storing, manipulating, analyzing and visualizing spatial data for decision-making. MCDM provides systematic evaluation procedures and algorithms for structuring decision problems, and designing, evaluating and prioritizing alternatives (e.g., Eastman et al., 1995; Jankowski, 1995; Malczewski, 1999; Thill, 1999; Feick and Hall, 2004; Malczewski and Rinner, 2015). Central to GIS-MCDM is a decision (or aggregation) rule, which can be considered as a procedure that allows decision makers to select one or more alternatives from a number of alternatives. The most often used decision rules in GIS-MCDM have been limited to a few well-known methods, such as Boolean overlay and weighted linear combination (WLC) (Eastman et al., 1995; Malczewski, 2006; Malczewski, 2011). When using Boolean overlay, all attributes are rst transformed into logical statements of suitability (e.g., 1 or 0), and then combined by means of logical operators such as intersection (Logical AND) and union (Logical OR). In the process of WLC, continuous attributes are rst standardized to a common numeric range, and then aggregated through a weighted average function. The WLC model has often been used together with the Boolean operators (Malczewski, 2006). The outcome of such integration is a continuous map of overall perfor-
A GIS-based Multicriteria Decision Making Approach
33
mance masked by one or more Boolean constraints. In this research, the WLC integrated with Boolean operators is applied for evaluating the accessibility to public parks for neighbourhoods in Calgary, Alberta.
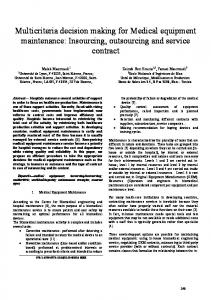
Accessibility to Public Parks in Calgary, Alberta Study Area The City of Calgary is located at the foothills of Alberta's Rocky Mountains, at the junction of the Bow and Elbow Rivers. Its land area is about 726.5 square kilometers. Calgary is the energy capital of Canada and an important transportation hub. Due to the oil boom, Calgary becomes a rapidly developing and expanding city. It has experienced major population growth over the last decade or so. According to the 2011 national census, the Calgary Census Metropolitan Area (CMA) reached a population of 1,214,839 and its population grew at a rate of 12.6% between 2006 and 2011 (Statistics Canada, 2012a). Calgary grew almost two and half times faster than the national growth rate of 5.4%, and also had a higher growth rate than Alberta, 10.6%. In 2014, Calgary's metropolitan population was estimated at 1,360,000, raising its rank to fourth-largest city in Canada and the largest city in Alberta. Data A variety of datasets were utilized in this research (see Table 2 and Figure 2). The 2006 and 2011 census data, aggregated at the dissemination areas (or DA) level (see Figure 2), were used to analyze the spatial distribution of residents in the City. Both datasets were obtained from Statistics Canada. In this study, dissemination areas (or DA), the smallest geographic unit of population measurement used by Statistic Canada (Statistics Canada, 2012b), were chosen to represent different neighbourhoods in Calgary. Although DA boundaries were not explicitly considered neighbourhoods, they have been widely used in extant research as units of analysis that correspond to actual neighbourhoods (e.g. Edwardh et al., 2011; Hou, 2014). A road network data of Calgary and park boundaries in the City, created in 2006 and 2011 by DMTI Canada were used in this study (see Figure 2). Between 2006 and 2011, the total area and number of public parks have decreased from 12869 to 12793 acres and 278 to 213, respectively. Over the ve year period, the largest drop Table 2. Data Type and Source Data Type
Source
Calgary DA Boundaries
Statistics Canada
Calgary Population Census
Statistics Canada
Calgary Street Network
DMTI Canada
Calgary Park Boundaries
DMTI Canada
34
Y. Meng & J. Malczewski
Figure 2. Geographical Distribution of Parks in Calgary, Alberta
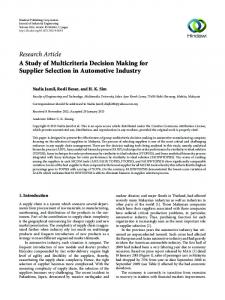
Figure 3. The Number of Different Types of Parks in 2006 and 2011
was recorded in the number of mini parks (about 37% decrease), followed by the number of neighbourhood parks (about 18% decrease). The number of community parks has not changed over the ve years (see Figure 3). Measuring Accessibility The three methods for measuring accessibility (see Chapter 2) were applied to quantify accessibility to each type of parks. The covering model involves specifying
A GIS-based Multicriteria Decision Making Approach
35
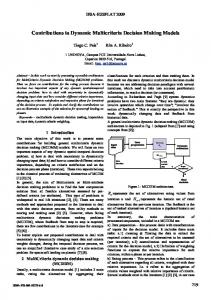
the critical travel distance allowed for each park type (see Table 1). The distance was then measured outwards from each DA's centroid along the streets using the “Network Analysis” module of ArcMap (ESRI, 2010a). Specically, the distances of 0.25, 0.5, and 3 miles (0.4, 0.8, 4.83 km) from the centroids of DAs were used to create the reaching (or covered) areas for residents living in each DA for different types of parks. The “spatial join” and “summarize” functions provided by ArcMap (ESRI, 2010b) were then used to identify the number of different types of parks located within the specied distances. Finally, the measure of accessibility for each DA was calculated by dividing the total number of parks of a given type by the DA's population (see Table 3). The travel cost and minimum distance methods involve measuring the travel distance between each DA centroid and centroids of a given type of parks (e.g., the mini, neighbourhood, or community parks). These measurements were performed with the “Network Analysis” module of ArcMap (ESRI, 2010a). The average distance was calculated using the sum of the travel distance divided by the total number of a specic type of parks. The minimum distance was quantied by adopting the shortest travel distance between a DA and its nearest park. It should be noted that both the average and minimum distances were weighted by the DA's population before they were used for calculating accessibility measures (see Table 3) The GIS-MCDM Procedure The GIS-MCDM procedures involve two steps: (i) dening the evaluation problem in terms of hierarchical structure, and (ii) evaluating the overall accessibility score by means of a decision (evaluation) rule. The hierarchical structure consists of three levels: goal, attributes, and decision alternatives (or DAs) to be evaluated in terms of accessibility to public parks (see Figure 4). Nine attributes of the DAs were considered to measure the levels of accessibility to public parks in Calgary in 2006 and 2011. Each attribute has been weighted using the number of residents living in DAs. Consequently, eighteen attribute maps (nine maps for each of the two years) have been generated using the “Spatial Analyst” module of ArcMap (ESRI, 2010b). The maps have then been converted into 30m resolution raster data layers. The raster maps have been used as the input dataset for evaluating accessibility. Table 3. Methods for measuring accessibility to parks in Calgary, Alberta Measure of
Equation
accessibility The covering measure The average
the total number of the i - th park withi n a specified distance the population of the j - th DA
distance measure
(the population of the j - th DA) ´ ( the total distance from the j - th DA to all parks) the total number of the i - th park type within a specified distance
The minimum
( the population of the j - th DA) ´
distance measure
(the distance to the i - th nearest park from the j - th DA)
Note: DA = Dissemination Area; i = 1, 2, ..,m; j = 1, 2, …, n)
36
Y. Meng & J. Malczewski
Figure 4. Hierarchical structure of the DAs accessibility to the public parks in Calgary (Note: DA = Dissemination Area)
The second step of the GIS-MCDM procedure combines the raster maps by means of WLC. Specically, the overall accessibility score, Sj of the j-th alternative (DA) is calculated as follows: q
h
S j = å wk p jk Õ c g k =1
g =1
where wk is the weight associated with the k-th attribute (∑wk = 1; k = 1,2,...,h); pjk is the normalized attribute value for j-th DA (0< Pjk < 1; ∑ pjk = 1; j = 1,2, ..,n); cg is the criterion score of the g-th Boolean constraint which excludes DAs without population from the analysis (g = 1,2, ..., q). The attribute weights, wk , are estimated by means of the entropy method (Shannon and Weaver, 1947; Hwang and Yoon, 1981; Zeleny, 1982). This method requires that the attribute values be normalized as follows.
p jk =
x jk
å
n j =1
x jk
where x jk is the attribute value of the k-th attribute for j-th DAs. Given the normalized attribute values, one can estimate attribute weights based on the amount of decision information contained in each attribute, xjk, measured by the entropy value, e k, as:
ek
å =-
n j =1
p jk ln( p jk ) ln(n)
The degree of diversity of the information contained by each criterion can be calculated as: dk = 1– ek. Thus, the attribute weight is given by:
wk =
dk
å
h k =1
dk
Equation (1) has been applied to calculate the overall accessibility to public parks for each DA in Calgary in 2006 and 2011 (see Figure 5). The WLC values were
A GIS-based Multicriteria Decision Making Approach
37
reclassied into ve categories based on the “Quantile” classication scheme (see Figure 6). Results The results of this research show that the residents of the central and eastern parts of Calgary tend to have higher levels of accessibility to public parks than those living in the peripheral neighbourhoods (see Figures 5 and 6). As expected, the spatial inequalities are related to the locational pattern of parks in the City (see Figure 2). However, several areas in the north and south sections of the City had relatively high levels of accessibility to the public parks in 2006, while they were located relatively far from the public parks (see Figure 6). This can be related to the fact that these areas had comparatively small populations in 2006. A comparison of the accessibility patterns in 2006 and 2011 reveals that the DAs having high levels of accessibility shifted from the north and south edges of the City to the center and east sections (Figure 6). The decline in accessibility in the periphery of Calgary over time can partially be attributed to the decreasing size and number of the public parks. The other factor contributing to the shift in accessibility to public parks is associated with the changes in the population distribution between 2006 and 2011. The total number of people living in the neighbourhoods with at least medium residential density (30 residents per hectare) has decreased by 5.0 %, while the population of the Calgary CMA has increased by 12.6% (Statistics Canada, 2012a). Most of the population growth occurred in the neighbourhoods with low residential density along the City edge. The population in some peripheral areas of Calgary grew more than ten times as the result of urban expansion. However, these areas are lack of newly-founded parks. Therefore, the lower levels of accessibility in the peripheral sections of the City can be attributed to the large increase in populations of these areas. The higher levels of accessibility in the central and eastern parts of Calgary should be seen in relative terms. It is not an outcome of an increase in the size and number of the public parks. It is rather a result of relative decrease in population of the central and eastern parts of the City as compared the peripheral sections of Calgary. Discussion This paper has presented a GIS-MCDM approach for evaluating spatial accessibility to the public parks in Calgary, Alberta. The approach provides a useful tool for those involved in the planning of public parks. It offers a novel method of visualizing and measuring the levels of accessibility to public parks. Specically, the paper has demonstrated an improved method of measuring distance using the street network rather than the straight-line distance. This method provides more realistic representation of the service areas. The proposed GIS-MCDM approach can be used by park planning authorities to indentify the areas where there are needs for improving accessibility to public parks as well as to monitor changes in the accessibility over time. The approach can also be used for identifying the best locations for new public parks, since identifying areas with low accessibility to public parks can be considered as a stimulus for planning activities (e.g., adding new parks). The general public has a natural tendency to more readily accept analyses that
38
Y. Meng & J. Malczewski
Figure 5. Accessibility to the public parks in Calgary, Alberta
Figure 6. Accessibility patterns of DAs: The reclassied results of WLC
A GIS-based Multicriteria Decision Making Approach
39
are technical, scientic, and/or quantitative, and assume that such studies are less prone to deliberative biases (Comer and Skraastad-Jurney, 2008). However, the results of scientic research are usually hard to be understood by the general public. As with any public presentation, how the park accessibility information is presented can be as important as the content of the information. This research demonstrates that the GIS-MCDM procedures provide park planners and administrators with useful tools to create and disseminate well-designed accessibility maps to the general public, so that the local residents to can better visualize and understand the spatial relationship between their neighbourhoods and public parks in the city. The neighbourhood population and the size of public parks have often been ignored by previous research on accessibility to public park facilities. This paper has demonstrated that these are essential factors in evaluating accessibility to public parks. It has emphasized the importance of using different measures of accessibility such as the weighted average distance, the weighted minimum distance, and the weighted number of public parks to represent different aspects of accessibility in relation to the spatial patterns of population distribution. The results of this research have shown a core-periphery pattern of accessibility to public parks in Calgary. Specically, the neighbourhoods with higher levels of accessibility to public parks tend to be concentrated in the core and eastern parts of the City, while the neighbourhoods with lower levels of accessibility tend to be located in the peripheral areas. The core-periphery pattern polarizes over time. The high accessibility areas located in the center and east sections of Calgary have become larger, while the level of accessibility to public parks has tended to decrease in the peripheral areas. These results provide support for growing concerns about the lack of infrastructure (e.g., public parks) in the newly developed neighbourhoods in the fast growing peripheral areas of Calgary (Couroux et al., 2006). Finally, it should be noted that park accessibility, by nature, is a multiple dimension concept, including: physical proximity to neighbourhoods, park safety, and park attractiveness (Zhang et al. 2011). The method employed in this case study is only concerned with which areas and populations have different levels of physical access to public parks and it does not take into account the safety and attractiveness of public parks, such as levels of development and physical condition. Inclusion of the park's safety and attractiveness information could add a more qualitative dimension to the analysis. In addition, cultural and perceptual barriers should also be taken into account when measuring accessibility to parks (Maroko et al., 2009). Furthermore, diverse public opinions could allow planning authorities to make better decisions. The involvement of interest groups (e.g., local residents) in the planning and decision making process is an important step toward a sustainable park design approach.
Conclusions This research provides a GIS-MCDM method for evaluating the overall accessibility to various types of public parks in Calgary, Canada. The GIS-MCDM procedures are particularly useful for park planning experts to interact with and analyze all possible alternative scenarios, so that they can better improve accessibility to
40
Y. Meng & J. Malczewski
public parks and monitor changes in accessibility over time. For the general public, the well-designed accessibility maps can help them to better understand the spatial relationship between their neighbourhoods and public parks in the city. With the GIS-MCDM tool, interpretable quantitative results, and visually appealing maps, the research procedure described in this paper can lead to less biased, more transparent, more up-to-date and more informative decision making for park planning and operations.
References Berke, E, Koepsell, T & Moudon, A 2007, 'Association of the built environment with physical activity and obesity in older persons', American Journal of Public Health, vol. 97, no. 3, pp. 486-492. Chakhar, S & Martel, JM 2003, 'Enhancing geographical information systems capabilities with multi-criteria evaluation functions', Journal of Geographic Information and Decision Analysis, vol. 7, no. 2, pp. 47-71. Chakraborty, J, Schweitzer, L & Forkenbrock, D 1999, 'Using GIS to assess the environmental justice consequences of transportation system changes', Transactions in GIS, vol. 3, no. 3, pp. 239-258. Comer, JC & Skraastad-Jurney, PD 2008, 'Assessing the locational equity of community parks through the application of geographic information systems', Journal of Park and Recreation Administration, vol. 26, no. 1, pp. 122-46. Couroux, D, Keough, N, Miller, B & Row, J 2006, Overcoming barriers to sustainable developm e n t : To w a r d s s m a r t g r o w t h i n C a l g a r y , v i e w e d o n 2 1 Fe b r u a r y 2 0 1 5 , www.pembina.org/reports/Smart_growth_Calgary.pdf Dalvi, MQ 1978, 'Behavioural modelling, accessibility, mobility and need: concepts and measurement', in DA Hensher & PR Stopher (eds), Behavioural travel modelling, Croom Helm, London. Eastman, JR, Jin, W, Kyem, P & Toledano, J 1995, 'Raster procedures for multicriteria multiobjective decisions', Photogrammetric Engineering and Remote Sensing, vol. 61, no. 5, pp. 539547. Edwardh, J, Hildebrandt, T & Lau, R 2011, Incomes and Poverty Report, viewed on 15 May 2015, www.cdhalton.ca/pdf/Burlington-Incomes-and-Poverty-Report.pdf Esri 2010a, ArcGIS Network Analyst: An ArcGIS for Desktop Extension, viewed on 15 May 2015, www.esri.com/software/arcgis/extensions/networkanalyst. ESRI 2010b, ArcGIS Spatial Analyst: An ArcGIS for Desktop Extension, viewed on 15 May 2015 www.esri.com/software/arcgis/extensions/spatialanalyst. Feick, RD & Hall, BG 2004, A method for examining the spatial dimension of multicriteria weight sensitivity, International Journal of Geographical Information Science, vol. 18, no. 8, pp. 815-40. Gregory, D 1986, 'Accessibility', in RJ, Johnston, D, Gregory & DR Stoddart (eds), The Dictionary of Human Geography, Blackwell, Oxford. Gordon-Larsen, P, Nelson, M, Page, P & Popkin, B 2006, 'Inequality in the built environment underlies key health disparities in physical activity and obesity', Pediatrics, vol. 117, no. 2, pp. 417-424. Hodgart, RL 1978, 'Optimizing access to public services', Progress in Human Geography, vol. 2, pp. 17-48. Hou, F 2014, Life Satisfaction and Income in Canadian Urban Neighbourhoods, Catalogue no. 11F0019M – no. 357, ISSN 1205-9153. Hwang, CL & Yoon, KS 1981, Multiple Attribute Decision Making: Methods and Applications, Springer, New York.
A GIS-based Multicriteria Decision Making Approach
41
Jankowski, P 1995, 'Integrating geographical information systems and multiple criteria decision making methods', International Journal of Geographical Information Systems, vol. 9, no. 3, pp. 251-273. Kong, F, Yin, H & Nakagoshi, N 2007, 'Using GIS and landscape metrics in the hedonic price modeling of the amenity value of urban green space: a case study in Jinan City, China', Landscape and Urban Planning, vol. 79, no. 3-4, pp. 240-252. Laaribi, A 2000, SIG et Analyse Multicitere, Hermes Sciences Publications, Paris. Maantay, J 2002, 'Mapping environmental injustices: Pitfalls and potential of geographic information systems in assessing environmental health and equity', Environmental Health Perspectives, vol. 110, no. 2, pp. 161-171. Malczewski, J 1999, GIS and Multicriteria Decision Analysis, John Wiley and Sons, New York. Malczewski, J 2006, 'GIS-based multicriteria decision analysis: A survey of the literature', International Journal of Geographical Information Science, vol. 20, no. 7, pp. 249-268. Malczewski, J 2011, 'Local weighted linear combination', Transactions in GIS, vol. 15, no. 4, pp. 439-455. Malczewski, J & Rinner, C 2015, Multicriteria Decision Analysis in Geographic Information Science, Springer, New York. Maroko, AR, Maantay, JA, Sohler, N, Grady, K & Arno, P 2009, 'The complexities of measuring access to parks and physical activity sites in New York City: A Quantitative and qualitative approach', International Journal of Health Geographics, vol. 8, no. 34, pp. 1-23. McAllister, DM 1976, 'Equity and efciency in public facility location', Geographical Analysis, vol. 8, pp. 47-63. Mertes, JD & Hall, JR 1995, Park, Recreation, Open Space and Greenway Guidelines, National Recreation and Park Association, Arlington. Morrill, R & Symons, S 1977, 'Efciency and equity aspects of optimum location', Geographical Analysis, vol. 9, pp. 215-225. Nicholls, S 2001, 'Measuring the accessibility and equity of public parks: a case study using GIS', Managing Leisure, vol. 6, no. 4, pp. 201-219. Pred, A 1977, City Systems in Advanced Economics, Hutchinson, London. Rundle, A, Field, S, Park, Y, Freeman, L, Weiss, C & Neckerman, K 2008, 'Personal and neighborhood socioeconomic status and indices of neighborhood walk-ability predict body mass index in New York City', Social Science and Medicine, vol. 67, no. 12, pp. 1951-58. Rundle, A, Quinn, J, Lovasi, G, Bader, MD, Yousefzadeh P, Weiss, C & Neckerman, K 2013, 'Associations between body mass index and park proximity, size, cleanliness, and recreational facilities', The American Journal of Health Promotion, vol. 27, no. 4, pp. 262-269. Shannon, CE & Weaver, W 1947, The Mathematical Theory of Communication, The University of Illinois Press, Urbana. Statistics Canada 2012a, CANSIM, table 051-0056, Statistics Canada, Ottawa. Statistics Canada 2012b, Census 2011: Geography - Illustrated Glossary, Statistics Canada, Ottawa. Talen, E 1998, 'Visualizing fairness: Equity maps for planners', Journal of the American Planning Association, vol. 64, no. 1, pp. 22-38. Talen, E & Anselin, L 1998, 'Assessing spatial equity: An evaluation of measures of accessibility to public playgrounds', Environment and Planning A, vol. 30, no. 4, pp. 595-613. Thill, JC 1999, Multicriteria decision-making and analysis: A geographic information sciences approach, Ashgate, New York. Weiss, CC, Purciel, M, Bader, M, Quinn, JW, Lovasi, G, Neckerman, KM & Rundle, AG 2011, 'Reconsidering access: park facilities and neighborhood disamenities in New York City', Journal of Urban Health, vol. 88, no. 2, pp. 297-310. Zeleny, M 1982, Multiple criteria decision making, McGraw-Hill, New York. Zhang, X, Lu, H & Holt, JB 2011, 'Modeling spatial accessibility to parks: A national study', International Journal of Health Geographics, vol. 10, no. 31.