Journal of
Sensor and Actuator Networks Article
Wearable-Based Human Activity Recognition Using an IoT Approach Diego Castro *
ID
, William Coral
ID
, Camilo Rodriguez, Jose Cabra and Julian Colorado
ID
Department of Electronics, School of Engineering, Pontificia Universidad Javeriana, Cr. 7 No. 40-62 Bldg. Jose Gabriel Maldonado, Bogota 110111, Colombia;
[email protected] (W.C.);
[email protected] (C.R.);
[email protected] (J.S.);
[email protected] (J.C.) * Correspondence:
[email protected] Received: 30 September 2017 ; Accepted: 17 November 2017; Published: 24 November 2017
Abstract: This paper presents a novel system based on the Internet of Things (IoT) to Human Activity Recognition (HAR) by monitoring vital signs remotely. We use machine learning algorithms to determine the activity done within four pre-established categories (lie, sit, walk and jog). Meanwhile, it is able to give feedback during and after the activity is performed, using a remote monitoring component with remote visualization and programmable alarms. This system was successfully implemented with a 95.83% success ratio. Keywords: e-health; human activity recognition (HAR); Internet of Things (IoT); rule tree classifier; C4.5; Bayesian classifier
1. Introduction The Internet of Things, IoT, is a new concept in which all sensing objects can be connected to the internet to have remote and constant access to its measurements (data). This access allows for taking action in a faster way, with better results and much more data involved [1,2]. The data that compose these kinds of systems can go from temperature [3], outdoor location [4], indoor location [5], storage stock, humidity or other industry related variables [6]. In short, any sensor that can be connected to the Internet makes part of an IoT paradigm [7]. In such a way, classical applications of pervasive computing can be upgraded to an IoT scheme for an activity recognition application: Human Activity Recognition (HAR). These applications, in their classical approach, have been researched, evaluated and developed to the point that several commonly available products have HAR systems built in. This can be seen on some fitness trackers, references [8,9], which have HAR systems built into the mobile applications of their manufacturer. These applications usually register and analyze daily and sleep activity [10]. The HAR system consists of sensing the person’s positioning and movement, performing a feature extraction and a classification of those features to decide which activity was performed in a pre-selected list of activities [11–13]. The HAR systems have several methods to perform recognition, the most common one being an artificial vision assisted system [14,15]. This kind recognition can be seen in commercial products such as the Microsoft KinectTM [16]. Despite the many benefits and high popularity, in both usability and research, of vision assisted HAR, it presents several disadvantages for subjects such as accuracy, coverage and cost. Another method that can overcome these challenges are on-body sensors systems or wearable assisted HAR [17]. This kind of approach relies on wearable sensors present throughout the body, which help to perform the recognition [18]. This method can either require that the subject wear one [19,20] or more [21] for pre-established periods of time. Some systems even require that the device(s) have to be permanently worn by the person [22]. These devices could be those within another device such as a smartphone [23,24].
J. Sens. Actuator Netw. 2017, 6, 28; doi:10.3390/jsan6040028
www.mdpi.com/journal/jsan
J. Sens. Actuator Netw. 2017, 6, 28
2 of 20
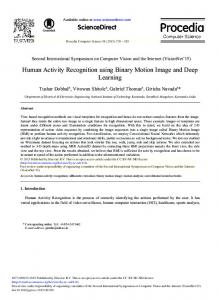
In this paper, we present a more detailed and novel version of an HAR-IoT system that employs a single device with occasional usage, as seen in [20] presented at the International Conference on Future Networks and Distributed Systems (ICFNDS) 2017. This system is intended to be used by patients with chronic heart diseases, patients that have their health status in a non-critical condition but still need constant monitoring. The presented system focuses on the daily routine, activity and physical therapy that each patient must have as part of their recuperation process. Although an IoT approach needs a security analysis [25,26], our approach to the IoT does not rely on a wireless sensor network (WSN) [27], the data information is not sensitive to outside listeners [28] and, as previously stated, the focus of the paper is to validate the presented approach to HAR-IoT systems. The HAR-IoT system uses a specialized hardware for vital signs monitoring including embedded heart, respiration and body acceleration sensors. The activity recognition was implemented using a classifier that uses the information gathered by this hardware. Two different methods were implemented for the classifiers: Bayes [29] and C4.5 [30]. An (IoT) cloud based component was integrated [31,32] to perform different tasks, such as: remote consultation [33], feedback and therapy control for both duration and quality [34] or even an online classification service [35]. This component also grants remote access to the data and configurable alerts for the activity done, if needed. This paper presents a novel interaction between a traditional HAR system and an IoT system with a different approach to the classical feature extraction in an HAR system, which resulted in a 95.83% success ratio with a notable small training data set. This work will be presented as follows: in Section 2, the system architecture is explained and complemented with the system description in Section 3. Section 4 focuses on explaining the feature extraction method and the classifier information. The experiments and results are presented in Section 5, and, finally, the conclusions are shown in Section 6. 2. System Architecture The proposed system is composed of two main modules: a traditional HAR system that can be implemented on any mobile and non-mobile device, and an e-health application of any recognition or surveillance system used in a health care related subject. These modules work independently, but the novelty of the approach lays with the increase of availability and decrease response times. 2.1. HAR Systems An HAR system is a specific application of pattern recognition and expert systems. This recognition works in two phases: a training phase and a recognition phase. Although both have similar steps, the training phase has a priori information of the activities done and the recognition phase uses the knowledge of the training phase to have accurate recognition. This means that the recognition phase is highly dependent on the training phase success. 2.1.1. Learning/Training Phase The learning or training phase is the first phase of any recognition algorithm. This phase is in charge of establishing the relations between the data and the activities. It has three main steps (Figure 1): 1.
Data collection: The data collection step conducts the data acquisition from all the sensors available for the system. The sensor available will be dependent on the kind of device that the recognition is built for. This step needs an activity log of every activity performed detailing the time, the type and duration. The training phase must consider all possible activities, needing all to be performed, preferably, in an aleatory manner without a correlation in activity, duration or any other factor that might be involved in the recognition. It is important to note that the data collection is done without any signal processing as all processing and analysis is done during the feature extraction step.
J. Sens. Actuator Netw. 2017, 6, 28
2.
3.
3 of 20
Feature extraction: The feature extraction step has several possibilities depending on the kind of sensors and variables types that are involved during the data collection step. There can be structural features and statistical features. The structural features are those that try to find interrelation or correlation between the signals. This also means that the signal can fit a previously defined mathematical function to the current state of the variables. The statistical feature extraction performs a transformation on the signal using statistical information. These features could be the mean of the signal, standard deviation, correlation, etc. The most common transformations performed are the Fourier and Wavelet transforms. During this step, it is common to perform signal processing to eliminate noise, reduce the range of the signal or perform other kinds of processing to better extract the relevant features for each activity. Learning: The learning or the final step of the training phase is the development of a recognition model that is learned from the data set, the activity log and the relevant features to properly recognize any activity. This step is highly dependent on the training data set, which is the reason for the strict methodology and rigorous logging on the data collection step. There are many recognition models that can go from a rule tree based on signal parameters, neural networks, statistical base algorithms or fuzzy logic, each one having their advantages and disadvantages. Based on the complexity, response time and available resources, the model must be selected to best fit the system demands.
Figure 1. Learning process of an HAR system.
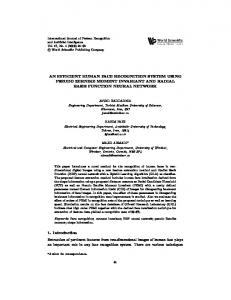
2.1.2. Recognition Phase The recognition phase is the final phase of an HAR system. It does the recognition of the activity performed using the training phase result. The recognition phase has three main steps (Figure 2): 1.
2.
Data collection: The data collection step does the data acquisition of all the sensors available for the recognition. The sensor available will be dependent on the kind of device that the recognition is built for. Unlike the learning phase, there is not any prior knowledge of the activities performed, so there is no need, either choice, to have an activity log. It is important to note that the data collection is done without any signal processing, as all processing and analysis is done during the feature extraction step. Feature extraction: The feature extraction step has several possibilities according to the kind of sensors and variable types that are involved during the data collection step. There can be structural features and statistical features. The structural features are those that try to find interrelation or correlation between the signals. This also means that the signal can fit a previously defined mathematical function to the current state of the variables. The statistical feature performs transformation on the signal using statistical information. This could be using the mean of the signal, standard deviation, correlation, etc. The most common transformations performed are
J. Sens. Actuator Netw. 2017, 6, 28
3.
4 of 20
the Fourier and Wavelet transforms. During this step, it is common to perform signal processing to eliminate noise, reduce the range of the signal or perform other kinds of processing to better extract the relevant features for each activity. Recognition: The recognition or the final step of the training phase is the inference of the activity performed using the gathered data and extracted features on the previous steps using the recognition model of the training phase. This step decides which of the possible activities were done with a percentage of accuracy, which depends on the recognition model. This step is the most time-consuming part of any HAR system and, according to the selected model and available resources, this time and accuracy change.
Figure 2. Recognition process of an HAR system.
2.2. E-Health Applications An IoT solution gathers information from the available sensors, people and/or electronic devices. If the data source, application, user or place of implementation are related to the healthcare industry, it is called an e-health solution. These kinds of applications provide a novel approach to the healthcare system, which bring new and better services such as constant monitoring of patients and remote consultation services. All of these services provide a faster and reliable healthcare industry with almost zero waiting time, changing the classical approach of the healthcare system from a reactive service to a preemptive industry. In this project, the main focus is to improve the healthcare services that take care of patients for which their health status is not in a critical condition, but they still need constant monitoring. To better understand the proposed solution, it is necessary to discuss and understand the general scheme of a remote patient service, especially home remote patient monitoring. The general architecture of a remote patient service (Figure 3) includes a variety of sensor and/or medical devices to measure relevant variables of the patient that include but are not limited to: • • • • •
Heart Rate. Respiration rate. Weight. Oxygen saturation. Posture.
J. Sens. Actuator Netw. 2017, 6, 28
5 of 20
Figure 3. Basic scheme in an e-health system.
According to the signal properties and signal availability, the data is transmitted via the Internet to a database. Inside the database, the data can be constantly analyzed, displayed or even take action, usually in the form of alarms, to give a better healthcare service. The constant availability of the data implies a full time monitoring of the relevant data of the patient, which makes it easier to detect an abnormality on the patient. This also means that the medical record of the patient gets a huge amount of data, opening the possibility of performing a more integral and objective medical diagnosis. This will reduce the cost service, improve the recuperation time and will improve the efficiency on the healthcare system overall. The lower cost service is associated with the fact that the patient will assume the high expenses related to it, accommodation and infrastructure related costs. There is also a reduction in staffing cost, as the remote monitoring implicates that the qualified personnel for the care services does not need to be present at the patient location, and one person can be in charge of the tracking of more than one patient at a time, with the help of the data analytics of the system. In addition, at their homes, the patient’s recuperation process can be accelerated, as a remote care service greatly minimizes the exposure of the patient to others’ diseases, comparing this scenario to a classical hospitalization environment. Having the patient data in real time will improve any treatment, as the adjustments of the quantity, methodology and other factors of the treatment can be adjusted in the same manner. This follows a paradigm to change from a situational response to a situation prevention and avoid high risk scenarios. This real-time management allows the procedures to be simpler and more efficient. Consequently, there will be great improvement on the quality of life of patients undergoing remote monitoring services, with stress levels lowering because of their home accommodation rather than in a hospital. The implemented solution will be described in further sections. 3. System Description The goal of this prototype is to implement an HAR-IoT system, which needs to be able to measure physiological variables, have an HAR component that works according to the sensor data, and implement a cloud system for data storage and remote display. Intelligent alarms can be programmed according to different levels following the hospital requirements.
J. Sens. Actuator Netw. 2017, 6, 28
6 of 20
The system’s block diagram is composed of three main elements (wearable, the smartphone application and the cloud ). This diagram is shown in Figure 4: •
•
•
Wearable: The selected wearable is the Bioharness (Zaphyr, Annapolis, Maryland, US). This wearable is capable of measuring several physiological variables (for more information, see Section 3.1) and connect to a smartphone via Bluetooth. Smartphone application: This application has three main components. The data reception that handles the communication and storage of the raw sensor data of the wearable. The HAR classifier, which recognizes the kind of movement done at that moment using the raw sensor data, a classifier algorithm and a machine learning process. Furthermore, a local visualization is responsible for displaying raw sensor data and the activity recognized. Cloud: The cloud component receives all the raw data of the wearable and the activities recognized by the HAR classifier. All the data is stored and can be consulted online using a web browser.
Figure 4. Solution architecture.
J. Sens. Actuator Netw. 2017, 6, 28
7 of 20
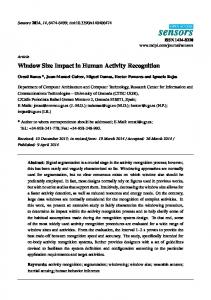
3.1. Hardware Component The selected wearable device (Figure 5) was the ZephyrTM Bioharness 3 model K113045. This is a device that measures physiological variables [36]. It can measure heart rate, heart rate variability, and respiratory rate, it has a built-in accelerometer for posture and several activity analysis. These sensors are embedded on an elastic band that must be worn at chest height and pressured against the skin. The strap design allows it to be used under regular clothes, at any given place such as the work place, home and/or health centers.
Figure 5. ZephyrTM Bioharness reference K113045.
The Bioharness 3 has a special characteristic that allows the device to not require the use of electrolytic gel nor any adhesive material for its proper operation, unlike other skin-contact devices. The device has an internal storage in which all the physiological data is saved as it performs measurements. When the Bioharness 3 connects via Bluetooth (class 1) to another device, it sends the storage data to the device. If the Bioharness 3 is connected while performing measurements, the data sent is the last measurement done. The strap of the Bioharness is washable and the plastic where all the sensors are can be submerged up to 1 m under water. Table 1 contains the detailed information as provided by the manufacturer. Table 1. Bioharness 3 specifications. Parameter
Value
HR Range: BR Range: Acc. Range: Battery type: Battery Life:
25–240 BPM 4–70 BPM ±16 g Rechargeable Lithium Polymer 26 h per charge
3.2. Software Component The software components of the system have two separate environments. The first is a smartphone application to gather, analyze, locally visualize and send the data to the cloud and is implemented for Android devices. The other one is a cloud environment. This allows for remote visualization of the raw data and activity recognition, and can have several configurable alarms.
J. Sens. Actuator Netw. 2017, 6, 28
8 of 20
3.2.1. Smartphone Application The gathering of data, analysis and patient local interface of the project was implemented in a smartphone application compatible with Android 4.1 or higher. This application, as seen in the block diagram (Figure 4), has the following main functions: •
• •
Data reception: The application has to receive Bioharness information packages using Bluetooth protocol. Then, the system has to discriminate the packages to get all the individual sensors’ information. HAR classifier: With the raw sensor data, the app uses a classifier algorithm to build a recognition model to estimate the current activity. Local visualization: All the latest sensor data can be seen in the mobile screen, in conjunction with the latest recognized activity.
Both the sensor’s raw data and the recognized activity is sent to the cloud system using either HTTP or Message Queue Telemetry Transport (MQTT) protocols. 3.2.2. Cloud For the cloud environment, a platform called Ubidots was selected, which is a Colombian enterprise that offers cloud services for IoT solutions. This is an integrated solution that covers all necessary services to successfully implement small to medium solutions at a low cost. The services include: data storage (up to 500.000 data points), remote visualization (several widgets), basic data manipulation (basic algebraic operations) and programmable email and Short Message Service SMS alarms. This platform was used to visualize the history of the activities recognized, heart rate, respiration rate, posture and the acceleration values. The alarms were configured for heart rate and respiration having minimum and maximum levels alerts. The last alarm was configured for a maximum level of the peak acceleration (behavior that indicates a fall) (Figure 6).
Figure 6. Example of the data visualization on the cloud service.
J. Sens. Actuator Netw. 2017, 6, 28
9 of 20
4. HAR System Having the data collected, the next step is to perform the activity recognition. To do this, we performed a two-phase recognition algorithm. The first step is the feature extraction, which uses the raw data to create a set of features that are the input of the second phase: the classification phase. The classification phase can be either a training step (see Section 2.1) that generates the recognition model or a recognition step that uses the recognition model and the extracted features to determine the activity performed. 4.1. Feature Extraction The feature extraction is an algorithm that standardizes the raw data set, which reduces the amount of data to process. It performs analysis over the data set, such as structure detection, transformations or statistical functions. This allows the data to be organized in standard forms (mathematical functions) with an emphasis on how well the data explains these standard forms (fit). This process reduces the raw data to a finite and concrete set of aspects of the signal, which reduces the complexity of the recognition model. For each available sensor, there can be several features that can be extracted and, if not well proposed, the classification problem can become an overdetermined system. To avoid an indeterminate problem, there are several options to decrease the amount of features used in the classification. To select the features and reduction methods appropriate to the problem, it is first necessary to see which data is available. For this project, the available data is: 1. 2. 3. 4. 5. 6.
Heart Rate. Respiration Rate. Posture. Three-axis acceleration (X, Y,Z). Peak Acceleration. Electrocardiogram (ECG) magnitude.
In this case, most signals are time series measurements with low variability, meaning that the most appropriate feature extraction method is a structure detector without any prior processing [18]. The only exception to this is the three-axis acceleration, as these kinds of signals are too fluctuating and oscillatory to use a structure detection without pre-processing. To decrease the unwanted behavior of the signal, two methods can be used: a principal component analysis (PCA) or a discrete cosine transform (DCT). Both extract the most relevant information of the signal, and the PCA uses statistical procedures to get a set of linearly uncorrelated variables. On the other hand, DCT uses a only real domain Laplace transform to get the frequency components of the signal. In this case and for this kind of signal, the best results are obtained using PCA over DCT [37]. The structure detection algorithm searches for the best fitting mathematical function for the selected data, a minimization of the mean square error between the data and the function (Equation (1)): n
∑ (Y (t) − Yb(t))2 with Yb(t) =
f (Y (t)).
(1)
t =1
The structural detectors, f (Y (t)), can be either lineal or nonlineal functions. These functions have different parameters that describe the behavior of the function. Modifying these parameter allows for fitting each signal iteration to a structure with a unique set of parameters. These parameters become the features selected to perform the recognition. To avoid a high cost search in mathematical structures, a few structures were selected. This was done according to the usual behavior and range of the available signals. Table 2 presents the selected mathematical functions from which the algorithm will try to fit the signals. This table also presents the different parameters that describe the functions, their restrictions, characteristics or formulas that define them.
J. Sens. Actuator Netw. 2017, 6, 28
10 of 20
Table 2. Attribute counting: value and probability. Structure
Formula
Linear: Constant
f (Y (t)) = a
Parameters a=
1 n
n
∑ Y (t)
t =1 n
∑ (t − t)(Y (t)) − Y
Linear: line
f (Y (t)) = a + b ∗ t
a = Y − b ∗ t, b = t=1
Y=
1 n
n
n
∑ ( t − t )2
t =1
∑ Y ( t ), t =
t =1
1 n t n t∑ =1
Non-Linear: Exponential
f (Y (t)) = a ∗ |b|t + c
a, b, c ∈