Retrieval (CBMIR) for effective utilization of medical images based on visual feature analysis ... Keywords: Medical Image Retrieval, Texture Features, Optimization, .... Engine. This system is an Internet-based search engine developed by the ...
American Journal of Applied Sciences 10 (6): 549-562, 2013
ISSN: 1546-9239 ©2013 Science Publication doi:10.3844/ajassp.2013.549.562 Published Online 10 (6) 2013 (http://www.thescipub.com/ajas.toc)
A HYBRID APPROACH BASED MEDICAL IMAGE RETRIEVAL SYSTEM USING FEATURE OPTIMIZED CLASSIFICATION SIMILARITY FRAMEWORK 1
2
Yogapriya Jaganathan and 2Ila Vennila
1 Department of Computer Science and Engineering, Paavai Engineering College, Namakkal, Tamil Nadu, India Department of Electrical and Electronics Engineering, PSG College of Technology, Coimbatore, Tamil Nadu, India
Received 2013-01-28, Revised 2013-05-25; Accepted 2013-06-06
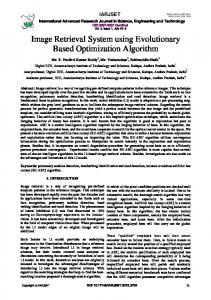
ABSTRACT For the past few years, massive upgradation is obtained in the pasture of Content Based Medical Image Retrieval (CBMIR) for effective utilization of medical images based on visual feature analysis for the purpose of diagnosis and educational research. The existing medical image retrieval systems are still not optimal to solve the feature dimensionality reduction problem which increases the computational complexity and decreases the speed of a retrieval process. The proposed CBMIR is used a hybrid approach based on Feature Extraction, Optimization of Feature Vectors, Classification of Features and Similarity Measurements. This type of CBMIR is called Feature Optimized Classification Similarity (FOCS) framework. The selected features are Textures using Gray level Co-occurrence Matrix Features (GLCM) and Tamura Features (TF) in which extracted features are formed as feature vector database. The Fuzzy based Particle Swarm Optimization (FPSO) technique is used to reduce the feature vector dimensionality and classification is performed using Fuzzy based Relevance Vector Machine (FRVM) to form groups of relevant image features that provide a natural way to classify dimensionally reduced feature vectors of images. The Euclidean Distance (ED) is used as similarity measurement to measure the significance between the query image and the target images. This FOCS approach can get the query from the user and has retrieved the needed images from the databases. The retrieval algorithm performances are estimated in terms of precision and recall. This FOCS framework comprises several benefits when compared to existing CBMIR. GLCM and TF are used to extract texture features and form a feature vector database. Fuzzy-PSO is used to reduce the feature vector dimensionality issues while selecting the important features in the feature vector database in which computational complexity is decreased. Fuzzy based RVM is used for feature classification in which it increases the response rate and speed of the retrieval process. This proposed FOCS framework is used to help the physician to obtain more confidence in their decisions for diagnosis and medical research students are zeal to get the essential images successfully for further investigation of their research. Keywords: Medical Image Retrieval, Texture Features, Optimization, Dimensionality Reduction, Classification, Similarity Measurements research students for further analysis of their research. Many imaging modalities, such as Computed Tomography (CT), Magnetic Resonance (MR), Ultrasound (US), MammoGrams (MG) and Digital Radiography (DR),are presently existing which would be used to convey the
1. INTRODUCTION Medical imaging field has been developed to produce more attractive techniques to analyze the medical images to physicians for immediate diagnosis and to the medical
Corresponding Author: Yogapriya Jaganathan, Department of Computer Science and Engineering, Paavai Engineering College, Namakkal, Tamil Nadu, India Science Publications
549
AJAS
Yogapriya Jaganathan and Ila Vennila / American Journal of Applied Sciences 10 (6): 549-562, 2013
desired images to physicians at precise time to diagnose and to give treatment for that specific diseases and for medical research students to have a further analysis of their research such as finding the commonness of a obsessive feature in a large survey collection. It would not be possible to access or make use of those particular images unless it is arranged in a structured manner. Medical image retrieval system (Emmanuel et al., 2010; Suganya and Rajaram, 2012) plays a vital role that would locate a desired image from a large varied collection of image database. The radiology department of hospitals is well established with Picture Archiving and Communications Systems (PACS) in which image storage, retrieval and transfer of images are performed using the format of Digital Imaging and Communications in Medicine (DICOM). The search of image is carried out based on the textual features of image headers such as patient id, name and other technical parameters such as image modality, body parts, orientations. There have been testified errors in the exactness of DICOM headings. Often the radiology department is not entering a proper or adequate data into systems also pool of image contents are not clearly described by text. Content Based Medical Image Retrieval system (CBMIR) is developed to make automatic indexing by extracting the content of visual features by using low level features such as texture, shape, colorto provide adequate information. Such mechanism is called as Query by image Example which requires a set of descriptive features and some similarity metrics to compare the query image with database image.
Researchers are seeking to overcome the above gaps to make CBMIR as a highly efficient system (Deserno et al., 2009). The following some of the existing CBMIR systems (Hsu et al., 2009; Xue et al., 2009; Ghosh et al., 2011; Ramamurthy and Chandran, 2012), have been used to retrieve required images from the medical image databases for the purpose of radiologists and medical research students.
1.2. Comparison Algorithm for Navigating Digital Imaging Databases (CANDID) This system successfully retrieves pulmonary CT images with the same resolution, size and content usingglobal signatures such as texture, shape and color features and regularized distance between probability density functions are used to match signatures from the database of feature vectors.
1.3. Automatic Search and Selection Engine with Retrieval Tools (ASSERT) This system addresses the issues in the automatic approach of identifying pathology bearing regions and insisted to have human-in-the-loop approach to know anatomical landmarks in the image for High-Resolution Computed Tomography (HRCT) of lung using Texture, Shape, Edges and Gray-scale Properties.
1.4. Medical Image Management System (MIMS) This Systemaddresses the problem of indexing by the way of representing the image contents initially with context then with the graphical and semantic manner for X ray, CTs of the Head Images using Text and Shape Features with the relationship of JDBC/ODBC bridge.
1.1. CBMIRGaps CBMIR has been an active research area, however, it has not made substantial progress when unified into an application of healthcare and medical research due to the following gaps represented in Table 1. Table 1. CBMIR Gaps Gaps Content gap Feature gap Performance gap
Usability gap
Science Publications
1.5. Image Map An Attributed Relational Graphs is used as Image Indexing Method that can map multiple images of organs into a low dimensionality point that allows conception, clustering and operations of data mining based on Spatial Similarity about any number of objects or regions of shape and texture features.
Description Context semantic and diagnostic protocols Feature extraction, scale, dimension System implementation, acceptance, availability Integration, feature indexing and evaluation Query features integration, query refinement
1.6. Image Retrieval in Medical Applications (IRMA) The medical expert knowledge is incorporated as layers such as raw data, registereddata, feature, scheme, object and knowledgeand medical images are characterized by a ranked structure of ellipses relating image regions with graph matching. This system has 550
AJAS
Yogapriya Jaganathan and Ila Vennila / American Journal of Applied Sciences 10 (6): 549-562, 2013
1.10. Phase I Visual Feature Extraction
been implemented in a distributed system for various imaging modalities using Global and Local Shape and Texture Features.
Feature extraction (Iakovidis et al., 2009; Akgul et al., 2011; Suganya and Rajaram, 2012) is the base for image retrieval. The extracted visual image features are formed as Feature Vector Database. The features can be classified as general features such as Texture, Shape and Color and domain specific features such as human faces and finger prints. Compared to all the visual features, texture features possess the properties for capturing semantic features in images because it has an inclusive contribution of various grey levels within the image. Also Texture has potentials as periodicity and scale results in a surplus of ways of extracting medical image features. The statistical model based texture feature extraction methods are Gray Level Cooccurrence Matrix, Tamura Features and the spatial frequency and transform based approaches are as Gabor Filter Features and Wavelet Features.
1.7. GoldMiner: A Radiology Image Search Engine This system is an Internet-based search engine developed by the American Roentgen Ray Society (ARRS) to retrieve medical radiography imagesby using keywords in figure captions such as age/modality/sex from the UMLS figure captions from a massive cluster of figures available in peer-reviewed journals and consequences of images displayed in a list or grid manner.
1.8. Cervigram Finder: A Web-Accessible Content-Based Cervicographic Image Retrieval System This system is developed by the National Library of Medicine which have been operated on a subset of the cervicographic image databases in which the user generates a query image region by recognizing the region of interest on an image using color, texture and size of features through the graphical user interface.
1.9. Spine Pathology System (SPIRS)
and Image
1.11. Phase II: Optimized Feature Selection Feature selection can be defined as selecting the unification of features among a given larger feature vector database that describes a particular feature set is best. The greater feature dimensionality in CBMIR, it results in lowering the performance of feature classification that generates problems in constructing efficient data structures for search and retrieval. Feature selection is used to reduce the feature space by removing the irrelevant, redundant and noisy features which would declines the computational complexity and upturns the speed of retrieval process. Earlier investigation procedures for dimensionality reduction includes (Wu et al., 2009) Principal Component Analysis, Weighted Multi-Dimensional Scaling Tabu Search Method. For the past several years Evolutionary Algorithm (EA) operates on the population of possible solutions by relating the presence of the fittest to yield better and better estimates to a solution. The key inspiration for using EA is to search a set of possible solutions simultaneously to find the optimal feature selection with a least runs of algorithm. Most widely used EA for optimizing the features are Particle Swarm Optimization (PSO) (Ye et al., 2009), Genetic Algorithms (GA) (Silva et al., 2011), Gravitational Search Algorithm (GSA) (Rashedi et al., 2009) Ant Colony Optimization (ACO) (Piatrik and Izquierdo, 2009). In general, algorithms can be classified based on the method of evolution. GA population evolves throughout each subsequent population of chromosomes; however, PSO and ACO updates their population based on social behavior.
Retrieval
A Web-based Image Retrieval System for Large Biomedical Database which automate shape extraction and feature indexing methods that are used for efficient retrieval and combining text and image feature for a large biomedical database of digitized spine x-rays exhausting the morphological shape of the vertebral body. The above developments are revolutionary efforts in CBMIR and have helped potential use in a healthcare environment for radiologist and medical research. These methods have their own merits and drawbacks in their retrieval performance. Successful CBMIR applications can be developed by choosing an efficient algorithm at several stages of indexing and retrieval workflow. The goal of the proposed work is to develop an efficient medical image retrieval system that gears recent developments in the following phases: • • • •
Phase I:Visual Feature Extraction Phase II: Optimized Feature Selection Phase III:Classification of Features Phase IV:Similarity measurements Science Publications
551
AJAS
Yogapriya Jaganathan and Ila Vennila / American Journal of Applied Sciences 10 (6): 549-562, 2013
The individual evolutionary approach is used to identify the potential optimal solutions within a reasonable amount of time. However, this type of CBMIR having an impulsive convergence in which comprehensive optimal fact and the convergence speed is decreased. The difficulty of standard EA are delicate to the choice of parameters that are premature convergence when the particle and group best solutions are confined into local minimums during the search process. A fuzzy adaptive approach is needed to overcome the premature convergence and also to speed up the searching process.
similarity measure that selects the suitableclassified reference samples of the same class between the query image and the database images. The solitary approach in each stage of four phases is to focus on to identify the potential optimal solutions within a reasonable amount of time .A hybrid approach is required to build an efficient CBMIR which would searches the solutions space quickly by choosing the efficient methods and parameters in which convergence speed is raised to get an optimal fact in each of the four phases.
1.12. Phase III: Classification of Features
The above literature survey has motivated to use a hybrid methodology during Feature extraction, Optimization, Classification and Similarity Measurements (FOCS) framework. The proposed system is depicted in Fig. 1.
2. MATERIALS AND METHODS
The feature vectors optimized in different points of a texture images are not identical. Training the classification systems with these optimized features could raise the accuracy rate. The elements of image feature sets are categorized into a limited number of separable, discrete classes using a mathematical classification process. The steps are: (1) Train the classification-system on the Optimized feature set associated with the classes of interest. (2) Using classification decision rule, the classification-system decides which class apiece optimized features pixel most looks like the features. The most widely used classification algorithms (Rajendran and Madheswaran, 2010) are K-nearest neighbor, Fuzzy C-Means clustering, Decision Tree, Bayesian Classification. Some of theinteresting machine learningalgorithms are facilitated to classifymedical images and to enhance the information by using Support Vector Machine, Relevance Vector Machine, (Hong and Chen, 2011; Yogapriya and Vennila, 2012). Mostly all training points are taken uniformly during training but in many real world applications, the inspirations of the training points are different. Precisely, a fuzzy membership is allocated to each input point so that dissimilar input points can make different impacts in learning.
2.1. Methods • • • •
2.2. Phase I: Visual Feature Extraction Features are used to represent the characteristics of images, extract the most conspicuous features that represent maximum relevant information and form a complete feature vector database. The most widely used features for medical image retrieval is texture features. In this study Gray Level Co-Occurrence Matrix (GLCM) and Tamura texture features are used for feature extraction (Ramamurthy and Chandran, 2012).
1.13. Phase IV: Similarity Measurements Similarity measurement is the main tool for retrieving similar images from the classified image feature vector databases. Several similarity measurement distance metrics such as Manhattan Distance (L1 metric), Euclidean Distance (L2 metric), Vector Cosine Angle Distance (VCAD), Chord Distance, Pearson’s Correlation Coefficient, Spearman Rank Coefficient (Zhu et al., 2012) have been proposed in the literature for measuring similarity between feature vectors. An effective retrieval system is based on choosing the Science Publications
A Texture Feature vector database containing x number of vectors using GLCM and Tamura, x > 100 Perform Fuzzy Adaptive PSO on the high dimensional feature dataset to select feature set in order to obtain the lower-dimensional feature set Train and Test the each of input and output vectors of optimized Feature Sets using Fuzzy RVM Classification Apply Similarity Measurements between the Query Image features and Database Image Features using Euclidean Distance
2.3. Gray Level Co-Occurrence Matrix Features The second order statistics are extracted by using Gray Level Co-occurrence Matrix (GLCM). GLCM is used to identify the ways of how certain grey-levels that co-occurs with other grey-levels. The matrix is used to measure the relative frequencies of co-occurrence of grey level combinations within the pairs of pixels in a quantified spatial relationship. 552
AJAS
Yogapriya Jaganathan and Ila Vennila / American Journal of Applied Sciences 10 (6): 549-562, 2013
Fig. 1. The proposed fuzzy adaptive hybrid approach based medical image retrieval system using FOCS framework
Given an image G (i, j), let O (i, j) be the position operator and L be the N*N matrix, calculate how often a grey level l (i) that occurs in the location specified by the relationship operator, q, relative to points with grey level l(j). The co-occurrence matrix is defined by dividing the matrix L by aggregating of point pairs that satisfy q. The measure of joint probability is M (i,j) in which pair of points have to satisfy q that have values l (i), l(j). An angle θ and distance d is used to represent a relationship operator. Nm denotes the dimension of co-occurrence matrix and the mean of µx and µy are defined in Equation 1: Nm
2.4. Tamura Features Tamura extracted six texture features related to human visual perception such as coarseness, contrast, directionality, line-likeness, regularity and roughness.
Nm
µ x = ∑ im x (i), µ y = ∑ im y ( j) t =1
Angular Second Moment, Contrast, Correlation, Information Measure of Correlation 1, Information Measure of Correlation 2,Maximum Correlation Coefficient, Inverse Difference Moment,Sum Average, Variation, Sum Variance, Difference Variance, Sum Entrophy, Entrophy, Difference Entrophy which would measures the local variations, joint probability occurrence of specified pixel pairs, the sum of squared pixel elements,the closeness of distribution of elements.
(1)
t =1
and σx and σy are the standard deviations of mx and my respectively and defined in Equation 2: 1/ 2
2.5. Coarseness (Tcrs) Narrates to distances of distinguished variations of grey levels. At each pixel, find averages in the window of size, differences, values at various directions and finally set the best size. Then identify the coarseness feature by describing the complete distribution of the best sizes over the image instead of averaging over the entire image.
1/ 2
Nm Nm σ x = ∑ m x (i)(i − µ x ) 2 , σ y = ∑ m y ( j)( j − µ y )2 t =1 t =1
(2)
From M(i,j), µx, µy, σx and σy, 14 texture statistical measures of texture features are extracted such as Science Publications
553
AJAS
Yogapriya Jaganathan and Ila Vennila / American Journal of Applied Sciences 10 (6): 549-562, 2013
PSO algorithm are easy implementation of modest concept, robustness to control parameters, negligible storage requirement and pointing global and local minimum investigations. The position and velocity of each particles are modernized affording to the following formula and defined in Equation 3:
2.6. Contrast (Tcon) Gives clarity of image in which how grey levels vary in the image and to what level their distribution is inclined to black or white. The second-order and normalized fourth-order central moments of the grey level histogram, the variance and kurtosis are used to define the contrast.
Vjd (t + 1) = ω * Vid (t) + c1 * rand(0...1) * (Pbestj − X jd (t)
2.7. Degree of Directionality (Tdir)
+c 2 * rand(0...1) * (G besj − X jd (t)
Is measured based on the frequency distribution of oriented native edges beside their directional angles using pixel derivatives of an image computed using the sobel edge detector.
X jd (t + 1) = X jd (t) + Vjd (t + 1)
where, Vjd represents the rate of position change velocity of the jth particle in the dth dimension and t denotes the iteration number, rand (0…1) is a random number between 0 and 1. Pbestj is the best position found by the particle j so far. Gbest is the best position among all particles. c1 and c2 are positive random variables evenly distributed in the intervals [0, c1max] and [0, c2max] which could be calculated at each iteration and have the capability to control the relative importance of particles private experience versus swarms social experience for each particle c1max+c2max≤4ω is the inertia weight which is employed to control the global exploration ability and provide a balance between the global and local search capabilities and provide the impact of previous history of velocities on the current velocity. The following weighting function is usually employed and shown in Equation 4:
2.8. Line Likeyness (Tlin) Feature is defined as an average incidental of edge directions that co-occurs in pairs of pixels isolated by a distance in every pixel and would eliminate the weak edges.
2.9. Regularity Feature is defined as Freg = 1-n(T crs + Tcon + Tdir + Tlin) where n is a normalizing factor and Sd crs + Sd con + Sd dir + Sdlin represents the standard deviation of features such as coarseness, contrast, directionality and linelikeness.
2.10. Roughness Feature is given by simply adding the coarseness and contrast measures: FTrgh = FTcrs+FTcon.
2.11. Phase II: Optimized Feature Selection A hybrid approach of Fuzzy adaptive Particle Swarm Optimization is proposed to reduce the dimensionality of feature sets. The selected optimal features are considered for classification. (PSO) is a stochastic algorithm from the imitation of simplified social systems such as bird flocking and fish schooling. A hybrid fuzzy adaptive PSO (Yong-Feng and Shu-Ling, 2009) approach is proposed to overcome the premature convergence also to speed up the searching process. During the evolutionary process, a fuzzy IF/THEN rule system is applied to adaptively regulate the parameters of PSO, such as the inertia weight and learning factors.
ω(t) = ωhigh − (ωhigh − ωlow )
t Thigh
(4)
ωhigh and ωlow are the desired higher and lower bounds of the inertia weight. Thigh is the maximum allowed number of iterations after which the algorithms complete the process. Usually time dependent linearly decreasing value of the inertia weight would be considered to solve global optimization problems.
2.13. Fuzzy Adaptive Particle Optimization (Fuzzy PSO)
2.12. Overview of the Classic PSO
Swarm
The three parameters C1, C2 and ω of PSO are prominently manipulating the performance of an algorithm. The suitable choice of inertia weight ω can provide a balance between global and local optimum
PSO algorithm is based on the particles behavior of a swarm which can be modeled by social behavior of bird flocking or fish schooling. The major advantages of the Science Publications
(3)
554
AJAS
Yogapriya Jaganathan and Ila Vennila / American Journal of Applied Sciences 10 (6): 549-562, 2013
points. The learning factors c1 and c2 determines the influence of personal best Pbest,j and global best Gbest particles. Each particle contains n number of features wherein each feature or position is assigned 0 or 1. An assignment of 1 corresponds to the selection of the feature and an assignment of 0 corresponds to its rejection. It is very difficult to design a scientific model to adapt the parameters dynamically because lack of knowledge of searching process. The fuzzy adaptive PSO is proposed to design a fuzzy system which can adapts the inertia weight and learning factors dynamically for image retrieval problems.
There are three linguistic values such as S, M and L for Small, Medium and Large that represents the memberships of input and the output variable and can be obtainable in three fuzzy sets of linguistic values: (NA) Not Accepted, ZR (Zero) and (OA) Optimistically Accepted. The Fuzzy rules for variations of the inertia weight are mentioned in Table 2.
2.14. Fuzzy Formulation
2.16. Learning Factors
negative corrections. Therefore, a range of {-0.1 to 0.1} to be chosen for the inertia weight correction as: ωk +1 = ωk + ∆ω
A fuzzy system is developed to adjust the learning factors with Top Fitness (TF) and number of groups for Unchanged top Fitness (UF) as the input variables and the learning factors (c1 and c2) as the output variables. TF reflects the performance of the topmost candidate solution has been found so far. The ranges of TF and UF are normalized into [0, 1]. The Standardized TF Format (STF) is shown in Equation 6:
The conditional statement is derived by Mamdanitype fuzzy rule which can be used to formulate a fuzzy logic. The output is formulated by the fuzzy control strategy and is represented using a Triangular membership functions from the given input. The AND operator is used to associate the membership values of each rule to generate the membership values in the consequent part of the rule.The deterministic control action is obtained using the method of centroid: • •
STF =
Low inertia weight and high learning factors can be used when the value of the objective function is low at the end of the run High inertia weight and low learning factors should be used when the best fitness is stuck at one value for a long time
The input variable to the fuzzy system is to consider the present best performance evaluation and present inertia weight. The output variable is the change in the inertia weight. The standardized fitness value SFV is used as an input variable between 0 and 1and is defined in Equation 5: FV − FVmin FVmax − FVmin
(5)
2.17. Rule IF (STF is OB) and (UF is OM), THEN (ω is OB), (c1 is OM) and (c2 is OM)
The first iteration value of FV can be used as FVmin for the next iterations. Generally, FVmax is a very large value, which is greater than any acceptable feasible solution. Typical inertia weight value is 0 to 0.4. The inertia weight is required to have both positive and Science Publications
(6)
where, TFmin is the estimated or real minimum fitness value and TFmax is the fitness value greater or equal to maximum fitness value, which could not be an acceptable solution to the optimization problem respectively. UF may be normalized into [0, 1] in a similar way. The values for c1 and c2 are bounded in 1≤ cl; c2; ≤2. The linguistic variables for the inputs and outputs are (OS) Optimistically Small, (OM) Optimistically Medium, (OB) Optimistically Big and (OR) Optimistically Bigger. The fuzzy rules are used to adjust the learning factors (c1 and c2) and shown in Table 3. The triangular membership functions of inputs and outputs are used and Mamdani-type fuzzy rule base is used to formulate the conditional statements which comprise fuzzification process.
2.15. Inertia Weight
SFV =
TF − TFmin TFmax − TFmin
The defuzzification strategy is required in which a centroid method is used to obtain a deterministic control action. 555
AJAS
Yogapriya Jaganathan and Ila Vennila / American Journal of Applied Sciences 10 (6): 549-562, 2013 T = {(x i , t i )}iN=1;
Table 2. Fuzzy rules for variations of the inertia weight ω --------------------------------------∆ω S M L SFV S ZR NA NA M OA ZR NA L OA ZR NA
Outputthe relevance vectors: T′ ⊆ T
Predicted unction:
Table 3. Fuzzy rules for the learning factors TF ---------------------------------------------c1, c2 OS OM OB OR STF OS OR OB OB OM OM OB OM OM OS OB OB OM OS OS OR OM OM OS OS
y(x, ω)
Terminating Condition: Training Samples T = {(x i , t i )}Nt =1 .
2.20. Fuzzy RVM The routine of RVM depends on only a scarce training point that represent ‘‘classical” samples of classes andmost of the optimized training points can be deliberated of no use. Therefore a notion of RVM with fuzzy membership is called as FRVM and is associated with each training point xi, so automatically the performance of RVM is fatherly improved and training points would be preserved with various attitudes. Extend the relevance vector approach to the case of classification where it can be desired to predict the posterior probability of class membership given the input x. Generalize the linear model by applying the logistic sigmoid function σ(y) = 1 (1+e−y) to y (x) and writing the likelihooddefined in Equation 8:
2.18. Phase III: Classification of Features Relevance Vector Machine (RVM) is a popular machine learning techniques based on statistical learning theory and having gorgeous features and thoughtful pragmatic performance. The drawbacks of RVM (Hong and Chen, 2011) are to treat the training points uniformly during training; however,the effect of the training points is different. Fuzzy Relevance Vector Machine is designed to overcome this training difficulty in which a fuzzy membership is assigned to each training input point such that different input points can make different impacts in learning process.
N
P(t | w) = ∏ σ { y(x n ; ω)} n 1 − σ { y(x n ; ω)}
2.19. Overview of the Classic RVM Relevance Vector Machine (RVM) is a probabilistic model and is proved to be faster than SVMsince it yields an optimum solution with few training samples and it is not necessary for RVM to abstain any regularization parameter during the training phases also there is no necessity for kernel function to fulfill Mercer’s condition besides the predictions are probabilistic. For regression problems, the RVM makes predictions based on the function and shown in Equation 7:
(8)
N
− log{p(t ω)p(ω α)} = −∑ t n log y n + (1 − t n ) n =1
1 × log(1 − y n )] + ωT Aω 2
(9)
With yn = σ{y(xn;ω)} where the first term of Equation 9 is the summation of error data and the second term of Equation 9 is the regularization span. When introducing the fuzzy membership of the corresponding point, Equation 9 can be changed and defined in Equation 10:
(7)
i =1
where, K(x,xi) is a kernel function and describing one basis function for each sample in the training set, xi , i=1, 2…N are adjustable parameters ,the training samples and {wi} are the model weights. RVM use hyper planes in order to separate the two parts of the image classes such as relevant and irrelevant. Input Training Data Set: Science Publications
1− t n
where, the targets tnε{0,1}. The most probable weights ωMP have been obtained by finding the minimum over ofthe following Equation defined in Equation 9:
n
y(x, ω) = ∑ w i K(x, x n ) + ω0
t
n =1
− log{p(t ω)p( ω α )} = − ∑ s n [t n log y n + (1 − t n )
(10)
1 ×log(1 - y n )] + ω T Aω 2
556
AJAS
Yogapriya Jaganathan and Ila Vennila / American Journal of Applied Sciences 10 (6): 549-562, 2013
The Gradient and Hessian matrix are calculated using statistics and hyper parameters. With respect to different values of si, there has been a control over the trade-off of the respective training points (xi,ti) in the classification stage. A minor value of si makes the corresponding point (xi,ti) less important in training. So RVM is the distinct case of FRVM if we set all si = 1 and if ‘s’ is positive then conclude that optimized feature set could be correctly classified otherwise it is not under the class and defined in Equation 11: S ,y =1 Si = + i S − , y i = −1
selected texture features are given as input to the classification phase. The total number of feature classes are 58. The Table 6 represents lung, liver, brain and kidney images for testing, training and number of classes. The number of relevance vectors taken for sample training images by using PSO-RVM and Fuzzy PSO-RVM methodology is compared and represented in Table 7 and depicted in Fig. 3. Table 4. Features selected using fuzzy PSO Features extracted Features selected Angular second moment, Entrophy, energy, Contrast, auto correlation, autocorrelation, information measure of contrast, coarseness correlation, inverse Difference moment, variance, Directionality, Sum entrophy, energy, line likeness Coarseness directionality, line likeness, regularity roughness
(11)
2.21. Phase IV: Similarity Measurements Euclidean distance is used to find the similarity between the query image features and the categorized image features in the database and defined in Equation 12: SED =
Table 5. Sample optimization results of fuzzy PSO Optimization: Relevance Particle fitness fuzzy PSO vectors value 3.8222 9 0.1056 3.8658 9 0.1042 3.5672 9 0.1062 3.4682 9 0.1063 3.8598 9 0.1009 3.5056 9 0.1064 3.8216 9 0.1051 3.4345 9 0.1026 3.8277 9 0.1044 3.4402 9 0.1041
N
∑ (F [i] − CF i =1
Q
2 DB [i])
(12)
where, F0 [i] the ith query image is features and CFDB [i] is the corresponding feature in the classified feature vector database and N refers to the total number of images in the database.
3. RESULTS This proposed FOCS framework is implemented with the image database of 1000 images comprising a different variety of images. These images include some parts of human body like lung, liver, kidney, brain. These images are gray level images and structurally analogous images. Figure 2 shows some sample images in the database.
Table 6. Testing, training and No. of classes Image features --------------------------------------------Image Type Lung Liver Brain Kidney Images for testing 54 66 78 82 Images for training 131 158 186 245 Total no. of images 185 224 264 327 Number of classes 11 13 16 18
3.1. Sample Images A huge number of features are extracted from the image. This could increase the complexity of the system. So using Fuzzy PSO, we are extracting only the features that are useful in retrieving images from the database. This simplifies the system, increases the accuracy and degrades the complexity of the system. Table 4 and 5 shows the sample list of feature selected using Fuzzy PSO and optimization results of Fuzzy PSO in respect to Relevance vectors and Particle Fitness Value. The Value of the parameter C1 = 1.35, C2 = 1.35, Inertia Weight = 0.6, the no of particles are 5. The number of images taken for testing is 280 and the numbers of images taken for training is 720. For each image, Science Publications
Table 7. No. of relevance vectors for No. of training data No. of PSO-RVM: No. Fuzzy PSO-RVM: No. training data of relvance of relvance vectors 50 9 7 56 9 6 75 11 9 100 10 9 125 10 9 150 10 9 175 11 9 200 10 7 557
AJAS
Yogapriya Jaganathan and Ila Vennila / American Journal of Applied Sciences 10 (6): 549-562, 2013
Fig. 2. Sample images
Fig. 3. PSO-RVM and fuzzy PSO-RVM relevance vectors and training samples
Fig. 4. Sample query image “lung.jpg” Science Publications
558
AJAS
Yogapriya Jaganathan and Ila Vennila / American Journal of Applied Sciences 10 (6): 549-562, 2013
Fig. 5. Output of retrieved images of “lung.jpg”
Fig. 6. Sample query image “liver.jpg”
Fig. 7. Output of retrieved images of “liver.jpg” Science Publications
559
AJAS
Yogapriya Jaganathan and Ila Vennila / American Journal of Applied Sciences 10 (6): 549-562, 2013
Fig. 8. Precision-recall performance analysis Table 8. Comparision of proposed method Methods Overall features PSO-SVM 54 PSO-RVM 54 Fuzzy PSO-RVM 54
Corrected features 41 45 49
The retrieval performance is evaluated using precision and recall. Precision gives retrieval accuracy while recall gives ability of retrieving relevant images from the database. The Precision (P) and Recall (R) are then defined as:
R=
r Number of relavant images = n1 Number of retrieved images
r Number of relavant images = n 2 Total number of retrieved images in the Database
The Fig. 4 and 5 represent the sample query image and output of retrieved images of lung. The Fig. 6 and 7 represent the sample query image and output of retrieved images of liver and Fig. 8 represent Precision-Recall performance analysis.
4. DISCUSSION Thisstudy includes analysis of proposed system in terms of Feature Extraction, Optimization, Classification and Similarity measurements (FOCS Framework) applied to retrieve efficient images based on user request. Initially, database with 1000 real time medical images were used for testing theproposed CBMIR Science Publications
Precision 75.92 83.33 90.74
Recall 71.91 79.43 87.26
system. In feature extraction phase, the results were moderately good and it has given about 90% of the performance for texture feature extraction. In optimized feature selection and classification phase, most of the images perform well and it gives about 90% of the performance of this phase. In retrieval phase, approximately all the images carry out well and conventional Euclidean distance method was used for retrieval and it has given better performance result. For measuring retrieval performance, traditional parameters such as precision and recall measurements were used.The effectiveness of the optimization, classification testing, potential performance and accuracy is analyzed using PSO-SVM, PSO-RVM and Fuzzy PSO-RVM with 131 training samples and 54 testing samples of lung images. For the 54 testing samples, the precision and recall of PSO-SVM, PSORVM Fuzzy PSO-RVM is represented in Table 8 and corresponding graphical representation is shown in Fig. 8, indicate that the proposed method has more accuracy than the remaining two methods. The Precision and Recall performance analysis shows that PSO-SVM and PSO-RVM control require more time and iteration to converge. The proposed Fuzzy PSO-RVM has grasped faster in terms of iteration to converge and the relevance vectors chosen based on Fuzzy Rules has reduced the computational complexity based on considering its detection accuracy.
3.2. Comparisons on Retrieval Performance
p=
Model Error 0.099 0.028 0.017
560
AJAS
Yogapriya Jaganathan and Ila Vennila / American Journal of Applied Sciences 10 (6): 549-562, 2013
Emmanuel, M., D.R.R. Babu, J. Jagdale, P. Game and G.P. Potdar, 2010. Parallel approach for content based medical image retrieval system. J. Comput. Sci., 6: 1258-1262. DOI: 10.3844/jcssp.2010.1258.1262 Ghosh, P., S. Antani, L.R. Long and G.R. Thoma, 2011. Review of medical image retrieval systems and future directions. Proceedings of the 24th International Symposium on Computer-Based Medical Systems, Jun. 27-30, IEEE Xplore Press, Bristol, pp: 1-6. DOI: 10.1109/CBMS.2011.5999142 Hong, L.I. and G. Chen, 2011. Image classification technique based on fuzzy-relevance vector machine. J. Inform. Computat. Sci., 8: 3989-3995. Hsu, W., S. Antani, L.R. Long, L. Neve and G.R. Thoma, 2009. SPIRS: A web-based image retrieval system for large biomedical databases. Int. J. Med. Inform., 78: S13-S24. DOI: 10.1016/j.ijmedinf.2008.09.006 Iakovidis, D.K., N. Pelekis, E.E. Kotsifakos, I. Kopanakis and H. Karanikas et al., 2009. A pattern similarity scheme for medical image retrieval. IEEE Trans. Inform. Technol. Biomed., 13: 442-450. DOI: 10.1109/TITB.2008.923144 Piatrik, T. and E. Izquierdo, 2009. Subspace clustering of images using ant colony optimisation. Proceedings of the 16th IEEE International Conference on Image Processing, Nov. 7-10, IEEE Xplore Press, Cairo, pp: 229-232. DOI: 10.1109/ICIP.2009.5414503 Rajendran, P. and M. Madheswaran, 2010. Hybrid medical image classification using association rule mining with decision tree algorithm. J. Comput. Ramamurthy, B. and K.R. Chandran, 2012. Content based medical image retrieval with texture content using gray level co-occurrence matrix and k-means clustering algorithms. J. Comput. Sci., 8: 10701076. DOI: 10.3844/jcssp.2012.1070.1076 Rashedi, E., H. Nezamabadi-Pour and S. Saryazdi, 2009. GSA: A gravitational search algorithm. Inform. Sci., 179: 2232-2248. DOI: 10.1016/j.ins.2009.03.004 Silva, S.F.D., M.X. Ribeiro, J.D.E.S.B. Neto, C. TrainaJr and A.J.M. Traina, 2011. Improving the ranking quality of medical image retrieval using a genetic feature selection method. Decision Support Syst., 51: 810-820. DOI:10.1016/j.dss.2011.01.015 Suganya, R. and S. Rajaram, 2012. Content based image retrieval of ultrasound liver diseases based on hybrid approach. Am. J. Applied Sci., 9: 938-945. DOI: 10.3844/ajassp.2012.938.945
This makes the proposed FOCS framework more feasible for CBMIR Systemand helpful for physician and medical research students.
5. CONCLUSION A hybrid approach based FOCS framework is proposed for effective retrieval of medical images, it comprises several benefits when compared to existing CBMIR. Texture Features are extracted using GLCM and TF and stored in a feature vector database. FuzzyPSO is used to reduce the feature vector dimensionality issues while selecting the important features in the feature vector database in which computational complexity is decreased. Fuzzy based RVM is used for feature classification in which it increases the response rate and speed of the retrieval process. Euclidean distance is used to identify the similarity between classified features and query image features. Results reflect that the proposed system using multiple features with optimization, classification and similarity measurements outperforms with respect to retrieval accuracy and precision as compared with existing CBMIR. This proposed FOCS framework is used to help the physician to obtain more confidence in their decisions for diagnosis and medical research students are zeal to get the essential images successfully for further investigation of their research.
6. ACKNOWLEDGEMENT We would like to thank Dr. P. Senthil Kumar, MDRD, DNB, Radiologist, Saravana Scans, Salem, for providing the medical image database used in this study and also for his valuable guidance to our work. We would like to thank Prof. R. Arangasamy and Prof. K. Devaki, who have worked with us in our dataset collection.
7. REFERENCES Akgul, C.B., D.L. Rubin, S. Napel, C.F. Beaulieu and H. Greenspan et al., 2011. Content-based image retrieval in radiology: Current status and future directions. J. Digital Imag., 24: 208-222. DOI: 10.1007/s10278-010-9290-9 Deserno, T.M., S. Antani and R. Long, 2009. Ontology of gaps in content-based image retrieval. J. Digital Imag., 22: 202-215. DOI:10.1007/s10278-007-9092-x Science Publications
561
AJAS
Yogapriya Jaganathan and Ila Vennila / American Journal of Applied Sciences 10 (6): 549-562, 2013
Wu, J., X. Wang, D. Yan, C. Wei and Y. Zhang, 2009. Method for medical image retrieval based on frequency layer feature. Proceedings of the International Conference on Information Technology and Computer Science, Jul. 25-26, IEEE Xplore Press, Kiev, pp: 622-624. DOI: 10.1109/ITCS.2009.321 Xue, Z., S. Antani, L.R. Long, G.R. Thoma, 2009. A system for searching uterine cervix images by visual attributes. Proceedings of the 22nd IEEE International Symposium on Computer Based Medical Systems, Aug. 2-5, IEEE Xplore Press, Albuquerque, NM., pp: 1-5. DOI: 10.1109/CBMS.2009.5255319 Ye, Z., B. Xia, D. Wang and X. Zhou, 2009. Weight optimization of image retrieval based on particle swarm optimization algorithm. Proceedings of International Symposium on Computer Network and Multimedia Technology, Jan.18-20, IEEE Xplore Press, Wuhan, pp: 1-3. DOI: 10.1109/CNMT.2009.5374753
Science Publications
Yogapriya, J. and I. Vennila, 2012. Medical image retrieval system using ggre framework. Proceedings of the International Conference on Pattern Recognition, Informatics and Medical Engineering, Mar. 21-23, IEEE Xplore Press, Salem, Tamilnadu, pp: 246-251. DOI: 10.1109/ICPRIME.2012.6208352 Yong-Feng, X. and Z. Shu-Ling, 2009. Fuzzy particle swarm clustering of infrared images. Proceedings of 2nd International Conference on Information and Computing Science, May 21-22, IEEE Xplore Press, Manchester, pp: 122-124. DOI: 10.1109/ICIC.2009.139 Zhu, Z., C. Zhao and Y. Hou, 2012. Research on similarity measurement for texture image retrieval. PLoS ONE, 7: e45302-e45302. DOI: 10.1371/journal.pone.0045302
562
AJAS