A Kansei Database Framework for the Delight Design Platform Hideyoshi Yanagisawa1,*, Sohya Nakano1, and Tamotsu Murakami1 1
The University of Tokyo, School of Engineering, Department of Mechanical Engineering 7-3-1, Hongo, Bunkyo, Tokyo, 113-8656, Japan {hide@mech,
[email protected]., murakami@mech}t.u-tokyo.ac.jp
Abstract. The delight design platform (DDP) is a vision of a new integrated design environment that would enable design engineers to consistently design delightful products. Such delightful products satisfy an attractive quality as well as the performance and must-have qualities of the Kano model. The attractive quality depends on a customer’s subjective evaluation involving emotion. To implement DDP, we aim to develop a model-based design (MBD) environment that can simulate a customer’s affective responses toward digital design models. With this environment, a designer can test their ideas in the early-design phase. In this article, we propose a Kansei database framework as an essential component of the DDP. The Kansei database stores functions that estimate the customer’s emotional responses to the design model. We propose a Kansei database structure including two indexes, perception and delight, with a delight map as a visualization scheme. Furthermore, we propose a methodology to create the indexes. Keywords: Kansei ·Delight Design · Database · Model Based Design
1
Motivation
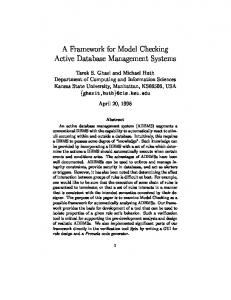
Products that satisfy the users’ positive emotions, in addition to providing the desired functionality, succeed in the recent matured market. The Kano model classified product qualities into three types: must-have, one-dimensional, and attractive (Figure 1, left) [1]. The must-have quality is a quality that the product must have, such as safety and basic functionality. A one-dimensional quality, e.g., performance, linearly correlates to the customer’s satisfaction. The attractive quality provides satisfaction when achieved fully, but does not cause dissatisfaction when it is not achieved, e.g., aesthetics and perceived quality. Here, we define a delight design as a design with all three qualities together (Figure 1, right). Our objective is to develop a delight-design platform that helps design engineers to integrate all three qualities. In recent engineering designs, tools for model-based design (MBD) and related design environments, such as Modelica [2], are being developed for concept design. Such a design environment enables a design engineer to build an essential physical
model of the entire product on a computer. Simulation using such a model provides feedback to the designers in the early-design phases so that they can test their ideas before making physical prototypes. Such essential physical models and simulations in the early-design stage help design engineers make a global strategy before entering the detailed-design stage. To create a delight design, the designer must solve psychological problems involving customer perception and emotion as well as the physical problems of a product because the attractive quality depends highly on the customer’s subjective evaluation. Product perception and emotion have been studied in Kansei and emotion research [310]. Kansei is a Japanese word that refers to a series of cognitive functions for experiencing psychological phenomena, such as feeling, aesthetics, affective meaning, and emotion [8]. In a product-development context, Kansei is often interpreted as a mapping function from physical stimuli to such psychological phenomena. Researchers and practitioners have developed several methodologies and tools to link product attributes and psychological phenomena with industrial applications (e.g., [3, 4, 8]). However, they can still be specifically applied to common engineering-design processes. To create a delight design platform, we aim to integrate these Kansei methodologies into an engineering-design platform such as MBD so that general design engineers, such as a mechanical designer, can evaluate the attractive quality based on a customer’s Kansei. A key technical issue is to formalize the mapping between the engineering physical world and the customer’s psychological world. Such a mapping can be used as a simulation component in MBD to estimate a customer’s psychological responses to a design model before building a physical prototype. Such an estimation provides the designer with a clear direction and quantitative feedback during the early-design stage. In this article, we propose a Kansei database framework that stores such Kansei mappings as a core component of the delight design platform. We discuss the concept of a Kansei database, including its role, structure, and output.
Attractive
One-dimensional (performance)
Attractive
Performance Must-have
Must-have
Fig. 1. Three qualities and a delight design pyramid
2
Role of a Kansei Database in the Delight Design Platform
Products produce physical phenomena, such as light, sound, vibration, heat, flow, pressure, movement, etc. These physical phenomena work as sensory stimuli to product users. Users perceive the sensory stimuli and demonstrate their appraisals using emotions, such as comfort or annoyance. Certain positive appraisals of sensory stimuli provide the users with a delightful experience. The design engineer composes a product structure to achieve the desired physical phenomena, i.e., sensory stimuli. A recent advanced concept design environment based on MBD [2] enables designers to model the entire product on a computer and simulate the physical phenomena of the digital model before making physical prototypes. However, such an engineering simulator does not estimate the user’s responses regarding his appraisal of the physical phenomena. In the delight design platform, the Kansei database aims to provide a set of mapping functions that estimate the user’s cognitive and affective responses from physical phenomena as sensory stimuli. Such mapping functions work as components in the MBD environment that estimate the user’s responses to the physical phenomena simulated with the digital model of a product (Figure 2). Physical quantity
Perception index Delight index
Kansei DB
Product simulation model (MBD)
Estimates of users’ responses (Delight map)
Fig. 2. Role of a Kansei database in the delight design platform
3
Kansei Database Structure
Between the sensory stimuli and the delightful experience, we assume two cognitive layers: the perceived feature and delight factor, as shown in Figure 3. Perceived features are sensory-stimulus features perceived by the user about a product. For example, the loudness or sharpness of a machine sound are examples of perceived features. Delight factors are elements that the user finds in a combination of the perceived features that provide a delightful experience. We define two indexes corresponding to the two layers, the perception index and the delight index, as components of the Kansei database. The perception index is a function that estimates the user’s responses to a perceived feature from the physical quantity of sensory stimuli. Candidates for perception indexes have been studied,
some of them have been standardized, for each sensory modality, e.g., vision, hearing, and touch. For example, the psychoacoustics research field provides sound-quality metrics (SQM) that estimate the acoustic perceptions of sound qualities, such as loudness, sharpness, roughness, and fluctuation strength [11]. CIE (the International Commission on Illumination) provides a model for color appearance [12]. The delight index, a scale of the delight factor, is a function of perception-index combinations. For example, certain conditions of sound-quality metrics provide a comfortable sound. The definition of a delight index may differ depending on the conditions, e.g., target product, individual, and situation. Thus, we need a methodology to create delight indexes for each design target. To do this, we can apply several methods developed in the Kansei research field (e.g., [8]). We propose an integrated methodology for creating delight indexes in the next chapter. Figure 3 summarizes the essential structure of a Kansei database. Such hierarchical models are typical in Kansei research and different layers have been developed for certain contexts. For example, Bouchard et al. proposed three layers of Kansei information: high, middle, and low [13]. The high level includes values, semantic adjectives, emotions, analogies, and style. The middle level consists of sector names (e.g., product type), context, and function. The low level includes product attributes such as color, shape, and texture. The high, middle, and low levels roughly correspond to the delight factor, condition, and perceived factor, respectively. The key idea of our structure is to discriminate the perception index from the delight index depending on certain conditions. With this structure, we can consolidate perception-science knowledge for each sensory modality as perception indexes and reuse them in different situations. The reusability of the indexes is an important element of the database structure. Physical phenomena e.g. sound Physical quantity PQ
Perceived feature
Delight factor
e.g. sound quality metrics
e.g. comfort metrics
Perception index P = g(Ph)
e.g. product Individuals situation
Delight index D = f(PI|CND)
Condition CND
Fig. 3. Kansei database structure
4
Delight Map
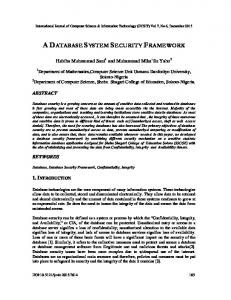
To visualize the output of the Kansei database, we developed a delight map, which shows estimates of the user’s responses to sensory stimuli and the desired direction for improving the design. Figure 4 shows an example of a delight map for product sound qualities. Each plot denotes the machine sound of different products. The coor-
dinate system represents an SQM space as perception indexes. In this example, four SQMs for each sound sample were calculated. We applied principal component analysis (PCA) to map four-dimensional indexes into two-dimensional principal components (PC). PCA composes an orthogonal space involving fewer PCs so that information on the data is kept as much as possible. The vertical and horizontal axes denote the first and second PCs, respectively. Each PC consists of a weighted sum of the original data (SQMs as perception indexes in this example). The weights are called PC loadings. PCi aij Pj ,
(1)
j
where Pj is the jth perception index and aij is the ith PC loading. The arrows in Figure 4 represent PC loadings as vectors in PC space. With the plots, design engineers can understand the positions of their own products by comparing them with competing products in the perception space. The depth denotes the user’s response to a delight index. The contour lines represent the estimates. Figure 4 shows an example of “comfort” as a delight factor, where a positive value represents “comfortable” and a negative value represents “annoying.” In this example, we used five levels of semantic-differential (SD) scales, such as “comfortable-annoying” for scoring the extent of the sound comfort. To make a delight index here, we applied multiple regression analysis (MRA) with the SD scores of a delight factor as the objective variable and the PCs of SQMs as the explanatory variables. Dˆ f ( P ) bi PCi aij bi Pj , i
i
(2)
j
where Dˆ is an estimate of the delight index and bi is the regression coefficient of the ith PC. Such a linear MRA is the simplest way to create a delight index (the function f). Several sophisticated regression models, including non-linear models, can be applied in a detailed analysis [8]. However, the simple linear regression has an advantage in a practical design. For design engineers who are not statistical-analysis professionals, it is easy to interpret the results of such a linear regression. The linear regression provides rough directions to improve the design for a delight index. In the Figure 4 example, the lower left is the direction for improving the sound comfort. The cross plots with numbers denote products (hairdryers) in the current market. To increase the sound comfort, a designer improved the product No. 23 sound, which was evaluated as a little annoying, by decreasing the sharpness and loudness. The circle plots named “23-improved” in Figure 4 represent the improved sound of product No. 23. We can confirm that the estimated comfort of the design has improved. On the other hand, the circle plot named “Novel design” in Figure 4 denotes the sound quality of a new design involving a novel structure that achieved a powerful wind with low fan revolutions based on an ejector-pump structure. Low fan revolutions provide low sharpness. As a result, we can see that the comfort estimate shows a positive value.
Fig. 4. Example of a delight map for product sound quality
5
Conclusion
We proposed a Kansei database framework for a delight design platform. The Kansei database provides functions to estimate the perceptual and emotional responses to the sensory stimuli of a product. These functions, embedded in an MBD as simulation components, enable design engineers to test their ideas with respect to the customers’ perception and emotion in the early-design phase. Rapid feedback in the early-design stage affects both the efficiency and creativity of the design activity. Kansei may differ from person to person. With the Kansei database, designers can grasp the Kansei of target customers that may differ from their own. Furthermore, the Kansei database provides directions to improve the design object with respect to delight factors. The key feature of the proposed Kansei database structure is that the perception index is separate from the delight index. Perception indexes are common among different conditions. Different manufacturers in different sectors in different fields can share those indexes collected from the distributed research field of perception science for each modality. On the other hand, delight indexes depend on set conditions, such as product sector, target user, and context. Each manufacturer creates an original delight index with the methodology. Therefore, the independence of the perception index and the delight index provides both reusability and originality for the Kansei database.
Acknowledgments This paper is based on results obtained from a project commissioned by New Energy and Industrial Technology Development Organization(NEDO). We thank all the project members, including The University of Tokyo, Lattice Technology, and Zuken. We especially thank Professor Hiromasa Suzuki, Dr. Koichi Ohtomi, and Mr. Hitoyuki Katayama for supporting this work.
References 1. Kano, N., Seraku, N., Takahashi, F., Tsuji, S.: Attractive quality and must-be quality. The Journal of the Japanese Society for Quality Control 14, 39-48 (1984) 2. Fritzson, P.: Introduction to modeling and simulation of technical and physical systems with Modelica. John Wiley & Sons (2011) 3. Nagamachi, M.: Kansei engineering as a powerful consumer-oriented technology for product development. Applied Ergonomics 33, 289-294 (2002) 4. Schütte, S.T.W., Eklund, J., Axelsson, J.R.C., Nagamachi, M.: Concepts, methods and tools in Kansei engineering. Theoretical Issues in Ergonomics Science 5, 214-231 (2004) 5. Norman, D.A.: Emotional design: Why we love (or hate) everyday things. Basic books (2004) 6. Desmet, P., Hekkert, P.: Framework of product experience. International Journal of Design 1, (2007) 7. Bouchard, C., Kim, J., Aoussat, A.: Kansei information processing in design. Proceeding of IASDR 2009 (2009) 8. Yanagisawa, H.: Kansei quality in product design. Emotional engineering, pp. 289-310. Springer (2011) 9. Boatwright, P., Cagan, J.: Built to Love. San Francisco: Berret-Koehler (2010) 10.Fukuda, S.: Emotional engineering: service development. Springer Science & Business Media (2010) 11.Fastl, H., Zwicker, E.: Psychoacoustics: Facts and models. Springer Science & Business Media (2007) 12.CIE159-2004: A colour appearance model for colour management systems: CIECAM02. CIE (2002) 13.Bouchard, C., Kim, J.: About the nature of Kansei information. Advances in Affective and Pleasurable Design 19, 217 (2014)