Transactions of the SDPS: Journal of Integrated Design and Process Science 20 (2), 2016, 73-84 DOI 10.3233/jid-2016-0014 http://www.sdpsnet.org
A Proposal of Kansei Database Framework and Kansei Modelling Methodology for the Delight Design Platform Hideyoshi Yanagisawa*, Sohya Nakano and Tamotsu Murakami Department of Mechanical Engineering, The University of Tokyo, Tokyo, Japan Abstract The delight design platform (DDP) is a vision of a new integrated design environment that would enable design engineers to consistently design delightful products. Such delightful products satisfy an attractive quality as well as the performance and must-have qualities of the Kano model. The attractive quality depends on a customer’s subjective evaluation involving emotion. To implement DDP, we aim to develop a model-based design (MBD) environment that can simulate a customer’s affective responses toward digital design models. With this environment, a designer can test their ideas in the early-design phase. In this article, we propose a Kansei database framework as an essential component of the DDP. The Kansei database stores functions that estimate the customer’s emotional responses to the design model. Firstly, we propose a Kansei database structure including two indexes, perception and delight, with a delight map as a visualization scheme. Secondly, we propose a cyclic Kansei model of product experience. Based on the model, we propose a methodology to model the user’s cognitive structure while interacting with a product, and create the indexes. Furthermore, we discuss the effect of scene-transition expectations on the user’s response to a delightful experience. Keywords: Kansei database, Kano model, model based design, expectation
1.
Motivation
Products that satisfy the users’ positive emotions, in addition to providing the desired functionality, succeed in the recent matured market. The Kano model classified product qualities into three types: musthave, one-dimensional, and attractive (Fig. 1, left) (Kano et al., 1984). The must-have quality is a quality that the product must have, such as safety and basic functionality. A one-dimensional quality, e.g., performance, linearly correlates to the customer’s satisfaction. The attractive quality provides satisfaction when achieved fully, but does not cause dissatisfaction when it is not achieved, e.g., aesthetics and perceived quality. Here, we define a delight design as a design with all three qualities together (Fig. 1, right). Our objective is to develop a delight-design platform that helps design engineers to integrate all three qualities. In recent engineering designs, tools for model-based design (MBD) and related design environments, such as Modelica (Fritzson, 2011), are being developed for concept design. Such a design environment enables a design engineer to build an essential physical model of the entire product on a computer. Simulation using such a model provides feedback to the designers in the early-design phases so that they
*
Corresponding author. Email:
[email protected]. Tel: (+81) -3-5841-6330.
1092-0617/€27.50© 2016 – IOS Press and the authors This article is published online with Open Access and distributed under the terms of the Creative Commons Attribution Non-Commercial License.
74
Yanagisawa et al. / A Proposal of Kansei Database Framework and Kansei Modelling Methodology
can test their ideas before making physical prototypes. Such essential physical models and simulations in the early-design stage help design engineers make a global strategy before entering the detailed-design stage. To create a delight design, the designer must solve psychological problems involving customer perception and emotion as well as the physical problems of a product because the attractive quality depends highly on the customer’s subjective evaluation. Product perception and emotion have been studied in Kansei and emotion research (Boatwright & Cagan, 2010; Bouchard et al., 2009; Desmet & Hekkert, 2007; Fukuda, 2010; Nagamachi, 2002; Norman, 2004; Schütte et al., 2004; Yanagisawa, 2011). Kansei is a Japanese word that refers to a series of cognitive functions for experiencing psychological phenomena, such as feeling, aesthetics, affective meaning, and emotion (Yanagisawa, 2011). In this paper, we followed this definition of Kansei. By this definition, emotion is a psychological phenomenon evoked through Kansei. In other words, emotion is an output of Kansei. In a product-development context, Kansei is often interpreted as a mapping function from physical stimuli to such psychological phenomena. Researchers and practitioners have developed several methodologies and tools to link product attributes and psychological phenomena with industrial applications (e.g. (Nagamachi, 2002; Schütte, et al., 2004; Yanagisawa, 2011)). However, they can still be specifically applied to common engineering-design processes. To create a delight design platform, we aim to integrate these Kansei methodologies into an engineering-design platform such as MBD so that general design engineers, such as a mechanical designer, can evaluate the attractive quality based on a customer’s Kansei. A key technical issue is to formalize the mapping between the engineering physical world and the customer’s psychological world. Such a mapping can be used as a simulation component in MBD to estimate a customer’s psychological responses to a design model before building a physical prototype. Such an estimation provides the designer with a clear direction and quantitative feedback during the early-design stage. In this article, we propose a Kansei database framework that stores such Kansei mappings as a core component of the delight design platform. Firstly, we discuss the concept of a Kansei database, including its role, structure, and output. Next, we propose a methodology for modelling Kansei mappings that involves both qualitative and quantitative approaches. Finally, we discuss the effect of expectation in a user context and conclude with future work.
Attractive
One-dimensional (performance)
Attractive
Performance Must-have
Must-have
Fig. 1. Three qualities and a delight design pyramid.
Yanagisawa et al. / A Proposal of Kansei Database Framework and Kansei Modelling Methodology
2. 2.1.
75
Kansei Database Concept Role of a Kansei database in the delight design platform
Products produce physical phenomena, such as light, sound, vibration, heat, flow, pressure, movement, etc. These physical phenomena work as sensory stimuli to product users. Users perceive the sensory stimuli and demonstrate their appraisals using emotions, such as comfort or annoyance. Certain positive appraisals of sensory stimuli provide the users with a delightful experience. The design engineer composes a product structure to achieve the desired physical phenomena, i.e., sensory stimuli. A recent advanced concept design environment based on MBD (Fritzson, 2011) enables designers to model the entire product on a computer and simulate the physical phenomena of the digital model before making physical prototypes. However, such an engineering simulator does not estimate the user’s responses regarding his appraisal of the physical phenomena. In the delight design platform, the Kansei database aims to provide a set of mapping functions that estimate the user’s cognitive and affective responses from physical phenomena as sensory stimuli. Such mapping functions work as components in the MBD environment that estimate the user’s responses to the physical phenomena simulated with the digital model of a product (Fig. 2).
Physical quantity
Perception index Delight index
Kansei DB
Product simulation model (MBD)
Estimates of users’ responses (Delight map)
Fig. 2. Role of a Kansei database in the delight design platform.
2.2.
Kansei database structure
Between the sensory stimuli and the delightful experience, we assume two cognitive layers: the perceived feature and delight factor, as shown in Fig. 3. Perceived features are sensory-stimulus features perceived by the user about a product. For example, the loudness or sharpness of a machine sound are examples of perceived features. Delight factors are elements that the user finds in a combination of the perceived features that provide a delightful experience. We define two indexes corresponding to the two layers, the perception index and the delight index, as components of the Kansei database. The perception index is a function that estimates the user’s responses to a perceived feature from the physical quantity of sensory stimuli. Candidates for perception indexes have been studied, some of them have been standardized, for each sensory modality, e.g., vision, hearing, and touch. For example, the psychoacoustics research field provides sound-quality metrics (SQM) that estimate the acoustic perceptions of sound qualities, such as loudness, sharpness, roughness, and fluctuation strength (Fastl & Zwicker, 2007). CIE (the International Commission on Illumination) provides a model for colour appearance (CIE159-2004, 2002). The delight index, a scale of the delight factor, is a function of perception-index combinations. For example, certain conditions of sound-quality metrics provide a comfortable sound. The definition of a delight index may differ depending on the conditions, e.g., target product, individual, and situation. Thus,
76
Yanagisawa et al. / A Proposal of Kansei Database Framework and Kansei Modelling Methodology
we need a methodology to create delight indexes for each design target. To do this, we can apply several methods developed in the Kansei research field (e.g., (Yanagisawa, 2011)). We propose an integrated methodology for creating delight indexes in the next section. Fig. 3 summarizes the essential structure of a Kansei database. Such hierarchical models are typical in Kansei research and different layers have been developed for certain contexts. For example, Bouchard et al. proposed three layers of Kansei information: high, middle, and low (Bouchard & Kim, 2014). The high level includes values, semantic adjectives, emotions, analogies, and style. The middle level consists of sector names (e.g., product type), context, and function. The low level includes product attributes such as colour, shape, and texture. The high, middle, and low levels roughly correspond to the delight factor, condition, and perceived factor, respectively. The key idea of our structure is to discriminate the perception index from the delight index depending on certain conditions. With this structure, we can consolidate perception-science knowledge for each sensory modality as perception indexes and reuse them in different situations. The reusability of the indexes is an important element of the database structure. Physical phenomena
Perceived feature
e.g., sound quality metrics e.g., sound quality metrics Physical quantity PQ
Perception index P = g(Ph)
e.g., product, Individuals, & situation
Delight factor e.g., comfort metrics Delight index D = f(PI|CND)
Condition CND
Fig. 3. Kansei database structure.
2.3.
Delight map
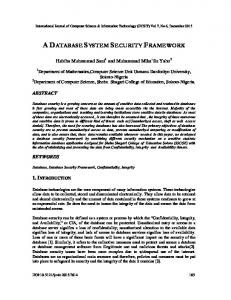
To visualize the output of the Kansei database, we developed a delight map, which shows estimates of the user’s responses to sensory stimuli and the desired direction for improving the design. Fig. 4 shows an example of a delight map for product sound qualities. Each plot denotes the machine sound of different products. The coordinate system represents an SQM space as perception indexes. In this example, four SQMs for each sound sample were calculated. We applied principal component analysis (PCA) to map four-dimensional indexes into two-dimensional principal components (PC). PCA composes an orthogonal space involving fewer PCs so that information on the data is kept as much as possible. The vertical and horizontal axes denote the first and second PCs, respectively. Each PC consists of a weighted sum of the original data (SQMs as perception indexes in this example). The weights are called PC loadings. 𝑃𝐶𝑖 = ∑ 𝑎𝑖𝑗 𝑃𝑗 ,
(1)
𝑗
where Pj is the jth perception index and aij is the ith PC loading. The arrows in Fig. 4 represent PC loadings as vectors in PC space. With the plots, design engineers can understand the positions of their own products by comparing them with competing products in the perception space. The depth denotes the user’s response to a delight index. The contour lines represent the estimates. Fig. 4 shows an example of “comfort” as a delight factor, where a positive value represents “comfortable” and a negative value represents “annoying.” In this example, we used five levels of semantic-differential (SD)
Yanagisawa et al. / A Proposal of Kansei Database Framework and Kansei Modelling Methodology
77
scales, such as “comfortable-annoying” for scoring the extent of the sound comfort. To make a delight index here, we applied multiple regression analysis (MRA) with the SD scores of a delight factor as the objective variable and the PCs of SQMs as the explanatory variables. ̂ = 𝑓(𝑃) = ∑ 𝑏𝑖 𝑃𝐶𝑖 = ∑ ∑ 𝑎𝑖𝑗 𝑏𝑖 𝑃𝑗 , 𝐷 𝑖
𝑖
(2)
𝑗
where Dˆ is an estimate of the delight index and bi is the regression coefficient of the ith PC. Such a linear MRA is the simplest way to create a delight index (the function f ). Several sophisticated regression models, including non-linear models, can be applied in a detailed analysis (Yanagisawa, 2011). However, the simple linear regression has an advantage in a practical design. For design engineers who are not statistical-analysis professionals, it is easy to interpret the results of such a linear regression. The linear regression provides rough directions to improve the design for a delight index. In the Fig. 4 example, the lower left is the direction for improving the sound comfort. The cross plots with numbers denote products (hairdryers) in the current market. To increase the sound comfort, a designer improved the product No. 23 sound, which was evaluated as a little annoying, by decreasing the sharpness and loudness. The circle plots named “23-improved” in Fig. 4 represent the improved sound of product No. 23. We can confirm that the estimated comfort of the design has improved. On the other hand, the circle plot named “Novel design” in Fig. 4 denotes the sound quality of a new design involving a novel structure that achieved a powerful wind with low fan revolutions based on an ejector-pump structure. Low fan revolutions provide low sharpness. As a result, we can see that the comfort estimate shows a positive value.
Fig. 4. Example of a delight map for product sound quality.
Yanagisawa et al. / A Proposal of Kansei Database Framework and Kansei Modelling Methodology
78
3.
Methodology for Creating Indexes Stored in the Kansei Database
Here, we propose a methodology for creating indexes in the Kansei database. The methodology consists of two phases. The first phase is qualitative modelling of the user’s Kansei in interactions with a product. We model the user’s cognitive structure involving delight factors and perceived features. The second phase is a quantitative modelling based on the qualitative model hypothesized in the first phase. In this phase, we formalize the delight indexes. In this section, we propose a general mental model of Kansei. Based on the model, we propose the methodology for each phase. 3.1.
Cyclic Kansei model through interactions between user and product
Fig. 5 shows the Kansei model that we assumed as a basis of our methodology. The upper part represents the physical world involving a product, a user, and an environment. The lower part is the user’s mental world involving a series of cognitive processes. The cyclic interactions of the user’s actions and the sensations work as an interface between the physical world and the mental world. The user acts toward the physical world and senses a stimulus from the physical world as a result of the action. For example, a user looks at and touches a product, and obtains visual and tactile sensation as feedback stimuli. Thus, action and sense are complementary. The user perceives features from the interaction of action and sense. By combining the features, he/she finds certain meanings (Krippendorff, 2005). The user evaluates the meaning in a situation (appraisals or estimates (Scherer et al., 2001)) and feels certain emotions. Emotions derive motivations to act towards the physical world (Fukuda, 2010), such as approach or avoid (Crilly et al., 2004). This cyclic process continues during the interaction between the user and a product. The user’s mental model is built based on past experiences, and the knowledge affects and changes each mental process. A mental model can bias a perceived feature as an illusion (Yanagisawa & Takatsuji, 2015). A mental model interacts with each cognitive component, such as meanings, appraisals, emotion, and motivation. Product Environment Physical world Act
Stimulus
Sense Mental world Motivation
Perception Mental model
Emotion
Meaning Appraisal estimate
Fig. 5. A cyclic Kansei model in user-product interactions.
Yanagisawa et al. / A Proposal of Kansei Database Framework and Kansei Modelling Methodology
3.2.
79
Phase 1: qualitative modeling for a user Kansei structure in interactions with a product
Based on the cyclic Kansei model in Fig. 5, we model a user’s cognitive structure and activities while interacting with a product. Fig. 6 shows an example of a structure model that we extracted from the context of using a hairdryer. We used a hairdryer as the product for further discussion because it produces a variety of sensory stimuli sensed in different modalities, such as vision, hearing, and touch. In Fig. 6, the vertical axis represents the user’s cognitive structure, whereas the horizontal axis represents the time series. On the bottom part, we placed a series of scenes. Each scene consists of an action-sense pair. For this example, we assumed a series of scene transitions where a user looks at their appearance, holds a hairdryer in their hand, turns on the switch, and uses it to dry their hair. For each scene, the user senses different sensory stimuli from the product. Based on the sensory stimuli, they recognize design objects, such as product attributes and physical phenomena, that occur in a scene. For example, a user recognizes the shape and colour by looking, the torque and texture by touching, the machine sound by turning on the switch and listening, and the inertia and hot air by using. These design objects are the targets of different expert designers/engineers, such as styling, colour, ergonomics, and sound design. At the same time, users perceive features of each design object. Based on a set of perceived features for each scene, they expect and/or evaluate delight factors. In the Fig. 6 example, we extracted four categories of delight factors: functionality, usability, reliability, and perceived quality. For example, the machine sound provides a perceived quality, such as comfort, as well as expectations of the product performance and reliability. These delight factors provide an emotional experience for each scene. Furthermore, the discrepancy between the delight-factor appraisals from different scenes affects the emotions. We will discuss this discrepancy effect in section 4. A positive emotion, such as delight, moves the user forward to the next scene. To extract state transitions and the cognitive structure, we apply several conventional methods. For the hairdryer example, we used user-observation techniques for extracting the scene transitions. We applied a laddering technique based on the personal-construct theory (Kelly, 2003b; Sanui & Maruyama, 1997) to extract the cognitive structure between the delight and the perceived features of the design element in each scene. Kelly’s personal-construct theory suggests that a person's psychological processes are channelled by the way s/he anticipates events (Kelly, 2003a). Such anticipation depends on a person’s past experiences. Customers may have unique anticipations based on past experiences such that a designer has not. Thus, extracting cognitive structure (or a construct system) from target customers is important to find potential cognitive factors and those relations. 3.3.
Phase 2: quantitative modeling of indexes for the Kansei database
Fig. 7 shows the corresponding relationships between the qualitative cognitive structure extracted in Phase 1 and the quantitative structure involving indexes for the Kansei database. We assumed three layers in the structure: Kansei, physical, and activity. The activity layer is an interaction between the user and product in a scene involving sense and action. From such an activity, we can observe and measure the user’s behavior and biological responses. The physical layer consists of the product structure and behavior, as well as sensory stimuli produced through the user-product interaction. For example, by turning on the hairdryer switch, the turning (behavior) of a fan connected to a motor in the housing (structure) produces a sound (stimulus). We can measure the physical quantity of the sensory stimulus, such as the sound spectrum. The design engineer determines the design parameters (e.g., specifications of the motor and fan, and shape parameters of the housing) to achieve the required physical quantity of the sensory stimulus. The Kansei layer includes perceived features and delight factors for the qualitative structure, and delight/perception indexes for the quantitative structure. Because the delight index, a core component of the Kansei database, depends on conditions such as product type, target customer, and context of use, each manufacturer must develop his own delight index for different conditions. Thus, we propose the following methodology to formalize a delight index regarding a target design object, e.g., product sound.
Yanagisawa et al. / A Proposal of Kansei Database Framework and Kansei Modelling Methodology
80
Delight of hairdryer
Delight (emotion)
Functionality Performance
Usability Easy to use
Quality Reliance
Perceived quality Aesthetics
evaluate
expect
Delight factors
Shape
Color
Torque
Texture
Sound
Inertia
Hot air
perceive
Stimulus (Design object)
Scene Sense Action
Vision Look
Somatosensor Hold
Touch & Audition Turn on switch
Somatosensor Use time
Fig. 6. Qualitative modeling for a user’s Kansei structure for the hairdryer example.
Delight factor
Comfort
Delight index
Perceived feature
Sound quality
Perception index
Sensory stimulus
Sound
Physical quantity
Kansei layer
Physical layer
Activity layer
Structure/behavior
Mechanical structure & behavior
Design parameter
Scene sense action
Hearing Turning on
Human behavior Biological activity
Example
Quantitative structure
Qualitative structure
Fig. 7. Correspondence between the qualitative and quantitative Kansei structures.
Yanagisawa et al. / A Proposal of Kansei Database Framework and Kansei Modelling Methodology
81
Firstly, we extract a set of words that express the delight factors for a target design object. The delight factor categories linked to a target design object (as shown in Fig. 6) guide us to extract the related words. Next, we extract the words expressing the perceived features of a design element that relate to the delight-factor words. As mentioned in Section 2.2, the metrics of the perceived features for each sensory modality have been investigated in different research disciplines. Some of them have been standardized. We can apply these metrics as the perception index of the perceived feature and store them in the Kansei database. For example, we can apply SQM (Fastl & Zwicker, 2007) as a perception index of the features perceived from a machine sound. To obtain the extracted words as evaluation items, we conducted an experiment with target customer participants to obtain responses for a target product. There are roughly three approaches to obtain user responses: cognitive, behavioral, and physiological (Bouchard & Kim, 2014). Each approach has advantages and disadvantages. We need to match the right approach with the right target. For example, it is easy to obtain cognitive responses from a machine sound, but difficult to obtain significant behavioral and physiological responses. On the other hand, behavioral responses such as eye tracking may provide significant information for a product appearance. To score cognitive responses, we can apply several psychological scales, such as an SD scale (Osgood, 1952). Finally, we formalize the relations between the scores regarding the selected words for the delight factors and the perceived index value calculated from the physical variables as a function Dˆ f ( P) , where P is the value of the perception indexes, and Dˆ estimates the delight index. We can apply several methods to formalize the relations (Yanagisawa, 2011). Multiple regression analysis, the simplest statistical approach, has been widely used in a variety of applications, although sophisticated methods are available, e.g., neural networks (Ishihara et al., 1995) and rough set theories (Mori, 2002; Yanagisawa & Fukuda, 2005). The subjective scores may vary from person to person due to the diversity of users’ Kansei. To analyze the diversity of the users’ Kansei, we can apply clustering techniques. For example, Yanagisawa et al. proposed a method to classify subjects using a cluster analysis with the correlation distances of SD scores, and conducted multiple regression analysis using the scores averaged in each cluster as objective variables (Yanagisawa et al., 2007). We can apply such a method to formalize a delight index for each customer’s type of delight factor.
4.
Expectation Discrepancy and the Expectation Effect
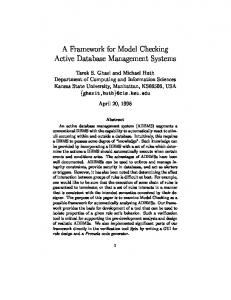
The difference between a prior expectation and the posterior experience affects the customer satisfaction (Murakami et al., 2011; Oliver, 1977). Thus, between a scene transition (Fig. 6), a discrepancy between the prior expectation and the posterior evaluation for a delight factor affects the overall satisfaction (Fig. 8). For example, a user expects the usability from a product appearance (“This looks easy to use.”), and determines the actual usability (“This is really easy to use.”). A positive expectation discrepancy (“This is easier to use than expected!”) provides a delightful experience. In contrast, a negative expectation discrepancy (“This is harder to use than expected.”) disappoints the user. Thus, to provide delightful experiences, it is important to design a scene-transition scenario that avoids negative expectation discrepancies and maximizes positive expectation discrepancies. The qualitative structure in Fig. 6 and the quantitative structure help a designer to find positive and negative discrepancies between scenes and the causal design parameters.
5.
Conclusion
We proposed a Kansei database framework for a delight design platform. The Kansei database provides functions to estimate the perceptual and emotional responses to the sensory stimuli of a product. These functions, embedded in an MBD as simulation components, enable design engineers to test their ideas with respect to the customers’ perception and emotion in the early-design phase. Rapid feedback in the earlydesign stage affects both the efficiency and creativity of the design activity.
82
Yanagisawa et al. / A Proposal of Kansei Database Framework and Kansei Modelling Methodology
Delight
Discrepancy
Expectation effect
Expectation Prior scene
Evaluation
Delight factor Perceived feature
Posterior scene
Fig. 8. Effect of expectation discrepancy on a delight experience between scene transitions.
Kansei may differ from person to person. With the Kansei database, designers can grasp the Kansei of target customers that may differ from their own. Furthermore, the Kansei database provides directions to improve the design object with respect to delight factors. The key feature of the proposed Kansei database structure is that the perception index is separated from the delight index. Perception indexes are common among different conditions. Different manufacturers in different sectors in different fields can share those indexes collected from the distributed research field of perception science for each modality. On the other hand, delight indexes depend on set conditions, such as product sector, target user, and context. Each manufacturer creates an original delight index with the methodology proposed in Section 3. Therefore, the independence of the perception index and the delight index provides both reusability and originality for the Kansei database.
Acknowledgments A part of this paper is based on results obtained from a project commissioned by New Energy and Industrial Technology Development Organization (NEDO). We thank all the project members, including The University of Tokyo, Lattice Technology, and Zuken. We especially thank Professor Hiromasa Suzuki, Dr. Koichi Ohtomi, and Mr. Hiroyuki Katayama for supporting this work.
References Boatwright, P.& Cagan, J. (2010). Built to Love: San Francisco: Berret-Koehler. Bouchard, C.& Kim, J. (2014). About the Nature of Kansei Information. In Y. G. Ji & S. Choi (Eds.), Advances in Affective and Pleasurable Design (pp. 217-224): AHFE Conference. Bouchard, C., Kim, J., & Aoussat, A. (2009). Kansei Information Processing in Design. Proceeding of IASDR 2009. CIE159-2004. (2002). A Colour Appearance Model for Colour Management Systems: Ciecam02: CIE. Crilly, N., Moultrie, J., & Clarkson, P. J. (2004). Seeing Things: Consumer Response to the Visual Domain in Product Design. Design Studies, 25(6), 547-577. Desmet, P.& Hekkert, P. (2007). Framework of Product Experience. International Journal of Design, 1(1). Fastl, H.& Zwicker, E. (2007). Psychoacoustics: Facts and Models (Vol. 22): Springer Science & Business Media. Fritzson, P. (2011). Introduction to Modeling and Simulation of Technical and Physical Systems with Modelica: John Wiley & Sons. Fukuda, S. (2010). Emotional Engineering: Service Development: Springer Science & Business Media.
Yanagisawa et al. / A Proposal of Kansei Database Framework and Kansei Modelling Methodology
83
Ishihara, S., Ishihara, K., Nagamachi, M., & Matsubara, Y. (1995). An Automatic Builder for a Kansei Engineering Expert System Using Self-Organizing Neural Networks. International Journal of Industrial Ergonomics, 15(1), 13-24. Kano, N., Seraku, N., Takahashi, F., & Tsuji, S. (1984). Attractive Quality and Must-Be Quality. The Journal of the Japanese Society for Quality Control, 14(2), 39-48. Kelly, G. A. (2003a). A Brief Introduction to Personal Construct Theory International Handbook of Personal Construct Psychology (pp. 3-20). New York, NY, US: John Wiley & Sons Ltd. Kelly, G. A. (2003b). The Psychology of Personal Constructs: Volume Two: Clinical Diagnosis and Psychotherapy: Routledge. Krippendorff, K. (2005). The Semantic Turn: A New Foundation for Design: CRC. Mori, N. (2002). Rough Set Approach to Product Design Solution for the Purposed Kansei. Bulletin of Japanese Society for the Science of Design, 48(6), 85-94. Murakami, T., Nakagawa, S., & Yanagisawa, H. (2011). Proposal of "Expectlogy" as Design Methodology. International Conference on Engineering Design 2011, Nagamachi, M. (2002). Kansei Engineering as a Powerful Consumer-Oriented Technology for Product Development. Applied ergonomics, 33(3), 289-294. Norman, D. A. (2004). Emotional Design: Why We Love (or Hate) Everyday Things: Basic books. Oliver, R. L. (1977). Effect of Expectation and Disconfirmation on Postexposure Product Evaluations: An Alternative Interpretation. Journal of Applied Psychology, 62(4), 480-486. Osgood, C. E. (1952). The Nature and Measurement of Meaning. Psychological bulletin, 49(3), 197. Sanui, J.& Maruyama, G. (1997). Revealing of Preference Structure by the Evaluation Grid Method Advances in Human Factors and Ergonomics (pp. 471-474): Elsevier. Scherer, K. R., Schorr, A., & Johnstone, T. (2001). Appraisal Processes in Emotion: Theory, Methods, Research: Oxford University Press. Schütte, S. T. W., Eklund, J., Axelsson, J. R. C., & Nagamachi, M. (2004). Concepts, Methods and Tools in Kansei Engineering. Theoretical Issues in Ergonomics Science, 5(3), 214-231. doi: http://dx.doi.org/10.1080/1463922021000049980 Yanagisawa, H. (2011). Kansei Quality in Product Design Emotional Engineering (pp. 289-310): Springer. Yanagisawa, H.& Fukuda, S. (2005). Interactive Reduct Evolutional Computation for Aesthetic Design. Transactions of the ASME Journal of Computing and Information Science in Engineering, 1-7. Yanagisawa, H., Murakami, T., Noguchi, S., Ohtomi, K., & Hosaka, R. (2007). Quantification Method of Diverse Kansei Quality for Emotional Design: Application of Product Sound Design. Proceedings of ASME 2007 Design Engineering Technical Conferences and Computers and Information in Engineering Conference, Las Vegas, Nevada USA. Yanagisawa, H.& Takatsuji, K. (2015). Effects of Visual Expectation on Perceived Tactile Perception: An Evaluation Method of Surface Texture with Expectation Effect. International Journal of Design, 9(1), 39-51.
Author Biographies Dr. Hideyoshi Yanagisawa is Associate Professor of Design Engineering in the Department of Mechanical Engineering, The University of Tokyo. He is one of the leading researchers in the field of affective or Kansei design engineering. His main research interest is a design methodology for product perceptions and affective experience. He has developed and refined his methodology through applying it to industrial design projects with a broad range of corporate partners. The applications include shape aesthetics, product sound, lighting design, textures, color, and materials. His current projects include development of
84
Yanagisawa et al. / A Proposal of Kansei Database Framework and Kansei Modelling Methodology
delight design platform, Kansei database, cross modal design, expectology, long-lasting design, and semiotics in product perceived quality. Mr. Sohya Nakano was received the B.E degrees in mechanical engineering from the University of Tokyo, in 2015. He is now a master course student of the University of Tokyo. His research interest includes affective or Kansei design engineering and machine learning. His is currently working on the project of Kansei database for the delight design platform. Dr. Tamotsu Murakami is Professor of Design Engineering Laboratory in the Department of Mechanical Engineering, The University of Tokyo. He has been studying and teaching theories, methodologies and software/hardware tools to aid engineering and industrial design. His research interests include design engineering, design knowledge management, reliability design, usability design and humanware design. His research achievements are not only published as academic papers and presented at conferences but also commercialized, such as a refrigerative stereolithography system using sol-gel transformable photopolymer resin and color universal design tool using dithering technique.