A Lean Manufacturing Procedure using Value Stream Mapping and the Analytic Hierarchy Process Mariagrazia Dotoli, Maria Pia Fanti, Giuliana Rotunno
Walter Ukovich
Dept. of Electrical and Electronics Engineering Politecnico di Bari Bari, Italy {dotoli,fanti}@deemail.poliba.it,
[email protected]
Dept. of Industrial Engineering and Information Technology University of Trieste Trieste, Italy
[email protected]
Abstract— We present a novel lean manufacturing procedure relying on the Value Stream Mapping (VSM) tool and the Analytic Hierarchy Process (AHP) technique. The procedure is iterative and hierarchical. Starting from a detailed description of the manufacturing process by the Unified Modeling Language (UML), the VSM graphical approach allows the identification of non-value adding activities, and the AHP technique leads to a ranking of such system anomalies. The further application of the VSM tool produces an overall picture of the desired manufacturing system, and the UML framework allows to describe in detail the updated system activities. An application of the procedure to a real case study shows its effectiveness. Keywords— Lean Manufacturing, Value Stream Mapping, Unified Modelling Language, Analytic Hierarchy Process.
I.
INTRODUCTION
With the increased customer demand, for most manufacturing industries it has become increasingly important to continuously improve the manufacturing environment and the corresponding industrial process. The most widely known approach for such an improvement, originating from the Toyota production system, is lean manufacturing or lean production. Lean manufacturing is a multi-dimensional approach integrating a variety of management practices, e.g., just-in-time, quality systems, supplier management, and many more, into a streamlined, high quality system that produces finished products at the pace of customer demand with little or no waste [10]. The most common lean manufacturing tools are [1]: 1) cellular manufacturing, based on organizing processes into cells including all necessary resources; 2) Just-In-Time (JIT), where the demand is initiated by a customer and is transmitted backward, “pulling” production; 3) Kanbans, a signaling system for implementing JIT production; 4) Total Preventive Maintenance (TPM), where workers carry out regular equipment maintenance to prevent breakdowns; 5) setup time reduction, where system engineers continuously try to reduce machine setup times; 6) Total Quality Management (TQM), a continuous improvement system that is centered on the needs of customers and employs participative management; 7) 5S, focusing on effective work place organization and standardized work procedures. Basically, the major goal of the lean manufacturing tools is to reduce cost by
eliminating waste. The seven sources of waste identified by lean manufacturing are: over-production, waiting time, transportation, over-processing, inventory, motion, and scrap [6]. Although companies are involved in the “lean” change in their entirety with all their different areas, from marketing to control, a decisive role is played by logistics, which may be defined as process planning, organization, and management aimed at optimizing the flow of material and information within and outside the company to maximize profit [3]. This paper focuses on internal logistics in discrete manufacturing. Among the available lean manufacturing tools in the literature, Value Stream Mapping (VSM) [1] has emerged as a simple and effective approach to identify and reduce waste, while improving the overall operational control. However, the VSM process has been shown to be effective for linear flow manufacturing systems [2]. On the contrary, mapping a complex manufacturing system and identifying its critical issues is not straightforward [4]. In this paper we show that the Unified Modeling Language (UML) formalism [5] and the Analytic Hierarchy Process (AHP) decision making approach [9] can be successfully employed as a support to VSM to assess the macroscopic improvement actions identified by such a technique. In particular, we present a lean manufacturing procedure based on six steps. First, UML is employed to describe in detail the manufacturing system. Second, VSM is used to visualize the overall process activities, identifying the system anomalies in the value stream. If some anomalies are detected, in the third step AHP assesses the best response actions to eliminate them. Based on the AHP results, the VSM approach is used to establish the future vision of the value stream, with a reduced impact of non-value added activities. Hence, in the fifth step, UML is employed to redesign the manufacturing system, removing the main system anomalies. Finally, the designed changes are implemented. The procedure is iterative, to ensure that improvement is continuously achieved. With respect to the classical VSM technique, the proposed procedure offers several advantages: 1) it can be applied to complex manufacturing systems; 2) it leads at the same time to detailing the process activities (thanks to the use of the UML formalism) and to depicting the overall value stream into a high level picture (using the VSM conciseness); 3) it allows the quantitative assessment of the system anomalies (thanks to the AHP methodology).
with greater efficiency without sacrificing production. We now further specify the technique steps in the following.
1. Determine the current activity diagram by the UML formalism 2. Describe the current state map and identify the system anomalies by the VSM approach
No
Exit from procedure
Anomalies identified?
yes
3. Assess the priority of the system anomalies by the AHP decision making method 4. Remove the top system anomalies and determine the future state map by the VSM 5. Determine the future activity diagram by the UML formalism 6. Implement the changes in the manufacturing system process
Yes
Procedure successful?
No
Iteration
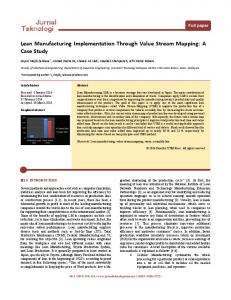
Figure 1. A scheme of the proposed lean manufacturing procedure.
The proposed technique is applied to a case study, namely a manufacturing process of an engineering company, OM Carrelli Elevatori SpA, a leading manufacturer of forklift trucks that is located in the mechanics industrial district of Bari (Italy). The selected production process refers to the flow of semi-worked pieces that, after being painted, enter the assembly line of forklift trucks. The internal logistics currently generates many wastes, numerous missing parts, and a working condition that is not fully in line with ergonomic principles. The application of the proposed technique to this case study has lead to the improvement of three key performance indicators in the company, enlightening the approach effectiveness. II.
THE LEAN MANUFACTURING PROCEDURE
This proposed lean manufacturing procedure is hierarchical and based on six steps, reported in Fig. 1. First, the UML formalism is employed to describe in detail the manufacturing process behavioral model, with its corresponding activities. UML is selected since it is a unified and well-known formalism that, using standardized, appropriate and effective diagrams, is capable of providing an accurate model of the process under consideration and can be easily translated into any simulation software. Second, the VSM approach is used to visualize in an integrated manner the material and information flow of the selected value stream, identifying the system anomalies, i.e., activities that do not add value to the manufacturing process. Third, the AHP decision making approach is employed to assess the best response actions to remove the identified system anomalies. Based on the AHP procedure results, the VSM approach is used to establish the future vision of the value stream, with a reduced impact of non-value added activities. Hence, in the fifth step, using the UML formalism the detailed activity diagram of the manufacturing system is re-designed, removing the main system anomalies. Finally, in the sixth and final step of the procedure, the designed changes in the manufacturing system are implemented. The procedure is iterative and can be recursively repeated at least annually, to ensure that improvement is continuously achieved. The ultimate result of the proposed lean approach is a solid and balanced flow that can meet the final customer requirements
A. Step 1: UML model of the current manufacturing system The first step of the proposed lean manufacturing procedure relies on UML [5], a graphic and textual modeling formalism suitable to understand and describe systems both from structural and behavioral viewpoints. In particular, UML allows describing in a standardized and detailed way the process activities and the corresponding actors. From the behavioral point of view, a system can by described in UML by activity diagrams that provide an overview of the system dynamics. The main elements of these diagrams are: the initial activity (denoted by a solid circle); the final activity (denoted by a bull’s eye symbol); other activities, represented by a rectangle with rounded edges; arcs, representing flows, connecting activities; forks and joins, depicted by a horizontal split, used for representing concurrent activities and actions respectively beginning and ending at the same time; decisions, representing alternative flows and depicted by a diamond, with options written on either sides of the arrows emerging from the diamond; signals representing activities sending or receiving a message, which can be of two types: input signals (message receiving activities), shown by a concave polygon, and output signals (message sending activities), shown by a convex polygon. Moreover, activities may involve different participants in a system. Hence, partitions or swim lanes are used to show which actor is responsible for which actions and divide the diagram into columns or swim lanes. B. Step 2: Value stream mapping of the current manufacturing system Once the detailed manufacturing system activities are described by the previous step, the second step of the procedure is to obtain an overall picture of the system to identify the nonvalue adding activities. To this aim, we employ VSM [1], a well-known lean manufacturing tool for strategic/tactical planning consisting in a visual mapping of all processes and activities that contribute to the production of a piece or part. In essence, the goal of the VSM analysis is the identification of waste. Thanks to its visual approach, the VSM methodology helps companies depict the whole flow of a single product and see where the production process is being slowed down. The related literature includes several application examples of VSM to discrete manufacturing systems (see for instance [8]). The VSM procedure typical elements are the following [7]: 1) Identifying the product or service to map: the value stream to be improved is determined, with its start and end points; 2) Drawing the current state map: the current situation (state) of the flow of material and information in the value stream is described, including all available information (tasks, costs, time for each task, delays in between stages of the process, etc.). To produce the current state map, a team observes the manufacturing processes and documents facts (cycle times, buffer sizes, personnel requirements, etc.) which are described in the map with standardized icons (see [2] for a list of icons); 3) Assessing the current state map: the procedure analyzes qualitatively whether each process activity is adding value, so that the system anomalies are identified. The detected imperfections in the flow are signalized by icons called bombs.
TABLE I SAATY’S AHP SCALE OF COMPARISONS. Intensity of Importance 1 3 5 7 9 2,4,6,8
options of a level, value cM ( j , k ) can be determined i
Definition Equal importance Moderate importance Strong importance Very strong importance Extreme importance Intermediate values between adjacent judgments
0
÷ 5 1
AHP scale
5
15
25
35
45
55
65
15 2
25 3
35 4
45 5
55 6
65 7
75 8
÷
÷
÷
÷
÷
÷
÷
i
( j, k ) =
cM
1 . k j ( , ) i
i
>75 9
C. Step 3: assessment of the manufacturing system anomalies by the Analytic Hierarchy Process We now specify the third step of the lean manufacturing technique, i.e., the step allowing the quantitative assessment of the state map with reference to the system anomalies that have been identified in the previous step. To perform such an assessment, we employ AHP, a well-known multi-objective decision making technique [9] for ranking a number of alternatives according to a set of conflicting criteria of various degrees of importance. We select AHP to single out the top system anomalies among the ones determined at the previous level. Indeed, since AHP is based on alternatives pairwise comparison, it turns out to exhibit an enhanced accuracy with respect to other decision making techniques. The AHP technique consists of the following elements [9]. 1. Structuring the decision problem as a hierarchy. The first AHP level is selected as the overall goal “Effectiveness”. Hence, the second AHP level is defined, that is composed by the n considered criteria contributing to the goal. The singled out n criteria or Key Performance Indicators (KPI) are relevant metrics to assess the detected imperfections in the material and information flow: lead time, inventory, etc. Moreover, the third AHP level is determined by the m identified system anomalies, that we wish to rank against the criteria or KPI defined in the second AHP level. 2. Constructing a set of pairwise comparison matrices. For each level of the AHP hierarchy (going from bottom to the top), the contribution of all the subsequent level options to the current level has to be determined. To this aim, a pairwise comparison matrix CM of dimension n×n is required 0
evaluating the importance of the n criteria of the second level in reaching the top objective and n additional matrices CM i
of dimension m×m with i=1,…,n express each how important the removal of each identified anomaly of the third level is with respect to the i-th criterion of the second and higher level. Each element cM ( j , k ) of CM with i=0,…,n represents the i
cM
3. Determining priorities and normalized performances from comparisons. For each comparison matrix CM with
TABLE II SAATY’S AHP SCALE OF COMPARISONS FOR MEASURABLE ALTERNATIVES. Pairwise differences
evaluating the percentage difference between values of the j-th and k-th options according to Table II [11]. Less important criteria are defined by reciprocals, so that
i
relative importance of the j-th anomaly compared to the k-th one and is determined interviewing the decision maker and associating to such an importance an integer from 1 to 9 (see Table I). If numerical performance values are available for all
i=0,…,n determine the maximum eigenvalue and the corresponding eigenvector vi with i=0,…,n. Obviously, v0 includes n elements, while all the other eigenvectors vi with i=1,…,n include m elements. Compute the priorities vector normalizing eigenvector v0 of CM as follows: 0
P=
v0
∑ j =1 v0 j n
= [ p1 ... pn ]T ,
(1)
where each element pi with i=1,…,n of P represents the normalized importance degree of the i-th criterion. Similarly, compute the normalized performance values of the alternatives against each i-th criterion as follows: CRITi =
∑
vi m
v
= [CRITi1 ... CRITim ]T with i=1,…,n. (2)
k =1 ik
4. Determining the decision model. For each identified system anomaly j with j=1,…,m, determine the weighted sum of the normalized performance values against each criterion weighted by the corresponding priority: n
PI j _ AHP =
∑ pi CRITi j
i =1
,
(3)
so that PIj_AHP quantifies the impact or significance degree of the j-th anomaly with respect to the set of criteria or KPI. 5. Ranking the alternatives. The identified system anomalies are ranked by their overall AHP index PIj_AHP. Obviously, the top anomaly is the one showing the highest index PIj_AHP obtained by (3). Hence, the greater the value of such an index, i.e., the higher the anomaly position ranking, the greater the necessity to required immediate resolution to the problem. D. Steps 4-5-6: Re-designing the manufacturing system Once the manufacturing system anomalies have been ranked by the previous step, the subsequent step of the procedure is to re-design the overall picture of the system eliminating (a number of top ranked) non-value adding activities. To this aim, we draw the future state map by VSM: in the fourth step of the procedure (see Fig. 1), a map describing the ideal future state of the manufacturing system is envisioned. The future state map shows the desired way in which the process in the stream should look in the future after the elimination of the (top) critical points identified and ranked in the previous steps of the
lean manufacturing procedure. Hence, we determine the UML model of the envisaged manufacturing system: in the fifth step of the procedure (see Fig. 1), the sketched vision of the value stream is detailed using the UML formalism, and a novel activity diagram of the manufacturing system is described, detailing all the activities in the updated system. Hence, an updated behavioral model of the manufacturing system is obtained in the UML framework. At this point, in the sixth step of the procedure (see Fig. 1), the identified improvement plans are implemented in the manufacturing system, so that the envisaged future state can be obtained. Obviously, to ensure continuous improvement and to verify the implementation plans, the proposed lean manufacturing procedure is iterated. III.
Figure 2. A scheme of the company production area.
THE CASE STUDY
A. The manufacturing system description The case study is a world leading manufacturer of forklift trucks, including several types of product families that depend on the forklift truck capacity or load. The production process is characterized by a high level of complexity, related to: 1) a large number of components; 2) a large number of suppliers; 3) a large number of types of finished products. In particular, production is characterized by an “open” bill of materials, eleven product families, and about thousands of final product types. The company manufacturing plant includes three production lines, corresponding to three main product families: electric, Diesel motorization, and gas motorization forklift trucks. In particular, the so-called IC 15-30 production line, assembling pallet trucks with diesel or gas motorization and with a capacity that varies from 15 to 30 tons, has been shown to be consistently less efficient than the other two production lines. Indeed, the flow of material related to the IC 15-30 assembly line generates a large number of waste, of missing parts (i.e., of errors in the management of material flows), and a low ergonomics level at the workstations. A scheme of the company production area is reported in Fig. 2 with reference to the considered inefficient production line. Apart from external suppliers that are in charge of outsourcing some types of raw pieces, the main zones of the production area are carpentry, the department painting, the assembly line, and several storehouses (the triangles in Fig. 2). In particular, the carpentry area is dedicated to the custom machining of some components required for the assembly. Moreover, in the department painting all the semi-worked pieces are painted. In addition, the area devoted to assembly operations is composed by the selected production line. Considering the flow of painted components arriving at the assembly line, we can distinguish between semi-worked pieces that are purchased from an outside supplier and components that are manufactured in the carpentry area. The first are mostly small components; the latter, on the contrary, are large semi-worked pieces manufactured by the company and stored in the carpentry storehouse. Both streams of semi-worked pieces, with a different supply policy, go into the department painting stock area and successively undergo the painting process. Once components are painted, they are stored into a dedicated area in the department painting. The painted components finally arrive at the assembly line in different ways, following the previous division into large and small pieces, ruled by a specific supply policy.
Figure 3. The current state activity diagram of the case study.
Figure 4. The current state map of the case study.
B. Application of the lean manufacturing procedure The proposed procedure application starts by analyzing the manufacturing system behavior. Accordingly, Fig. 3 reports the detailed activity diagram of the current production process, providing an overview of the system behavior by illustrating the activities related to the operations of the production stages in Fig. 2. In particular, the activity diagram specifies the actors involved in the process: storehouse employee, carpentry employee, team leader (department painting), painting employee, and assembly line worker. Hence, the application of VSM to the current process allows obtaining the current state map reported in Fig. 4. The figure shows the material flow, from left to right, and the backward information flow. Moreover, Fig. 4 shows graphically the component supply policy. In particular, the components provided by the external supplier are received by an employee according to a pull policy (it is labelled by the so-called Pull Arrow Icon in Fig.4) and, are provided to the painting department. In addition, the semiworked pieces arriving from the carpentry department are manually selected by the employee gathering information through visual means (it is labelled by the so-called Go See Icon in Fig.4) and according to a pull policy. After the painting, components are moved by a push policy (labelled by the so-
called Push Arrow Icon in Fig. 4) into the painted components storehouse. Parts are subsequently provided to the assembly line on the basis of the employees experience (labelled by additional Go See Icon in Fig.4). In addition, Fig. 4 shows that the information flow is managed by the SAP software, starting from the assembly line backward to the beginning of the manufacturing process. In particular, each time a complete forklift truck is assembled, an operator inserts by SAP the use of painted components originating from an external supplier, so that the corresponding storehouse receives an acknowledgement of the material use. A similar process is set up with respect to semi-worked pieces provided from the carpentry department. Since the information flow is not automated, the assembly line employee directly communicates the inventory needs to the painting department. The remaining information flow in the current state map is also not automated. Figure 4 reports the m=25 identified system anomalies associated to non-value added activities, depicting each of them by the so-called bomb icon. These anomalies, which have to be removed, are listed in Table III. Both the position of the system anomalies in Fig. 4 and their description in Table III show a high level of inefficiency in the assembly line and in the department painting storage area. In the subsequent step of the procedure we rank by the AHP decision making methodology the identified manufacturing system anomalies with respect to n=3 assessment criteria. More precisely, since the aim of the manufacturing process is producing a product without the occurrence of waste and missing parts and with a high level of ergonomics, we define n=3 KPI as follows: 1) waste number; 2) number of missing parts; 3) level of ergonomics. Hence, we define the AHP hierarchy: 1) the first level is the overall goal, i.e., a complete forklift truck at the assembly line output; 2) the second level is composed by the criteria that contribute to achieving the goal, i.e., the selected KPI; 3) the third level refers to all the identified manufacturing system anomalies. For each level of the AHP hierarchy (from bottom to top), the contribution of all the subsequent level options to the level is thus evaluated. To this aim, the pairwise comparison matrix CM of dimension 3×3 is determined, evaluating the 0
importance of the n=3 criteria of the second level in reaching the top objective (Fig. 5) as follows:
normalized importance degree of the i-th criterion with i=1,2,3. Similarly, we compute the normalized values of the system anomalies impact against each i-th criterion, by vectors CRIT1, CRIT2, and CRIT3, determined by (2). Hence, for each system anomaly we determine the weighted sum of the normalized impact against each criterion weighted by the corresponding priority by (3). The resulting index quantifies the significance degree of the j-th anomaly with respect to the set of criteria or KPI. Table IV reports in a descending order of importance the top five system anomalies, showing that the top problems are those numbered 4, 10, 18, 14, 21 in Table III. It is interesting to remark that the top-ranked criticalities in Table IV all show that the manufacturing process needs a suitable supply policy to properly manage the material flow. Accordingly, some plant parts need specific areas for parts storage. TABLE III IDENTIFIED SYSTEM ANOMALIES IN CURRENT STATE MAP. Numbering 1 2 3 4 5 6 7 8 9 10 11 12 13 14 15 16 17 18 19 20 21 22 23
CM
0
⎡ ⎢1 ⎢ 1 =⎢ ⎢5 ⎢1 ⎢ ⎢⎣ 3
⎤ 5 3⎥ ⎥ 1 3⎥ . ⎥ 1 ⎥⎥ 1 3 ⎥⎦
24 25
(4)
Hence, the n=3 matrices CM (not reported for the sake of i brevity) with i=1,2,3 of dimension 25×25 each are determined, expressing the anomaly impact with respect to the three second level criteria or KPI. Such matrices are determined using Tables I and II for the first two criteria and by Table I and by interviews to the company’s engineer in charge of the assembly line for the third criterion. Moreover, the priority vector P is determined by (1), with each element representing the
System anomaly Presence of type A mudguard in containers of type B mudguards in preparation area Missing of type B mudguards in mounting area Lack of specific zone for providing mudguards to assembly line Lack of procurement policy for mudguards Presence of footrests with mixed pieces in preparation area Mudguard storage in areas far from mounting area Lack of location for ballast top in XD last phase Lack of container for ballast top in XD last phase Impossibility of identification of ballast top in XD last phase Lack of procurement policy for ballast top Lack of location for fixing radiator rod in XD first phase Lack of container for fixing radiator rod in XD first phase Difficulty of identification of fixing radiator rod in XD first phase Lack of procurement policy for fixing radiator rod No marking of storage area for mounting line sides Lack of suitable containers for mounting line sides Presence in mounting line of sides of type B in chassis Lack of procurement policy for type B sides Absence of location for headlight fixing rod in PG mounting area Presence of rear fixing rod for headlight mounting on column in PG mounting area Lack of procurement policy for headlight mounting in PG mounting area Presence of painted mudguards on footrest in painting area Presence of mudguards ans sides in painted chassis area in painting area Difficulty of access to ballast top rack in painting area Difficulty to Kanban access in painting area
TABLE IV AHP RANKING OF TOP SYSTEM ANOMALIES IN CURRENT STATE MAP. Ranking Numbering Top 1 4 Top 2 10 Top 3 18 Top 4 14 Top 5
21
System anomaly Lack of procurement policy for mudguards Lack of procurement policy for ballast top Lack of procurement policy for type B sides Lack of procurement policy for fixing radiator rod Lack of procurement policy for headlight mounting in PG mounting area
Figure 5. The future state map. Storehouse Employee
Carpentry Employee
Team leader (Department painting)
Painting Employee
Assembly line Worker
assembly line with the implemented changes. Figure 7 shows that the introduction of a suitable supply policy between the department painting and the assembly line leads to about a 40% reduction both of waste and missing parts, already after the first week of the monitoring. Remarkably, these KPI are equal to zero after two more weeks. The improvement of the ergonomics level of the system, which was evaluated by interviews to employees, also shows that the implementation of the technique was successful in improving work places quality, thus reducing accident risks. Summing up, applying the proposed procedure to the case study leads to rationalizing the internal logistics, while reducing waste and costs. IV.
Semi-Worked pieces (storehouse flow)
Composition order painting Supply Semi-Worked pieces (area stock raw pieces)
Semi-Worked pieces (carpentry flow)
Delivery order painting
Supply Semi-Worked pieces (area stock Semi-Worked pieces)
Verify the presence of painted pieces (area stock painting)
The paper presents a novel lean manufacturing procedure for waste reduction in discrete manufacturing systems by internal logistics improvement. The approach is iterative and hierarchical, relying on the application of Unified Modeling Language, Value Stream Mapping, and Analytic Hierarchy Process. The integration of such techniques allows detecting the real criticalities of the system processes and assessing them quantitatively, in order to identify the most appropriate response actions to achieve the desired improvement. Future research refers to integrating the proposed method for lean manufacturing with simulation tools, to test suggested changes.
Receives order painting
Charge Semi-Worked pieces on rack
Painting
Discharge pieces on rack
no
else
Drawing pieces (area stock painting)
CONCLUSIONS
Drawing pieces on rack
Transport pieces (area stock painting)
Delivery pieces (area stock assembly line)
Assembly pieces
V. Figure 6. The future state activity diagram of the case study. 12
10
10 8
8
6
3 2
2
2 0
0
Week 0
Week 1
This work was partially supported by the SMARTT “Ritorno al Futuro” project funded by Apulia Region (Italy). The authors also wish to thank OM Carrelli Elevatori SpA staff, above all Eng. Salvatore Carluccio and Eng. Fabrizio Rinaldi for their support in the preparation of this paper.
Waste number
4
4
Week 2
0
Missing part number
Week 3
Figure 7. Monitoring of the implementation of the improvement plans.
After application of the subsequent step of the procedure in Fig. 1, we obtain the future state map of the system, reported in Fig. 5. This is obtained removing the top five system anomalies listed in Table IV. In particular, Fig. 5 includes, with respect to the original state map in Fig. 4, a suitable policy, as signaled by the so-called Supermarket Icon, modeling a so-called “supermarket” inventory with daily supply and a re-order logic based on a visual check performed by the assigned employee, who verifies whether the supermarket containers are empty and, if this is the case, requests the supply. Obviously, this graphical and compact picture of the system specifies the desired state but is not able to clarify in detail the system actors and activities. Hence, Fig. 6 shows the corresponding updated activity diagram, obtained removing the top five system anomalies and detailing the re-designed activities. We remark that Fig. 6 presents the same actors as the original activity diagram in Fig. 3, but includes a supply policy between the department painting and the assembly line. The sixth step of the procedure in Fig. 1, i.e., the implementation of the system changes, required about three weeks for full application, and Fig. 7 shows the results of the three weeks monitoring of the
ACKNOWLEDGEMENTS
References [1]
A.A. Abdulmalek and J. Rajgopal, “Analyzing the benefits of lean manufacturing and value stream mapping via simulation: A process sector case study”, Int.J. Prod. Econ., Vol. 107, 2007, pp.223-236. [2] M. Braglia, G. Carmignani, F. Zammori, “A new Value Stream Mapping approch for complex production system”, Int. J. Prod. Res., Vol. 44, 2006, pp. 3929-3952. [3] M. Christopher, Logistics and Supply Chain Management: Creating Value - Adding Networks. Prentice Hall, Edinburgh: UK, 4 Ed., 2010. [4] H. L. McManus, R. L. Millard, “Value Stream Analysis and Mapping for product development”, Proc. Int. Council Aeron. Sci. 23rd ICAS Congress, 2002, pp. 6103.1 – 6103.10. [5] R. Miles and K. Hamilton, “Learning UML 2.0”, O’Reilly Media, Sabastopol CA USA, 2006. [6] J. Narasimhan, L. Parthasarathy, P. S. Narayan, “Increasing the effectiveness of value stream mapping using simulation tools in engine test operations”, Proc. 18th IASTED Int. Conf. Modelling and Simulation, Montreal, Canada, 2007. [7] G..-Q. Pan, D.-Z. Feng, M.-X. Jiang, “Application Research of Shortening Delivery Time through Value Stream Mapping Analysis”, Proc. IEEE 17th Int. Conf. Ind. Eng. and Eng.Manag., pp. 733-736. [8] V. Ramesh, K.V. Sreenivasa Prasad, TR Srinivas, “Implementation of a Lean Model for Carrying out Value Stream Mapping in a Manufacturing Industry”, J.Industr. and Sys. Eng., Vol. 2, 2008, pp. 180-196. [9] T.L. Saaty T.L., “Decision making with the analytic hierarchy process”, Int. J. Serv. Sci., Vol. 1, pp. 83-98, 2008. [10] R. Shah and P.T. Ward, “Lean manufacturing: context, practice bundles, and performance,” J.Oper. Manag., Vol. 21, 2003, pp. 129-149. [11] E. Triantaphyllou, C.-T. Lin, “Development and evaluation of five fuzzy multiattribute decision-making methods”, Int. J. Approx. Reas., Vol. 14, 1996, pp. 281–310.