in a specific document compared to the inverse proportion of that term over the .... compared the list of sporulation genes to the ranked list of. COGs. We used ...
A Machine Learning Framework for Trait Based Genomics Wei Zhang∗ , Erliang Zeng∗ Dan Liu† , Stuart Jones† , and Scott Emrich∗ ∗ Department of Computer Science and Engineering University of Notre Dame, South Bend, Indiana 46556 Email: {wzhang7,ezeng,semrich}@nd.edu † Department of Biological Science University of Notre Dame, South Bend, Indiana 46556 Email: {sjones20,dliu1}@nd.edu
Abstract—Microbial communities perform many important ecological functions across a wide range of natural and man-made environments. Recently, the utility of trait based approaches for microbial communities has been identified. Increasing availability of whole genome sequences provide the opportunity to explore the genetic foundations of a variety of functional traits. In this paper, we proposed a machine learning framework to quantitatively link the genotype with functional traits. Genes from different functional trait genome groups were grouped to Cluster of Orthologs (COGs), and were used as features. Then, TF-IDF technique from text mining domain was applied to transform the data to accommodate the abundance and importance of each COG. After TF-IDF processing, COGs were ranked using feature selection methods to identify their relevance to the functional trait of interest. We focused on a binary functional trait in this paper, but plan to extend our approach to continuous functional traits in the future. Experimental results demonstrated that functional trait related genes can be detected using our method. Keywords-Ecology; Microbial communities; Functional Trait; Feature Selection; Machine Learning; Sequencing; Ortholog
I. I NTRODUCTION Microbes are the most abundant and diverse biota on Earth. They regulate global biochemical cycles, influence human health, and are responsible for the fate of contaminants in the environment. Despite their importance, we do not understand what maintains microbial diversity, how microbial communities are assembled, or how microbial species will adapt in the face of global change. Here, we present a novel bioinformatics approach to begin forging quantitative links between genetic, taxonomic and functional aspects of microbial diversity and therefore help understand implications of microbial diversity and activity for important ecosystem services. We leverage functional traits in our work [1], which are definable and measurable properties of an organism (or a group of organisms). Functional traits can strongly influence an organism’s fitness, and examples include basal metabolic rate, seed or egg size, adult body mass and potential photosynthetic rate, etc. (see [1], [2] for reviews). Microbes are ideal candidates because emerging culturing approaches expand the diversity of
cultivable micro-organisms, and short generation times and small sizes facilitate rapid functional trait characterization. We address the growing interest in understanding relationships between functional traits and how they connect to underlying ecological outcomes such as where and when a given species is most competitive. This information then can be used to help model climate change, human impact, and biochemical processes of interest (e.g., carbon fixation and bioremediation). Functional traits also deemphasize traditional nomenclature while providing a generalizable framework for predictions [1], [3], [4] including for microbial communities [5]. One significant challenge, however, is the absence of any sort of microbial trait database that collates links between community structure and functions. Any attempt to develop a microbial trait-based ecology, therefore, must begin with an initial characterization. In this paper, we propose machine learning techniques to derive associations between bacterial genome content and observed functional traits. Specifically, given a data set containing bacteria genomes with a known functional trait of interest, we aim to identify genes whose presence/absence correlate with the known functional trait. The development of quantitative links between genome content and observed traits derived from reference strains would enable prediction of functional potential of yet-to-be cultured bacteria through culture-independent genome sequencing (i.e., metagenomics). Further, we could use the identified gene(s) to characterize individuals, populations and communities, which is increasingly important given concomitant advances in high-throughput sequencing. II. P RIOR WORK Most prior studies have focused on characterizing environmental samples of interest. For example, [6] characterized and compared the metabolic capabilities of terrestrial and marine microbial communities using largely unassembled sequence data obtained by shotgun sequencing DNA isolated from various environments. [7] compared metagenomic sequences from distinct environments and showed that relative occurrence of metabolism varied among the communities and differences between metagenomes could predict the
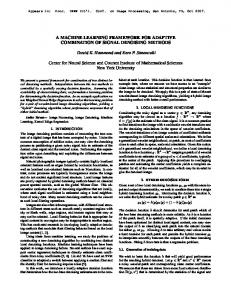
Figure 1.
Flow chart of proposed framework for trait based genomics
biogeochemical conditions of each environment. [8] concluded that functional community composition derived from metagenomes is an important quantitative readout for molecular trait-based biogeography and ecology by integrating 25 ocean metagenomes with geographical, meteorological and geophysicochemical data. Other work has focused on the 16S ribosomal RNA marker to facilitate analysis. [9] grouped 16S ribosomal RNA sequences into operational taxonomic units and systematically searched for co-occurrence across environments and for ecological associations. Knight et al. have reviewed supervised classification techniques applied on human microbiota [10]. Similarly, Liu et al. have combined instance based and model based learning methods for simultaneous class prediction and feature selection from multiple treatment populations [11]. In summary, both groups used the 16S marker to cluster metagenomic sequences from a sample into groups, and to calculate the abundance of groups as representative features. III. M ETHODS Unlike prior work, our goal is to build features from well-characterized reference genomes to help better classify environmental samples from a functional perspective. We started with a data set of soil bacteria genomes that have been classified as either sporulating or non-sporulating given our interest in this specific functional trait in an ecological context. The same method can be applied to any set of sequenced genomes, the availability of which has improved significantly with the advent of high-throughput sequencing and improved microbial culturing techniques. To begin developing quantitative links between genome content and functional traits, reference genomes with known functional trait group labels were used as training data. Supervised machine learning techniques were then used to develop predictive models from these training data, or more simply which genes (features) could distinguish one group from another. Figure 1 illustrates the flow chart of our proposed framework. The details are explained as follows. A. Determine Features Each training data point is represented with a set of input features and a qualitative dependent trait variable giving the correct class label of that data point. It is
important to identify what to use as features to train the model. Intuitively, one could use genes alone as features. Different bacterial species, however, contain up to thousands of genes, which could lead to millions in total for very large collections (e.g., bacteria characteristic of different environments). Further, genes from different species may have similar functions. To address these concerns we chose to use predicted orthologs, which are genes presumed to have evolved from a common ancestor by speciation and therefore likely retain similar functions, as our basic feature. Specifically we used OrthoMCL [12], which is a BLASTdriven method, to identify putative Clusters of Orthologous Groups (COG) based on protein sequences, and used COGs as features for training data. If the gene annotation data was not available, Glimmer [13] was used to determine putative open reading frames that were then transformed to protein sequences for inclusion in OrthoMCL. B. Data Weighting and Transformation Instead of simply assigning a binary value to a genome by virtue of its presence/absence in a COG, we counted the number of genes from a genome that belong to each COG. The data is represented using a matrix, as shown below: x11 x12 · · · x1m x21 x22 · · · x2m X= . .. .. .. .. . . . xn1
xn2
···
xnm
Where X is the count matrix with n COGs (features) and m species, and xij denotes the total number of genes assigned to COG i in species genome j. The goal of our proposed approach is identifing COGs with the most discriminative power among analyzed genomes with different functional traits. We applied the Term Frequency-Inverse Document Frequency (TF-IDF) approach [14] in text mining to weight each element in matrix X. TF-IDF is a widely used information retrieval technique to measure the amount of information of a term weighted by its occurrence probability. TFIDF works by determining the relative frequency of terms in a specific document compared to the inverse proportion of that term over the entire document corpus. Intuitively, this calculation determines how relevant a given term is in a particular document. We viewed each species genome in this paper as a document and each COG as a term. The TF-IDF measure is composed of two components. First, we calculate the term frequency (TF), which is usually defined as the word frequency divided by the total number of words in the document. In our case, TF is the number of genes in one COG divided by the total number of genes in all COGs in the genome j. TF is then computed as: xij T Fij = Pn i=1
xij
(1)
The intuition behind the second part, IDF, is to downweight the terms that appear in many documents since they tend to be less discriminative. Here, to adjust for the fact that some COGs might appear in many or all genomes in our training data, we computed IDF as: N IDFi = log Pm
j=1
� nij =
1 0
nij
if xij > 0 if xij = 0
(2)
(3)
Where N is the total number of genomes. Combining the above two measures, each element xij in initial matrix M is weighted and transformed to a continuous value as follows: T F − IDF ij = T Fij ∗ IDFi
(4)
C. Feature Selection A common challenge in biological data learning is small sample sizes combined with large numbers of features. Even if we have already reduced the dimension of available features by grouping genes with similar functions into COGs, the number of features (on the order of thousands) is still very large compared to the number of species (on the order of tens or hundreds in our preliminary work). Examples of this type of problem can be seen in the various applications of classification approaches to microarray data [15], in which the goal is to identify a small, but highly predictive subset of genes for further investigation from up to tens of thousands of candidates in the case of higher eukaryotic organisms. To address this problem there are typically two categories of feature selection solutions: filter methods and wrapper methods. Filter methods perform a univariate test or multivariate test to rank each feature based on its relevance, while wrapper methods use a classifier to evaluate subsets of features. Wrapper methods often achieve better performance but are more computationally intensive. Here, we applied three feature selection methods: Information Gain [16], mRMR [17] and support vector machines (SVM) [18]. The first two are filter methods while the last is a wrapper that uses a SVM classifier as the evaluator. D. Characterization Selected COGs are predicted to be the most discriminative among the different functional trait groups. By investigating these selected COGs, biology insights may be detected. Further, a predictive model can be built using informative COGs that will characterize traits of unknown genomes or even samples obtained directly from the environment.
IV. R ESULTS AND D ISCUSSIONS Microorganisms have different strategies to resist environment stress. Some bacteria species, such as Bacillus subtilis, produce spores in response to the starvation until nutrients become available. Besides, dormancy is a common and important functional trait in soil bacterial communities. Upwards of 90% of bacterial cells and 50% of bacterial populations can be dormant in a sample of soil [19]. The formation of an environmentally resistant spore is one, and perhaps the most famous, means of a bacteria being dormant. As most of the endosporeforming bacteria are soil organisms [20], we acquired the sequences of 97 soil bacteria genomes from NCBI ftp (ftp://ftp.ncbi.nih.gov/genbank/genomes/Bacteria/). Based upon literature information, each of the 97 strains was classified as capable of spore formation or not. There were almost half a million genes in total from the data set (n=431,168). We ran OrthoMCL to cluster genes with similar functions (see Methods) into 43,975 COGs. In this scenario, each genome is represented as a data vector of size 43,975 with each element being the count of genes from that genome belonging to a corresponding COG. So the whole data can be formalized as a data matrix. Then, we applied TF-IDF technique to weight each element in the matrix and used feature selection to rank the COGs. We expect the top ranked COGs are more correlated to the sporulation functional trait of study. To evaluate the performance, 60% of the initial data set were chosen randomly to train the model and rank the COGs; the remaining 40% were acted as testing data to calculate the classification accuracy using the selected top ranked COGs. This process was repeated 100 times and the classification accuracies are therefore average of 100 trials. The larger the accuracy, the better the prediction power of the selected COGs. To determine suitable cutoffs, the top ranked n COGs were used to build the model and test the prediction performance in this study. Two well studied classification methods, SVM and Naive Bayes, were used to classify the test data using selected COGs. To see how the feature selection could influence classification, we first used all the COGs, i.e., without feature selection, to build a model and classify test data using the same 100 iterations described previously. The average accuracy was 82.86% using the SVM classifier and 84.35% using the Naive Bayes classifier, respectively. We then selected a small subset of ranked COGs obtained from feature selection methods to train the model and evaluated their prediction performance on the test data. The size of these subsets ranged from 5 to 200. Figure 2 and 3 show the plots of the average classification accuracy of two classifiers (SVM and Naive Bayes) versus different number of COGs selected using three feature selection methods, and versus all COGs without any feature
100 95
100 95
85
90
mRMR InfoGain SVM_FS
80
● ● ● ● ● ● ● ● ● ● ● ● ● ● ● ● ● ● ● ● ● ● ● ● ● ● ● ● ● ● ● ● ● ● ● ● ● ● ● ● ● ● ● ● ● ● ● ● ● ● ● ● ● ● ● ● ● ● ● ● ● ● ● ● ● ● ● ● ● ● ● ● ● ● ● ● ● ● ● ● ● ● ● ● ● ● ● ● ● ● ● ● ● ● ● ● ● ● ● ● ● ● ● ● ● ● ● ● ● ● ● ● ● ● ● ● ● ● ● ● ● ● ● ● ● ● ● ● ● ● ● ● ● ● ● ● ● ● ● ● ● ● ● ● ● ● ● ● ● ● ● ● ● ●● ● ● ● ● ● ● ● ● ● ● ● ● ● ● ● ● ● ● ● ● ● ● ●●●● ● ● ● ● ●● ● ●● ● ● ● ●● ●
70
70
75
80
85
● ● ● ● ● ● ● ● ● ● ● ● ● ● ● ● ● ● ● ● ● ● ● ● ● ● ● ● ● ● ● ● ● ● ● ● ● ● ● ● ● ● ● ● ● ● ● ● ● ● ● ● ● ● ● ● ● ● ● ● ● ● ● ● ● ● ● ● ● ● ● ● ● ● ● ● ● ● ● ● ● ● ● ● ● ● ● ● ● ● ● ● ● ● ● ● ● ● ● ● ● ● ● ● ● ● ● ● ● ● ● ● ● ● ● ● ● ● ● ● ● ● ● ● ● ● ● ● ● ● ● ● ● ● ● ● ● ● ● ● ● ● ● ● ● ● ● ● ● ● ● ● ● ● ● ● ●● ● ● ● ● ● ● ● ● ● ●●● ● ● ● ● ● ● ● ● ● ● ● ● ● ● ● ● ● ● ● ● ● ● ● ●● ●
●
Average Classification Accuracy(%)
90
mRMR InfoGain SVM_FS
75
Average Classification Accuracy(%)
●
0
50
100
150
200
0
Number of Selected COGs (Features)
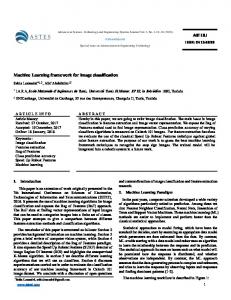
Figure 2. Average classification accuracy using a SVM with different numbers of COGs. The blue, red and green plots are results using variant COGs selected by method mRMR, InfoGain and SVM wrapper feature selection, respectively. The dashed line is the average accuracy without feature selection using SVM classifier.
selection (dashed lines). As expected, using a small subset of top-ranked features usually achieves better prediction power. This was more apparent for SVM classifier because it tended to perform poorly when a lot of noisy features were included. Figure 2 shows that small sets of features obtained using feature selection methods outperform those without feature selection. In both figures, accuracy increases gradually as more features are used when the number of features are among certain range. SVM wrapper feature selection performs the best among the three methods and InfoGain is the worst in this analysis. Considering the computing intensity of a wrapper method is substantial when the number of features is large, we believe mRMR can be a good initial choice given its decent performance and much lower computing time. A reduced set (provided by the ranking process using feature selection) would enable more rapid or targeted biological characterization of the identified features or COGs. As wet lab characterization of gene function is one of the most time consuming tasks, it is important to identify the most likely gene markers. In each iteration of the 100 permuted accuracy tests, we computed the number of features that provided the best classification accuracy. Table I shows the results in different experimental settings. We observed that a small number of COGs have good discriminative power in this study. These COGs can then be used by biologists to generate hypothesis, to perform the validation, or to compare to known biological knowledge base. From the bacterial sporulation literature, we identified 135
50
100
150
200
Number of Selected COGs (Features)
Figure 3. Average classification accuracy using Naive Bayes with different numbers of COGs. The blue, red and green plots are results using variant COGs selected by method mRMR, InfoGain and SVM wrapper feature selection, respectively. The dashed line is the average accuracy without feature selection using Naive Bayes classifier. Table I AVERAGE SIZE OF FEATURES ACHIEVING BEST ACCURACY IN 100 PERMUTATIONS
Feature Selection SVM Naive Bayes
mRMR
InfoGain
SVM Wrapper
50(88.29%) 26(88.64%)
77(88.04%) 61(86.35%)
46(90.01%) 37(89.43%)
important sporulation-related genes (from here on referred to as ”sporulation genes”). This list includes genes involved in sporulation initiation, such as spo0A sigmaE, sigmaK, sigmaF, and sigmaG; some control or regulate the germination of spores, like gerAA, gerAB, gerAc, gerBA, gerBB, and gerK; others help spores resist heat and UV photochemistry, like sspA, sspB, and spoVB [21]. To assess the ability of our algorithm to identify biologically relevant features, we compared the list of sporulation genes to the ranked list of COGs. We used HMMER [22] to locate homology between COGs and sporulation genes. In each permutation of 100 trials, the subset of ranked COGs that provided the best classification accuracy was recorded. Note that COGs identified from each trial may be different. Only those COGs that occur frequently in 100 trials are informative and should be given preference. Take the mRMR feature selection combined with SVM classifier for example, there were in total 778 unique COGs detected. Many of them only occurred in one or two trials. In addition, 778 COGs in total are still too many for wet lab validation. To give the preference to most informative COGs, there are
50
Recall of COGs Recall of Sporulation Genes
Recall
30
40
●
● ● ●● ● ● ●●● ●●●
10
20
●●●●● ● ● ● ●●●● ● ●● ●●● ●●● ● ● ●● ●● ●● ●●● ●
● ●● ●●
●●●●●
● ● ●
0
●●●●● ●●●●●●●●
0
20
40
60
80
Occurrence Count Cutoff
50
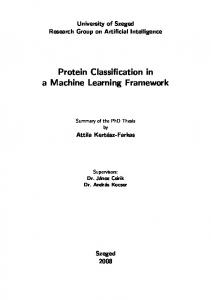
Figure 4. Change of two recalls when selecting COGs using count-based weighting method
Recall of COGs Recall of Sporulation Genes
10
20
Recall
30
40
●
●● ●● ● ●●●●● ● ●●●● ● ●● ●●●●● ● ●●●●●●●●● ●● ●●●●●●●●●●●●●● ● ● ●●●●●●●●●●●●●●●●●●●●
0
two ways to weight them: counting the number of occurrence of each COG (referred to as count-based weighting method), or computing the average rank for that COG (referred to as rank-based weighting method), among 100 trials. The two weighting methods can be used to pick up most informative COGs, thus reduce the size of candidate COGs. For example, a cutoff of x using count-based weighting method will only keep those COGs that occur more than x times among 100 trials. Similarly, a cutoff of x using rank-based weighting method will only keep those COGs that have average rank higher than x among 100 trials. We want to evaluate how the two weighting methods could influence the following two metrics: 1) the percentage of genes that are homologous to any of the 135 sporulation genes from amongst all genes included in the selected COGs (referred to as recall of COGs); 2) the percentage of 135 sporulation genes that can be mapped to genes in selected COGs (referred to as recall of sporulation genes). Figure 4 plots the changes of the two metrics when countbased weighting method was used to select COGs. The horizontal axis in Figure 4 is the cutoff used in count-based weighting method. The recall of COGs (blue curve) achieves its maximum when only including COGs with a count larger than around 30. The recall of sporulation genes (red curve), however, drops sharply at low occurrence cutoff, indicating that we may miss some biologically meaningful COGs if high occurrence cutoff is used. Similarly, Figure 5 plots the two metrics when rank-based weighting method was used to select COGs. The recall of sporulation genes (red curve) also decreases dramatically at very beginning but changes quite flat afterward, indicating large portion of sporulation genes are included in topranked COGs, which demonstrates that rank-baed weighting method is a better choice to select most informative COGs, comparing to count-based weighting method. By exploring the genetic content of the top ranked COGs, more insights to the functional trait might be discovered. We observe that both highest recall of COGs and highest recall of sporulation genes are lower than 50% in Figure 4 and Figure 5, indicating two facts in current trait based genomics study. First, there is a lack of comprehensive microbial trait database. Specifically, in this study, the 135 sporulation genes we curated from literature are not the complete set. Second, our proposed method could detect new genes that are correlated to functional trait. Nevertheless, the results present here encourage the interdisciplinary collaboration to overcome the hurdles. For example, new functional trait related genes such as sporulation related genes can be detected by computational method as described in this paper and then need to be validated in wet lab. Once confirmed by wet-lab experiments, the new trait genes can then be deployed to trait database. Multiple rounds of collaborations could result in more comprehensive database and further facilitate the discovery of new trait genes.
0
20
40
60
80
Rank Cutoff
Figure 5. Change of two recalls when selecting COGs with rank-based weighting method
V. C ONCLUSION AND F UTURE W ORK The use of whole genome sequence data allows us to connect the functional trait with genomic context, which makes our research significantly differ from those that focused on 16S rRNA analysis. Nevertheless, many challenges remain in trait based genomics analysis. In this study, we have investigated the idea of applying machine learning methods to determine the genes that are correlated to a binary functional trait from a pool of classified bacterial genomes. Instead of
using all the genes from the genomes, we grouped genes with similar functions into ortholog clusters (COGs). Our another contributions is to apply the text mining technique to transform the genome-COG matrix data. We tested the framework on one dataset and the results demonstrated that selected subset of COGs have more predictive power than using all the COGs and some sporulation related genes were detected. In this preliminary work, we focused on a discrete functional trait. In the future, we will extend our work to continuous functional traits. Further, we plan to devise new feature selection methods and test the framework with more data sets. In the meantime, our biologist collaborators will help to validate part of discovery. ACKNOWLEDGMENT This work has been supported by a National Research Initiative Grants (2011-67019-30225) from the USDA National Institute of Food and Agriculture (to SJ, SE collaborator) and in part by strategic University of Notre Dame investments in Global Health and Environmental Change research (to SE). R EFERENCES [1] B. McGill, B. Enquist, E. Weiher, and M. Westoby, “Rebuilding community ecology from functional traits,” Trends Ecol Evol., vol. 21, no. 4, pp. 178–185, Apr 2006. [2] T. J. Webb, E. V. Berghe, and R. O’Dor, “Biodiversity’s big wet secret: The global distribution of marine biological records reveals chronic under exploration of the deep pelagic ocean,” PLoS ONE, vol. 5, no. 8, Aug 2010. [3] N. L. Poff, J. D. Olden, N. K. M. Vieira, D. S. Finn, M. P. Simmons, and B. C. Kondratieff, “Functional trait niches of north american lotic insects: traits-based ecological applications in light of phylogenetic relationships,” Journal of the North American Benthological Society, vol. 25, no. 4, pp. 730–755, 2006. [4] E. Litchman and C. Klausmeier, “Trait-based community ecology of phytoplankton,” Annual Review of Ecology, Evolution, and Systematics, vol. 39, pp. 615–639, 2008. [5] J. L. Green, B. J. M. Bohannan, and R. J. Whitaker, “Microbial biogeography: From taxonomy to traits,” Science, vol. 320, no. 5879, pp. 1039–1043, 2008. [6] S. G. Tringe, C. von Mering, A. Kobayashi, A. A. Salamov, K. Chen, H. W. Chang, M. Podar, J. M. Short, E. J. Mathur, J. C. Detter, P. Bork, P. Hugenholtz, and E. M. Rubin, “Comparative metagenomics of microbial communities,” Science, vol. 308, no. 5721, pp. 554–557, Apr. 2005. [7] E. A. Dinsdale, R. A. Edwards, D. Hall, F. Angly, M. Breitbart, J. M. Brulc, M. Furlan, C. Desnues, M. Haynes, L. Li, L. McDaniel, M. A. Moran, K. E. Nelson, C. Nilsson, R. Olson, J. Paul, B. R. Brito, Y. Ruan, B. K. Swan, R. Stevens, D. L. Valentine, R. V. Thurber, L. Wegley, B. A. White, and F. Rohwer, “Functional metagenomic profiling of nine biomes,” Nature, vol. 452, pp. 629–632, Oct. 2008.
[8] J. Raes, I. Letunic, T. Yamada1, L. J. Jensen, and P. Bork, “Toward molecular trait-based ecology through integration of biogeochemical, geographical and metagenomic data,” Molecular Systems Biology, vol. 7, 2011. [9] S. Chaffron, H. Rehrauer, J. Pernthaler, and C. von Mering, “A global network of coexisting microbes from environmental and whole-genome sequence data,” Genome Research, vol. 20, pp. 947–959, 2010. [10] D. Knights, E. K. Costello, and R. Knight, “Supervised classification of human microbiota,” Microbiology Reviews, vol. 35, no. 2, pp. 343–359, Oct 2010. [11] Z. Liu, W. Hsiao, B. L. Cantarel, E. F. Drbek, and C. FraserLiggett, “Sparse distance based learning for simultaneous multiclass classification and feature selection of metagenomic data,” Bioinformatics, vol. 27, pp. 3242–3249, Oct 2011. [12] L. Li, C. J. S. Jr., and D. S. Roos, “Orthomcl: Identification of ortholog groups for eukaryotic genomes,” Genome Research, vol. 13, pp. 2178–2189, 2003. [13] A. L. Delcher, K. A. Bratke, E. C. Powers, and S. L. Salzberg, “Identifying bacterial genes and endosymbiont dna with glimmer,” Bioinformatics, vol. 23, pp. 673–679, 2007. [14] H. C. Wu, R. W. P. Luk, K. F. Wong, and K. L. Kwok, “Interpreting tf-idf term weights as making relevance decisions,” ACM Transactions on Information Systems, vol. 26(3), pp. 1–37, 2008. [15] J. Lee, M. Park, and S. Song, “An extensive comparison of recent classification tools applied to microarray data,” Computational Statistics & Data Analysis, vol. 48(4), pp. 869–885, 2005. [16] T. Elomaa and J. Rousu, “General and efficient multisplitting of numerical attributes,” Machine Learning, vol. 36(3), pp. 1–49, 1999. [17] C. Ding and H. Peng, “Minimum redundancy feature selection from microarray gene expression data,” Journal of Bioinformatics and Computational Biology, vol. 3, no. 2, pp. 185–205, 2005. [18] J. W. Guyon, S. Barnhill, and V. Vapnik, “Gene selection for cancer classification using support vector machines. machine learning,” Machine Learning, vol. 46, pp. 389–422, 2002. [19] J. T. Lennon and S. E. Jones, “Microbial seed banks: the ecological and evolutionary implications of dormancy,” Nature Reviews Microbiology, vol. 9, pp. 119–130, 2011. [20] A. Moir and D. A. Smith, “The genetics of bacterial spore germination,” Annual Review of Microbiology, vol. 44(1), pp. 531–548, 1990. [21] P. Stragier and R. Losick, “Molecular genetics of sporulation in bacillus subtilis,” Annual Review of Genetics, vol. 30, pp. 297–341, 1996. [22] R. Finn, J. Clements, and S. Eddy, “Hmmer web server: interactive sequence similarity searching,” Nucleic Acids Research, vol. 39, pp. 29–37, 2011.