Protein Classification in a Machine Learning Framework. Summary of the PhD Thesis by. Attila Kertész-Farkas. Supervisors: Dr. János Csirik. Dr. András Kocsor.
University of Szeged Research Group on Artificial Intelligence
Protein Classification in a Machine Learning Framework
Summary of the PhD Thesis by
Attila Kert´ esz-Farkas
Supervisors: Dr. J´ anos Csirik Dr. Andr´ as Kocsor
Szeged 2008
“In theory, there is no difference between theory and practice. But, in practice, there is.” Jan L.A. van de Snepscheut
Introduction Bioinformatics is a marriage of biology, informatics and mathematics and it employs computational tools and methods for managing, analysing and manipulating sets of biological data [1; 2]. The main tasks of bioinformatics are the gathering, organization and analyzing of protein sequence databases using computational methods. When sequencing a new protein, perhaps its 3-Dimensional structure is one of the most important questions, since it provides a much greater insight into the function of the protein than its sequence version. Three mainstream themes have evolved to determine the 3-Dimensional structure of a protein: (i) The direct determination of the 3D structures of a protein molecule via chemical and biological experiments. Unfortunately, these experiments involve costly, time consuming and difficult methods. (ii) A computational approximation of the 3D structures based on the sequence of the protein. Since the problem is NP-hard, several heuristic algorithms have been developed. (iii) A newly sequenced protein is compared to well-known databases via a proximity function1 . Then their function and 3D structure can be either inferred from the most similar, well-known protein sequences, or they can be classified into a known protein group by machine learning approaches like Artificial Neural Networks or Support Vector Machines. The topic of the dissertation lies in the third area. This booklet provides a summary of the Author’s thesis points.
Protein Benchmark Database A protein molecule is a linear concatenation of amino acid molecules and thus it can be represented by a string over a certain alphabet where every letters in the alphabet correspond to different amino acids. Let us call it amino acid alphabet. The total number of the amino acids – and thus the size of the amino acid alphabet – is 20. An example for the first part of a protein sequence is the following string: “rintvrgpit iseagftlth ehicgssagf lrawpeffgs ...”2 . We should mention here that a string representation of a protein molecule is called a protein sequence, but a protein sequence is not a series of proteins. Protein sequences are distinguished from general strings in the following four specific ways: (i) the size of the alphabet is 20, (ii) their length tends to be several tens to several thousands, (iii) the protein sequence usually contains long repeated subsequences and (iv) each protein 1
A proximity function is a positive-valued bivariate function over the Descartes product of a set of object. When a proximity measure gives a higher score for more “similar” objects and a lower one for “different” objects, then it is called a similarity function while if a proximity measure gives a lower score for “less similar” objects, then it is called a distance function. 2 Note that a protein molecule can be also represented by either a nucleotide sequence that codes the given protein in the DNA or by the 3 dimensional Euclidean coordinates of the protein molecule.
1
sequence codes real protein molecules, but not every string over the amino acid alphabet codes real protein molecules. In this dissertation the sequences we analyzed relate to real proteins. Proteins can be classified based on their similarity or evolutionary relationship. For example the oxygen atom carrying proteins from different species can be classified to the same, the hemoglobin, class. These proteins can differ slightly in various species, but their 3D structure and function are roughly the same. Let us label protein classes by natural numbers 1, 2, . . . , N , where N denotes the number of the classes and let pair (s, y) stand for a protein sequence s and its class label y (1 ≤ y ≤ N ). The aim of the protein classification is to build a function F such that F (s) = y; that is, F classifies each sequence s to its own class y. Machine learning techniques are used to adjust (to learn) the parameters of the function F which minimizes the number of misclassified objects3 (|{s | F (s) 6= y}|)[3]. For the experiments in the dissertation we selected a class that is called positive class and its elements are called positive elements while the complementer class within the database is called negative class and its elements are called negative elements. We mention that the reason for this step is that most classifiers are defined on two-class classification problems [3]. To achieve the learning of the parameters of the function F the positive and negative sets of the protein sequences are divided into two distinct, non-empty classes called train and test set, respectively, thus we get positive train, positive test, negative train and negative test sets and such a division of the protein sequences in the database is called a classification task. Then the parameters of the function F are learned using the train set, while its performance is evaluated on the test set. In the studies for the performance evaluation of a classifiers we used the ROC analysis [4]. A Detailed description of about this technique is given in the dissertation. Here we note that the range of the ROC analysis is [0, 1] and a higher value means a better performance. Most of the classifier algorithms need data represented in fixed length vector form. In our studies the sequences were represented by the so-called Empirical Feature Map (EFM) method [5]; that is, a sequence s is represented by a feature vector Fs = [fx1 , fx2 , . . . , fxn ].
(1)
Here n is the total number of proteins in the training set and fxi is a proximity score between sequence x and the ith sequence in the training set obtained by an arbitrary fixed proximity measure. We chose this method because this provides a markedly better sequence representation than the others [6]. Proteins can usually be categorized hierarchically in a similarly way to the biological classification of organism (kingdom, phylum, class, order, family, genus, species). Such categorization can be represented by a H depth, rooted tree, where H represents the number of the hierarchy, the root of the tree represents the whole database and each letter stands for a protein sequence. Moreover an inner node of the tree denotes the set of the letters (protein sequences) which are derived from the given inner node. An inner node (and the corresponding set of letters) is called a category. Categories in the same layer in the tree give a partition of the dataset. A tree representation of a hierarchically categorized database can be seen in Fig. 1.A. We should add that this tree is balanced4 because in the database each element belongs to a particular category in each layer, i.e. it is not allowed, for example, a certain species do not belong to any genus or family and so on. 3 4
We should mention that other sophisticated methods are currently used. Here by a balanced tree we mean that every path from the root to letters has the same length.
2
Let us fix an arbitrary ordering of the nodes in each layer of the tree respectively and index them by natural numbers 1, . . . , Np , where Np denotes the number of the nodes in the pth layer (1 ≤ p ≤ H). We note that N0 is the number of the elements in the database, NH = 1 because the layer H consist of the root, while NH ≤ NH−1 ≤ · · · ≤ N1 ≤ N0 . Let the pair (s, y) denote a protein sequence s and its class label vector y such that s is a certain letter of the tree and the vector y ∈ N H+1 codes the path from the root node to the letter s in the tree such that the ith component yi (≤ Ni ) of the y denotes the ith index of the node on the path in the ith layer in the tree. Let us fix an arbitrary layer i in the tree and let us mark a category j within the layer i. Then let the set P = {(s, y) | yi = j} be the positive class while let the set N = {(s, y) | yi 6= j} be the negative class. Then one can make classification task using these positive and negative sets in the common manner (cross-validation, One-Leave-Out) [3]. Note that the elements in the databases are not classified into positive and negative classes, we generated different classification tasks varying the chosen category j(< Ni ) within the layer i and a database element may belong to the positive class in one classification task and may belong to the negative class in another classification task. Most genomes contain novel variants of the known proteins i.e., in a known protein family a newly sequenced genome is expected to be different from rather than similar to that of its known variants. So the property relevant to biologists is how well a classifier will generalize to a novel subtype of the already known groups. When constructing the classification task the elements of the positive
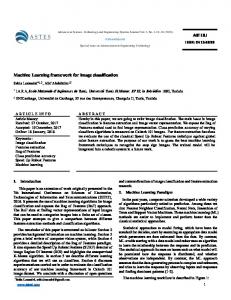
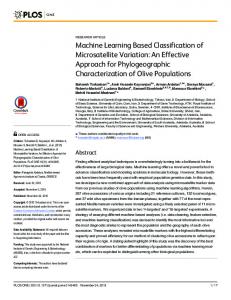
Figure 1: The application of a supervised cross-validation scheme to an 5-depth classification hierarchy. (A) The positive class is denoted by A (j = 1) at the level L(2) (i = 2). Within this category at the level L(1) a subcategory (k = 1) was chosen as a positive test set and the remainder were chosen as a train set, thus the train and the test sets consist of disjoint subcategories. During the classification the classifier has to recognize a new subcategory within a known category. (B) For the negative class categories selected based on their distance from the category A. The negative sets (a), (b) and (c) are contains further and further categories, where the distance is defined on the tree with the steps of the shortest path between categories. 3
class (a certain category) are rated to train and test sets randomly, then the train and test sets probably consist of the same categories. As a consequence, the results of the classification evaluation do not provide information on how correctly the classifier classifies elements from a distantly related new subcategory within the known positive category. The Author’s result is a general framework for construction classification tasks within hierarchically defined databases in the following way. Let the positive class P = {(s, y) | yi = j} be the elements of jth category within the ith layer and let N = {(s, y) | yi 6= j} be the negative class both defined as before. Then let the positive test set be the elements of kth subcategory within the category j; that is, the node k is a child of the node j while let the positive train set be the elements of remaining subcategories within the category j. The negative class usually consists of several categories and let each of them be rated by a fair coin tossing for the train or test set. This method is termed supervised cross-validation since the hierarchical categorization of the database elements as an information is exploited to construct the classification tasks [7]. As a result it gives lower, and our opinion more reliable estimation on how a classification technique will generalize to novel, distantly related subtypes within a known protein classes. The other well-known techniques (random cross-validation, One-Leave-Out [3]) may grossly overestimate the predictive power of a classifier on new genomes. The Author examined how the classification results depend on the filtering of the categories from the negative set. It is an important step because in a typical binary classification task the positive sets consist of several tens of to several hundred of sequence objects while the negative set is simply defined as “the rest of the database” that gives large and imbalanced classification tasks and it slows down the preprocessing and learning methods [8]. Using the hierarchical classification of the database let us define the negative set Nk = {(s, y) | yi 6= j, yk = φ(i, j, k)}, where k > i and the function φ(i, j, k) returns the index of the category on the layer k which contains the category j on the layer i. Thus the parameter k controls from the positive class how distant elements belong to the negative class, where the distance between the database elements is defined by the length of the shortest path between them in the tree. We should add that in the case of k = H the negative class is the complementer class of the positive class within the whole database, and in the case k = i the negative class would be the empty set. We also mention that the larger the k is, the bigger the negative set we get. The filtering method described above is termed categorical filtering and it is shown in Fig 1.B. The Author compared the categorical filtering with two other filtering strategies, namely: (i) a random subsampling of the negative set (10%, 20% of the whole negative set) (ii) a selection of the nearest neighbours of the positive group based on a proximity score [8]. Based on our experiments we propose the method (i) for negative class filtering since the classification performances remain close to those of the original dataset, and the number of structural categories is higher than in the case of (ii) and the categorical filtering. Method (ii) sharply reduces the number of structural categories presented in the negative set and as a result, the negative sets will be too specific i.e. they may be less representative with respect to the entire database. Although this result may be considered as a negative result, in our opinion we should mention it because it makes the characterization of the hierarchically organized protein datasets more complete from classification point of view. Hence when constructing the positive train set, we suggest using the supervised cross-validation but to filter the negative set we suggest using the random subsampling method [7]. We created a protein classification database, called Protein Benchmark Database, on which the machine learning techniques and the protein sequence proximity measures could be compared [9]. The 4
Table 1: Protein classification results. 1NN RF SVM ANN LogReg BLAST 0.7577 0.6965 0.9047 0.7988 0.8715 SW 0.8154 0.8230 0.9419 0.8875 0.9063 NW 0.8252 0.8030 0.9376 0.8834 0.9175 LAK 0.7343 0.8344 0.9396 0.9022 0.8766 PRIDE 0.8644 0.8105 0.9361 0.9073 0.9029 DALI 0.9892 0.9941 0.9946 0.9897 0.9636 The protein sequences and classification tasks we used were the “SCOP40” entry taken from the Benchmark database. The classification performance was evaluated via the ROC analysis. For the classifier algorithms, the values of the parameters we used can be found in the dissertation. In these classification tasks the protein sequences were classified based on their 3D structure. databases consist of 40000 protein sequences that were selected from several public protein databases 3PGK [10], CATH [11], COG [12], SCOP [13]) and we generated around 9500 classification tasks using the supervised cross-validation techniques. The Benchmark collection also contains the best results using several popular classification methods with protein sequence proximity measures, whose results can be used as a baseline for further comparison. Moreover, the database contains a short description of the methods used along with the parameter settings applied. For the classification part we applied the following classifiers: Artificial Neural Networks (ANNs) [14], Support Vector Machines (SVMs) [15], Random Forest (RF) [16] One Nearest Neighbour (1NN) [3] and Logistic Regression (LogReg) [17]. The sequences were represented by the EFM (1) method where the underlying proximity measure that we used were the following proximity methods: the BLAST [18], the Smith-Waterman (SW) [19], the Needleman-Wunsch (NW) [20], the Local Alignment Kernel (LAK) [21], the PRIDE [22] and the DALI [23], respectively. Table 1 shows the test results on a small part of the Benchmark database. Each rows of the table corresponds to a classifier while each column corresponds to a proximity measure used in the EFM during the sequence representation. The performance of the classification were measured by ROC analysis [4]. The Benchmark database is freely available at: http://hydra.icgeb.trieste.it/benchmark.
Likelihood-ratio approximation for protein classification A newly determined sequence can be classified to a well-known protein class using sequence proximity methods like SW [19], and functional and structural annotation of the new sequence can be derived from the properties of the closest known protein class. Since proximity algorithms play a key role here, more accurate proximity algorithms have been developed like those of BLAST[18], PSI-BLAST [24] and FASTA[25]. Let S denote the set of the protein sequences, let T ⊂ S be the well know protein sequences within S, P denote a category5 of protein sequences and let s : S × S → R+ be a similarity function. Let us define how close a sequence x ∈ S is to the class P by the maximum similarity score between 5
We should mention that the category of protein sequences denotes a set of proteins that have a common function and 3D structure.
5
the sequence x and the members of P , similarly to the nearest neighbour technique [3]. Formally: P OS(x, P ) = max{s(x, z)}.
(2)
z∈P
Then the sequence x can be place to the class P when this score hits a predefined threshold, otherwise it is denied. Note that in the practice this threshold is usually chosen using either priori information about the class P or some heuristic algorithm. Let us consider the following scoring function: ¾ ½ P OS(x, P ) , LRA(x, P, N ) = P OS(x, N ) where the set N is the complementer set of the set P within the set T . This method was developed for computer vision applications [26] but using a comprehensive evaluation of the method on our Benchmark dataset we were the first to show this technique can be successfully applied in the context of the classification of protein sequences and it significantly improves the results against the P OS method as well as we showed that this technique is equivalent to the Likelihood ratio technique [3] and both give the same results [27]. Our experimental results can be found in table 2. Table 2: Comparison of the LRA and POS methods using BLAST and SW similarity methods and evaluated via ROC analysis. SW BLAST
POS LRA POS LRA
SCOP 0.850 0.932 0.825 0.892
3PGK 0.791 0.944 0.792 0.941
COG n.a n.a. 0.987 0.999
A SCOP, 3PGK and COG stand for datasets of protein sequences. The SCOP dataset was taken from [28], while the 3PGK and COG datasets were taken from our Benchmark database. The parameter values we used can be found in the dissertation.
Note that instead of P OS(, ., ) any other method can be used which gives an estimate of how close a sequence is to a certain protein class. Unfortunately, in practice some methods cannot be used on every protein classes, for instance a profile-HMM [29] can be applied instead of P OS(., P ) but in practice a profile-HMM may not be calibrated for negative classes since it is usually a mixture of more than one protein category.
Compression-based Distance Measures (CBD) for protein sequence classification The Information Distance is a universal metric for strings and defined by the following formula: E(x, y) =
max{K(x | y), K(y | x)} . max{K(x | λ), K(y | λ)}
(3)
Here λ denotes the empty string and K(a | b) denotes the conditional Kolmogorov complexitiy of a with respect to string b; that is, the length of the shortest binary program that outputs a with the 6
parameter b. Due to the fact that it is non-computable in the Turing sense, it has been approximated by text file compressors with the following formula [30]: CBD(x, y) =
C(xy) − min{C(x), C(y)} , max{C(x), C(y)}
(4)
where C(z) denotes the length of the compressed string z compressed by a particular compressor like gzip, arj and xy denotes the concatenation of strings x and y. The interest in compression-based methods was fostered by Ming Li et al.’s paper [31]. Then various practical applications and study appeared: language classification [32; 33], hierarchical clustering [34; 35], music classification [36], protein sequence and structure classification [37–39], SVM kernel for string classification [40] and clustering fetal heart rate tracings [41]. The Author examined the behaviour of CBDs on protein classification from several aspects and the results can be summarized in three point. (1) The Author experimentally investigated the CBD measures in the EFM (1) in order to see how well they perform in the protein classification. In the experiments for the compressor we chose a Huffman-based compressor [42], an LZW (Lempel-Ziv-Welch) compressor [43], a PPM (Prediction by Partial Matching) compressor [44], and the GenCompress method [45] (which was designed directly for genome sequence compression), respectively. The classification results have been evaluated with ROC analysis and test results are shown in Table 3, which showed us the CBDs perform less well than substructure-based comparisons like the outstanding Smith-Waterman algorithm in protein similarity. This is in fact expected, since Smith-Waterman calculations include a substantial amount of biological knowledge encoded in the amino acid substitution matrix while CBDs do not use any apriori information. [37; 46]. (2) Here, let us measure the efficiency of a sequence proximity with the ROC analysis by regarding a proximity value between two sequence as a score by a binary classifier for putting them into the same class. The Author examined the efficiency of the CBDs as a function of the size of the alphabet. The alphabet extension was obtained by representing each bi-gram and tri-gram with a new character [47] yielding an alphabet with number of elements n2 and n3 , respectively, where n is the number of a particular alphabet. The alphabet reduction was carried out by grouping the amino acids based on their chemical properties [48]. We should add that a compressor applied to reduced alphabet sequences can be viewed as a lossy compressor. The Author designed and evaluated the experiments that did not display, for amino acids or nucleotide sequences, any general noticeable relationship between the performance and the size of the alphabet [46]. Table 3: Protein classification results using CBD measures. Methods AH GC LZW PPM SW2
1
1NN
SVM
RF
LogReg
ANN
avg
.711 .644 .751 .798 .815
.877 .775 .856 .851 .942
.824 .691 .821 .800 .823
.751 .753 .718 .813 .906
.800 .769 .794 .583 .888
.793 .726 .788 .823 .875
The protein sequences and classification tasks were the ’SCOP40’ entry from our Benchmark protein database. The classification results were evaluated via a ROC analysis. The parameter settings that we used can be found in the dissertation. 1 The compressor method in the CDB. 2 The classification results obtained using SW are presented for comparison.
7
(3) We were interested in finding out if an application specific method like BLAST could improve the performance of the applied independent compression-based measures. Although numerous combination schemes are available in the literature [49], here the process of combining of proximity measures was carried out using the multiplication rule: µ ¶ BLAST (x, y) F (x, y) = 1 − · CBD(x, y), (5) BLAST (x, x) where BLAST (x, y) is a BLAST score computed between a query x and a subject y and BLAST (x, x) is the BLAST score of the query compared with itself. The term in parentheses is used to transform the BLAST score into a normalized distance measure whose value lies between zero and one. Eq.(5) is a straightforward method for combining CBDs with more specialized methods. We chose the BLAST algorithm since it is the most popular method in the literature and in the practice for protein sequence comparison while for the compressor in the CBD we used the compressors PPM and LZW, respectively. The performance of this combined measure (LZW-BLAST, PPMZ-BLAST) was in fact close to and, in some cases, even slightly superior to that of the SW algorithm and two HMM-based model, namely the Fisher kernel[50], SAM[51]. We consider this result encouraging since Eq. (5) does not contain any tuned parameter [37]. Table 4: Preliminary results on protein sequence classification using compression-based and combined proximity measuresa . SW BLAST LZW PPMZ LZW + BLAST PPMZ + BLAST SVM-Fishera SAMb 0.901 0.884 0.869 0.787 0.907 0.884 0.686 0.657 The SVM method was used for the classification while an ROC analysis was used to evaluate its performance. a The sequence database was taken from [28]. b SVM-Fisher method [50], c SAM profile-HMM-based classifier[51].
Equivalence Learning for protein classification Sequence groups are vastly different in terms of most their parameters like group size, degree of within-group similarity and separation from other groups. A method that performs well on one group may perform worse on another and vice versa. The learning of a similarity in a supervised manner may provide a general framework for adapting a similarity function to a specific sequence class. For the Distance Metric Learning (DML) the first supervised method was published in [52], which method involves diagonalization and eigen decomposition methods. The seminal papers [53–57] propose more sophisticated methods for DML. A review of this topic can be found in the dissertation. In the field of bioinformatics the publication [58; 59] provides methods for predicting interactions between genes. To optimize the substitution matrix of sequence alignment methods for specific sequence groups the publications [60; 61] give an iterative and a convex optimization methods, respectively. But to the best of the Author’s knowledge his own papers [62; 63] are the first for learning of similarity over protein sequences. The Author’s method uses a binary classifier and pairs of equivalent sequences (belonging to the same class) as positive samples and non-equivalent sequences (belonging to different classes) as negative training samples. The evaluated comprehensive experiments tell us this method provides better results in protein sequence classification. Moreover the Author proved that with some conditions 8
equivalence
non-equivalence
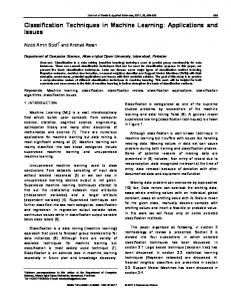
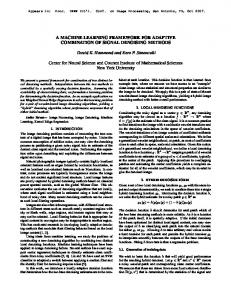
Figure 2: Principle of equivalence learning. Equivalence learning is a two-class classification problem defined on object pairs. In the figure the objects are represented by their class symbol 4, ◦ and � and object pairs are grouped based on the member of a pair belongs to the same class (equivalent) or not (non-equivalent). Table 5: Summary of the vector composition methods we applied. Name Formula Sum C+ (u, v) = u+v Product C• (u, v) = u·v 2 Quadratic CQ (u, v) = (u √− v)√ 2 Hellinger CH (u, v) = ( u − v) Dombi CD (u, v) = u · v + (1 − u) · (1 − v) Here for ease of notation, the operators√were defined on vectors in a coordinate-wise manner, i.e. for √ any vector u, v ∈ Rn , (u · v)i = ui vi , ( v)i = vi and (v n )i = (vi )n . the resultant learned similarity function gives a metric or kernel function6 . The metrics and kernel functions can be viewed as a certain distance and similarity functions which have certain additional mathematical properties that can be exploited in algorithms providing further possibilities. Now we will present our method. Since in protein classification the aim is to classify a protein s into its unique class using an automatic algorithm F ; that is, F (s) = y, where y stands for the class label, then it naturally defines the following equivalence relation over the objects: ( 1 F (s) = F (t) i.e. s and t belong to the same class, δ(s, t) = 0 otherwise, which is reflexive, symmetric and transitive. We called the learning of this relation equivalence learning (EL) and its principle is shown in Fig. 2. Since most of the machine learning techniques act on numerical vectors, here a key issue is to decide how we should represent a protein sequence pair with a numerical vector. Let PCφ : S × S → Rn be a function that maps sequence pairs to the n-dimensional vector space in the following way: PCφ (s, t) = C(φ(s), φ(t)), where S denotes the set of sequences, the function φ : S → Rn maps any sequence to an n-dimensional real vector, C : Rn × Rn → Rn is a bivariate operator called projection operator. Table 5 summarizes the methods which were used in our experiments. Then the equivalence learning task can be reduced to the learning of the two-class classification problem 6 The kernel function is a symmetric, positive semi-definite function which can be regarded as a generalization of the inner (scalar) product.
9
EL(s, t) = F (PφC (s, t)) = y, where y = {1, 0} denotes whether s and t belong to the same class or not, formally: y = δ(s, t). In the following we will treat EL as a similarity function and the learning of EL is viewed as learning of a similarity function. The parameters of the method EL are a vectorization method φ, a composition method C and a binary classifier F along with their parameters. Let us consider f (z) = hw, zi+b as a decision hyperplane between two classes in the n-dimensional real-valued vector space, where z is an n-dimensional vector, w is the normal vector of the decision P plane, b is a constant and hx, yi = i xi yi is the scalar product over the n-dimensional vector space. The SVM approach provides a decision boundary f between two classes which maximizes the distance between the plane and the nearest object between the two classes [64]. Here, without loss of the generality let us assume that the two class are linearly separable in the vector space. The decision plane can be written in the following form X f (z) = αi hz, xi i + b, (6) i
where xi is the so-called support vectors and αi is the corresponding so-called Lagrangian multiplier. The Author showed that replacing the equation (6) with one of the following function X (7) SV KP φ (s, t) = αi exp(σhPCφ• (s, t), xi i), C• i X (8) SV KP φ (s, t) = αi exp(σhPCφ+ (s, t), xi i), C+ i X (9) αi exp(σhPCφD (s, t), xi i), SV KP φ (s, t) = CD i X (10) αi exp(−σhPCφQ (s, t), xi i), SV KP φ (s, t) = CQ i X (11) αi exp(−σhPCφH (s, t), xi i), SV KP φ (s, t) = CH
i
where σ is a real valued positive parameter, and the learning with One-Class SVM and non-negative Least Squares technique gives kernel functions. The SVK functions can be considered as an learned kernel functions over the protein sequences. The results in the Table 6 tells that better protein classification results can be obtained using our EL technique. The classification task have been taken from our Benchmark database and the parameters we used can be found in the dissertation. Further investigation was made to study the behavior of the EL from different aspects and the results can be found in the dissertation. Table 6: Protein classification resultsa with EL method and several classification technique and sequence comparison methods. Methodsb 1NN SVM RF ANN LogReg avg BLAST 0.863 0.953 0.852 0.958 0.953 0.921 SW 0.861 0.953 0.866 0.955 0.948 0.916 0.922 LAK 0.860 0.955 0.876 0.956 0.959 c EL 0.964 0.966 0.948 0.963 0.927 0.953 In each column the largest value is underlined. a For the evaluation of the classification an ROC analysis was performed. b Columns show classification results as a function of sequence comparison method with various classification method while rows shows it as a function of classification methods with various comparison methods. c For the EL method the classifier FR, for the composition the CD and for the sequence vectorization φ the EFM (1) were used. 10
Kalman filter for DNA chips The content of the last chapter of the dissertation differs from the previous chapters. It describes DNA chips (a.k.a. a microarray) that contain gene expression data obtained from healthy and/or diseased tissues [65]. These data items are arranged in a matrix form whose columns represent tissues and its rows represent genes and a matrix cell shows how many proteins were expressed form a gene in a certain tissue. Here the task is to identify the smallest set of genes (rows) that best separates the class of tissues (columns); that is, we need to identify those genes that determine the absence or presence of a particular disease. Such set of genes called biomarker and can help to apply more accurate treatment and diagnoses for a patient. Gene expression measurements capture a large amount of expression variance. A large number of error sources also corrupt the gene expression data, even though normalization procedures are meant to reduce such influences [66]. Here we describe the Kalman Filter (KF) method as a noisereduction step for DNA chip data as well as we present a new automatic parameter tuning technique which significantly improves the performance of the KF approach on various type of DNA microarray (affymetrix, cDNA, oligonucleotid). With the resulted filtered dataset better classification result can be obtained even with smaller biomarker. The advantage of the KF against the PCA filter [67] – in addition it helps to get better classification results – it keeps the data in the original space, hence the biological interpretation of the features (genes) remains while this is not true for PCA. The setting of the parameters has a key role in the successful application of the KF. The Author has been participated in the developing of an automatic parameter setting method for the KF. Here we will present it. Due to the lack of the space here, we will omit the presentation of the KF but it can be found in the dissertation and in the publication [68]. Let us denote the two parameters of the KF with Q and R as it is denoted in the dissertation as well. Both of them are a matrix, the parameter Q and R can be interpreted as an modeling error and measurement noise, respectively. Our proposed parameter setting is the following. Let us define Q = Q + qI and R = R + rI, where Q is the between class covariance matrix while R is the within class covariance matrix of the data. The Table 7: Classification results on the original and on the Kalman Filtered datasets using several classification methods. Database SVM ANN 1NN RF a Original PCA KF Original KF Original KF Original KF ALL-AML 0.99 0.99 0.99 0.97 0.99 0.73 1.00 0.92 0.95 Breast Cancer 0.88 0.81 0.70 0.67 0.74 0.23 0.68 0.64 0.68 Lung Cancer 1.00 0.99 0.99 1.00 0.99 0.59 0.99 0.99 0.99 MLL 1.00 1.00 1.00 1.00 1.00 0.87 1.00 0.92 0.98 Leukeamia 0.97 0.96 0.98 0.90 0.98 0.60 0.88 0.94 0.96 SRBCT 0.99 0.99 1.00 0.99 1.00 0.66 1.00 0.99 1.00 Tumours 0.95 0.91 0.94 0.90 0.94 0.72 0.92 0.84 0.87 For the evaluation of the classification performance an ROC analysis was carried out. Each row corresponds to a dataset, while each column corresponds to a classification method. We should mention that it seems the classifier SVM provides lower result on the Kalman filtered data than with the original data, but further analyses on gene selection presented in the dissertation tell us better biomarkers can be obtained with SVM on the Kalman filtered data than with the original data. a PCA noise filter also was evaluated with SVM classification. 11
two additive term is a regularization parameter to avoid the over-fitting. Our tests led us to conclude that in the case of single channel raw intensity array data (i.e. Affymetrix) q = Q11 and r = R11 are good choices for a reasonably good performance while in the case of expression log-ratio data (usually coming from dual channel cDNA chips) or very sparse expression matrices, these parameters yield acceptable results when we choose r = tr(R) and q = tr(Q). Here A11 refers to the first element of the first row in the matrix A, tr(A) denotes the trace of the matrix A while I stands for the identity matrix. We applied Kalman filtering on seven publicly available cancer expression datasets, and tested the most popular classification methods on the original and on the Kalman filtered datasets. Test results are shown in Table 7, which show that the KF approach generally improves the classification performance. The databases and algorithm along with their parameter settings that we applied can be found in the dissertation. We have also shown that the number of Kalman filtered features necessary for a good discrimination of tumor types is smaller than the size of the raw feature set required for a similar performance. Moreover, we used three state-of-the-art graphical representation schemes are also employed in the study, to inspect whether the tumor subclasses are also visually detectable.
Conclusions The chief topic of this thesis is the application of machine learning techniques to protein and disease state classification. As a brief summary of our conclusions we could say: if more useful biological knowledge can be included in the model, better results can be obtained. Now we will summarize our findings on this point of view. The first part of the thesis describes our results for protein classification using machine learning techniques. In general, it seems that the classification results do not critically depend on the classifier method but strongly depend on how a sequence is represented. Here biological knowledge is included in the proximity measure that is applied in the so-called Empirical Feature Mapping technique for sequence representation. Most of the biological knowledge here is exploited by a 3D comparison (like DALI and PRIDE) and by the alignment-based methods (like BLAST, SW, NW). The CBDs do not incorporate any detailed biological knowledge; they are simply based on substring repetitions and distributions, but these substrings are not weighted by their importance. The early n-gram technique (double, triplet character composition) also offers a weak representation since the amino acid composition is not useful for determining the function or the structure of a protein. Then, as expected, the general performance of CBDs with the n-gram technique is not as good as the exhaustive 3D comparison or alignment-based methods in protein sequence classification and separation. The situation is similar with the LRA technique. Here the protein classification based on proximity measures is not only based on the similarity value between the test sample and the closest member in the positive class, but it also takes into account the similarity score of the nearest member in the negative class. Hence the LRA approach exploits additional information which improves the sequence ranking. Equivalence Learning provides a two-class classification approach which is realized by a binary classifier and takes advantage of relationships among equivalent and non-equivalent object-pairs. This gives better protein classification results than when a sequence is represented “alone”. The KF procedure also exploits additional information for the noise reduction as their parameters can be 12
adjusted in a supervised way. Unfortunately, the supervised methods are sensitive to the distribution of the train and test set and they can easily overlearn, which reduces the generalization ability of a classifier. We recommend using the supervised cross-validation approach, which can provide a more realistic estimation on how the algorithm will detect a novel subtype of a known protein class. The results presented in this dissertation surely suggest some further questions on this topic. It may be interesting to know whether the KF method can be used to remove the noise from sequence proximity methods in protein classification. Can we include some biological knowledge in the CBDs? Can we do this in such a way that they still preserve the metric property? We showed that a simple combination of two low-time complexity proximity measures can distinguish protein classes just as well as the exhaustive computationally intensive SW. Can we achieve a performance of the 3D structural comparison method like DALI either by the learning of a hybrid combination of comparison methods in a supervised fashion or by setting the mixed similarity to the ideal kernel matrix? As we have seen, additional knowledge included in the models can indeed provide better results, but data conversion is just as important. Formalizing and modeling the biological processes and information using mathematical techniques may provide various novel viewpoints and keen insights into the nature of protein sequences.
Summary by Results In the following we summarize the results of the Author by arranging them into four distinct thesis points. Table 8 shows the relation between the thesis points and the publication, where they were presented by the Author. I Protein benchmark a The Author participated in building the Protein Classification Benchmark database in order to provide standard datasets on which the performance of the machine learning algorithms and similarity/distance measures could be compared. The number of total classification tasks exceeds 9500. Here the contribution of the Author was the evaluation of the state-ofthe-art machine learning techniques on the classification tasks and he provided a parameter set which probably gives the best results as a baseline for newly developed methods [9]. b The Author developed a general mathematical framework for constructing a positive train and test set, which was termed by supervised cross-validation. This technique gives a reliable estimation on how an algorithm will generalize a new distantly related subtype within a known protein class that can also be viewed as a generalization ability of the learned model. He also designed and evaluated the comparative experiments and the resulting datasets provided lower, and in our opinion, more realistic estimates of the classifier performance than those of cross-validation schemes (10-fold or leave- one-out) [7]. The Author examined how the classification results depend on the filtering of the categories from the negative set in order to speed the execution time of the preprocessing and learning method up and to avoid the class-imbalanced problem. The Author designed and evaluated the experiments that led him recommend to misuse it since the resulted negative class may 13
be to specific ant less representative with respect to the entire database. Although this result may be considered as a negative results, in our opinion we should have mentioned it since it makes the characterization of the hierarchically organized protein datasets in classification point of view more complete [7]. Hence when constructing the positive train set, we suggest using the supervised cross-validation but for the negative set we suggest using the random filtering method [7]. II Likelihood ratio scoring a The Author suggested the application of a simple likelihood ratio approximation for improving the ranking ability of a protein similarity measure. He designed and evaluated the comparative experiments which justified his view that this likelihood scoring significantly improves the performance of similarity functions [27]. III Compression-based Distances (CBDs) a The Author examined the behaviour of CBDs on protein classification from several aspects. An analysis of the results showed that the CBDs perform less well than substructure-based comparisons like the outstanding Smith-Waterman algorithm in protein similarity. This is in fact expected, since Smith-Waterman calculations include a substantial amount of biological knowledge encoded in the amino acid substitution matrix while CBDs do not use any apriori information. [37; 46]. The Author examined the efficiency of the CBDs as a function of the size of the alphabet. An alphabet reduction was carried out by grouping the similar types of amino acids an on the alphabet extension was obtained by representing each bi-gram and tri-gram with a new character. The Author designed and evaluated the experiments that did not display, for amino acids or nucleotide sequences, any noticeable relationship between the performance and the size of the alphabet [46]. b The Author investigated the combination of CBMs with an additional cheap, but problemspecific similarity measure. He designed and evaluated the comparative test which showed that this mixed measure can slightly exceed the performance of the computationally expensive Smith-Waterman and two Hidden Markov Model-based algorithms as well. [37]. IV Equivalence learning a The Author introduced the notion of equivalence learning as a new way of carrying out similarity learning, and he developed it for protein classification. He designed and evaluated exhaustive experiments and the results show that this novel protein classification technique performed better than the others [62]. b The Author developed a new class of kernel functions, namely the Support Vector Kernel (SVK). He theoretically proved that it is a valid kernel function, and he defined two new ways to learn SVK along with a new parameter setting technique. He designed and evaluated the experiments as well [63]. V Noise reduction for the microarray 14
a The contribution of the Author to this task was the design of the experiments and evaluations of the classification and the feature selection methods on microarray datasets. The Author designed an automatic parameter-tuning algorithm for the Kalman Filter as well, which is a common and indivisible result with the first author of [69]. The results presented in the dissertation resulted in several publications. Table 8 summarizes which publication covers which item of the thesis points. I II III IV V
[9] a
[7] b
[27]
[37]
[46]
a,b
a
[62]
[63]
a
a,b
[69]
a
a
Table 8: The relation between the theses and publications.
15
References [1] Arthur M. Lesk. Introduction to Bioinformatics. Oxford University Press, 2002. [2] Zoe Lacroix and Terence Critchlow. Bioinformatics – Managing Scientific Data. Morgan Kaufmann Publishers, 2003. [3] Richard O. Duda, Peter E. Hart, and David G. Stork. Pattern Classification. Wiley Interscience, 2 edition, 2000. [4] M. Gribskov and N. Robinson. Use of receiver operating characteristic (roc) analysis to evaluate sequence matching, comput. chem. (20), pp. 25–33, 1996. [5] K. Tsuda. Support vector classifier with asymmetric kernel function in european symposium on artificial neural networks (esann), pp. 183–188, 1999. [6] Hiroto Saigo, Jean-Philippe Vert, Nobuhisa Ueda, and Tatsuya Akutsu. Protein homology detection using string alignment kernels. Bioinformatics, 20(11):1682–1689, Jul 2004. [7] Attila Kert´ esz-Farkas, Somdutta Dhir, Paolo Sonego, Mircea Pacurar, Sergiu Netoteia, Harm Nijveen, Arnold Kuzinar, Jack Leunissen, Andr´ as Kocsor, and S´ andor Pongor. Benchmarking protein classification algorithms via supervised cross-validation. J Biochem Biophys Methods, 35:1215–1223, 2007. anos Murvai, Kristian Vlahoviek, Csaba Szepesv´ ari, and S´ andor Pongor. Prediction of protein functional domains from sequences using artificial neural [8] J´ networks. Genome Research, 11(8):1410–1417, 2001. [9] Paolo Sonego, Mircea Pacurar, Somdutta Dhir, Attila Kert´ esz-Farkas, Andr´ as Kocsor, Zolt´ an G´ asp´ ari, Jack A. M. Leunissen, and S´ andor Pongor. A protein classification benchmark collection for machine learning. Nucleic Acids Research, 35(Database-Issue):232–236, 2007. [10] J.D. Pollack, Q. Li, and D.K. Pearl. Taxonomic utility of a phylogenetic analysis of phosphoglycerate kinase proteins of archaea, bacteria, and eukaryota: insights by bayesian analyses. Mol. Phylogenet. Evol., 35:420–430, 2005. [11] L. H. Greene, T. E. Lewis, S. Addou, A. Cuff, T. Dallman, M. Dibley, O. Redfern, F. Pearl, R. Nambudiry, A. Reid, I. Sillitoe, C. Yeats, J. M. Thornton, and C. A. Orengo. The cath domain structure database: new protocols and classification levels give a more comprehensive resource for exploring evolution. Nucleic Acids Res, 35(Database issue), January 2007. [12] R. L. Tatusov, N. D. Fedorova, J. D. Jackson, A. R. Jacobs, B. Kiryutin, E. V. Koonin, D. M. Krylov, R. Mazumder, S. L. Mekhedov, A. N. Nikolskaya, B. S. Rao, S. Smirnov, A. V. Sverdlov, S. Vasudevan, Y. I. Wolf, J. J. Yin, and D. A. Natale. The cog database: an updated version includes eukaryotes. BMC Bioinformatics, 4, September 2003. [13] A. Andreeva, D. Howorth, and C. Brenner. Scop database in 2004: refinements integrate structure and sequence family data, 2004. [14] Christopher M. Bishop. Neural networks for pattern recognition. Oxford University Press, Oxford, UK, 1996. [15] Vladimir N. Vapnik. The nature of statistical learning theory. Springer-Verlag New York, Inc., New York, NY, USA, 1995. [16] S.K. Remlinger. Introduction and application of random forest on high throughput screening data from drug discovery, 2003. [17] J C Rice. Logistic regression: An introduction. In B Rhompson, editor, Advances in social science methodology, volume 3, pages 191–245. JAI Press, Greenwich, 1994. [18] S. F. Altschul, W. Gish, W. Miller, E. W. Myers, and D. J. Lipman. Basic local alignment search tool. J Mol Biol, 215(3):403–410, October 1990. [19] Temple F. Smith and Michael S. Waterman. Identification of common molecular subsequences. Journal of Molecular Biology, 147:195–197, 1981. [20] Saul B. Needleman and Christian D. Wunsch. A general method applicable to the search for similarities in the amino acid sequence of two proteins. J Mol Biol, 48(3):443–53, 1970. [21] Jean-Philippe Vert, Hiroto Saigo, and Tatsuya Akutsu. Local alignment kernels for biological sequences. In Bernhard Schoelkopf, Koji Tsuda, and Jean-Philippe Vert, editors, Kernel Methods in Computational Biology, Cambridge, MA, 2004. MIT Press. [22] Zolt´ an G´ asp´ ari, Kristian Vlahovicek, and S´ andor Pongor. Efficient recognition of folds in protein 3d structures by the improved pride algorithm. Bioinformatics, 21(15):3322–3323, 2005. [23] L. Holm and J. Park. Dalilite workbench for protein structure comparison. Bioinformatics, 16(6):566–567, June 2000. [24] S. F. Altschul, T. L. Madden, A. A. Sch¨ affer, J. Zhang, Z. Zhang, W. Miller, and D. J. Lipman. Gapped blast and psi-blast: a new generation of protein database search programs. Nucleic Acids Res, 25(17):3389–3402, Sep 1997. [25] W. R. Pearson. Rapid and sensitive sequence comparison with FASTP and FASTA. Methods Enzymol, 183:63–98, 1990. [26] David Claus and Andrew W. Fitzgibbon. Reliable fiducial detection in natural scenes. In Tom´ as Pajdla and Jiri Matas, editors, ECCV (4), volume 3024 of Lecture Notes in Computer Science, pages 469–480. Springer, 2004. [27] L´ aszl´ o Kaj´ an, Attila Kert´ esz-Farkas, Dino Franklin, Neli Ivanova, Andr´ as Kocsor, and S´ andor Pongor. Application of a simple likelihood ratio approximant to protein sequence classification. Bioinformatics, 22(23):2865–2869, 2006.
16
[28] Li Liao and William Stafford Noble. Combining pairwise sequence similarity and support vector machines for remote protein homology detection. In RECOMB ’02: Proceedings of the sixth annual international conference on Computational biology, pages 225–232, New York, NY, USA, 2002. ACM. [29] Anders Krogh and Søren Kamaric Riis. Hidden neural networks. Neural Comput., 11(2):541–563, 1999. [30] M. Li, J. H. Badger, X. Chen, S. Kwong, P. Kearney, and H. Zhang. An information-based sequence distance and its application to whole mitochondrial genome phylogeny. Bioinformatics, 17(2):149–154, Feb 2001. [31] Ming Li, Jonathan H. Badger, Xin Chen, Sam Kwong, Paul E. Kearney, and Haoyong Zhang. An information-based sequence distance and its application to whole mitochondrial genome phylogeny. Bioinformatics, 17(1):149–154, 2001. [32] Dario Benedetto, Emanuele Caglioti, and Vittorio Loreto. Zipping out relevant information. Computing in Science and Engg., 5(1):80–85, 2003. anyi. The similarity metric. In SODA ’03: Proceedings of the fourteenth annual ACM-SIAM symposium [33] Ming Li, Xin Chen, Xin Li, Bin Ma, and Paul Vit´ on Discrete algorithms, pages 863–872, Philadelphia, PA, USA, 2003. Society for Industrial and Applied Mathematics. [34] R. Cilibrasi and P. M. B. Vitanyi. Clustering by compression. IEEE Transactions on Information Theory, 51(4):1523–1545, 2005. [35] Alexander Kraskov, Harald St¨ ogbauer, Ralph G. Andrzejak, and Peter Grassberger. Hierarchical clustering using mutual information. CoRR, qbio.QM/0311037, 2003. [36] Rudi Cilibrasi, Paul Vit´ anyi, and Ronald De Wolf. Algorithmic clustering of music based on string compression. Comput. Music J., 28(4):49–67, 2004. [37] Andr´ as Kocsor, Attila Kert´ esz-Farkas, L´ aszl´ o Kaj´ an, and S´ andor Pongor. Application of compression-based distance measures to protein sequence classification: a methodological study. Bioinformatics, 22(4):407–412, 2006. [38] N. Krasnogor and D. A. Pelta. Measuring the similarity of protein structures by means of the universal similarity metric. Bioinformatics, 20(7):1015–1021, 2004. [39] Paolo Ferragina, Raffaele Giancarlo, Valentina Greco, Giovanni Manzini, and Gabriel Valiente. Compression-based classification of biological sequences and structures via the universal similarity metric: experimental assessment. BMC Bioinformatics, 8:252+, July 2007. [40] Marco Cuturi and Jean-Philippe Vert. The context-tree kernel for strings. Neural Netw., 18(8):1111–1123, 2005. [41] C. Costa Santos, J. Bernardes, P. M. B. Vitanyi, and L. Antunes. Clustering fetal heart rate tracings by compression. In CBMS ’06: Proceedings of the 19th IEEE Symposium on Computer-Based Medical Systems, pages 685–690, Washington, DC, USA, 2006. IEEE Computer Society. [42] Thomas M. Cover and Joy A. Thomas. Elements of information theory. John Wiley and Sons, Inc., 1991. [43] J. Ziv and A. Lempel. A universal algorithm for sequential data compression. IEEE Transactions on Information Theory, 23(3):337–343, May 1977. [44] J. Cleary and I. Witten. Data compression using adaptive coding and partial string matching. IEEE Transactions on Communications, 32(4):396–402, Apr 1984. [45] Xin Chen, Sam Kwong, and Ming Li. A compression algorithm for DNA sequences and its applications in genome comparison. In RECOMB, page 107, 2000. esz-Farkas, Andr´ as Kocsor, and S´ andor Pongor. The application of the data compression-based distances to biological sequences. In Frank [46] Attila Kert´ Emmert-Streib and Matthias Dehmer, editors, Information Theory and Statistical Learning, Lecture Notes in Computer Science. Springer, 2008. [47] Richard Durbin, Sean R. Eddy, Anders Krogh, and Graeme Mitchison. Biological Sequence Analysis : Probabilistic Models of Proteins and Nucleic Acids. Cambridge University Press, July 1999. [48] Edward Susko and Andrew J. Roger. On reduced amino acid alphabets for phylogenetic inference. Mol Biol Evol, 24:2139–2150, Sep 2007. [49] George J. Klir, Ute St. Clair, and Bo Yuan. Fuzzy set theory: foundations and applications. Prentice-Hall, Inc., Upper Saddle River, NJ, USA, 1997. [50] T. Jaakkola, M. Diekhaus, and D. Haussler. Using the fisher kernel method to detect remote protein homologies. 7th Intell. Sys. Mol. Biol., pages 149–158, 1999. [51] K. Karplus, C. Barrett, and R. Hughey. Hidden markov models for detecting remote protein homologies. Bioinformatics, 14(10):846–856, 1998. [52] Eric P. Xing, Andrew Y. Ng, Michael I. Jordan, and Stuart Russell. Distance metric learning, with application to clustering with side-information, 2003. [53] Ivor Tsang and James Kwok. Distance metric learning with kernels, 2003. [54] James T. Kwok and Ivor W. Tsang. Learning with idealized kernels. In Tom Fawcett and Nina Mishra, editors, ICML, pages 400–407. AAAI Press, 2003. [55] Jason V. Davis, Brian Kulis, Prateek Jain, Suvrit Sra, and Inderjit S. Dhillon. Information-theoretic metric learning. In ICML ’07: Proceedings of the 24th international conference on Machine learning, pages 209–216, New York, NY, USA, 2007. ACM. [56] Kilian Weinberger, John Blitzer, and Lawrence Saul. Distance metric learning for large margin nearest neighbor classification. In Y. Weiss, B. Sch¨ olkopf, and J. Platt, editors, Advances in Neural Information Processing Systems 18, pages 1473–1480. MIT Press, Cambridge, MA, 2006.
17
[57] Alexander Zien and Cheng Soon Ong. Multiclass multiple kernel learning. In ICML ’07: Proceedings of the 24th international conference on Machine learning, pages 1191–1198, New York, NY, USA, 2007. ACM. [58] Jean-Philippe Vert, Jian Qiu, and William S Noble. A new pairwise kernel for biological network inference with support vector machines. BMC Bioinformatics, 8(Suppl 10):S8, 2007. [59] Y. Yamanishi, J.-P. Vert, and M. Kanehisa. Protein network inference from multiple genomic data: a supervised approach. Bioinformatics, 20(1):363–370, 2004. [60] Maricel Kann and Richard A. Goldstein. Optima: A new score function for the detection of remote homologs. In Concettina Guerra and Sorin Istrail, editors, Mathematical Methods for Protein Structure Analysis and Design, volume 2666 of Lecture Notes in Computer Science, pages 99–108. Springer, 2003. [61] Hiroto Saigo, Jean-Philippe Vert, and Tatsuya Akutsu. Optimizing amino acid substitution matrices with a local alignment kernel. BMC Bioinformatics, 7:246, 2006. [62] Attila Kert´ esz-Farkas, Andr´ as Kocsor, and S´ andor Pongor. Equivalence learning in protein classification. In Petra Perner, editor, MLDM, volume 4571 of Lecture Notes in Computer Science, pages 824–837. Springer, 2007. [63] J´ ozsef Dombi and Attila Kert´ esz-Farkas. Using fuzzy technologies for equivalence learning in protein classification. Accepted for publication in Journal of Computational Biology, 2008. [64] Vladimir N. Vapnik. The Nature of Statistical Learning Theory. Springer, 2 edition, 1999. [65] M. Schena. DNA microarrays: A practical approach, volume 205 of Practical Approach Series. Oxford Univ. Press., Oxford, 1999. [66] Y. Tu, G. Stolovitzky, and U. Klein. Quantitative noise analysis for gene expression microarray experiments. Proc Natl Acad Sci U S A, 99(22):14031– 14036, Oct 2002. [67] I. T. Jolliffe. Principal Component Analysis. Springer, second edition, October 2002. [68] R. E. Kalman. A new approach to linear filtering and prediction problems. Transactions of the ASME Journal of Basic Engineering, D(82):35–45, 1960. anos Z. Kelemen, Attila Kert´ esz-Farkas, Andr´ as Kocsor, and L´ aszl´ o G. Pusk´ as. Kalman filtering for disease-state estimation from microarray data. [69] J´ Bioinformatics, 22(24):3047–3053, 2006.
18