molecular profiling with a recent network comparison method. The pipeline can iden- .... needed to be tuned. The method is implemented in Python and it is ...
Proceedings of CIBB 2011
1
A MACHINE LEARNING PIPELINE FOR DISCRIMINANT PATHWAYS IDENTIFICATION Annalisa Barla(1) , Giuseppe Jurman(2) , Roberto Visintainer(2,3) Margherita Squillario(1) , Michele Filosi(2,4) , Samantha Riccadonna(2) , Cesare Furlanello(2) (1) DISI, University of Genoa, {annalisa.barla,margherita.squillario}@unige.it (2) Fondazione Bruno Kessler, {filosi,jurman,riccadonna,furlan,visintainer}@fbk.eu (3) DISI, University of Trento (4) CIBIO, University of Trento Keywords: Pathway identification, network comparison, functional characterization, profiling Abstract. Identifying the molecular pathways more prone to disruption during a pathological process is a key task in network medicine and, more in general, in systems biology. In this work we propose a pipeline that couples a machine learning solution for molecular profiling with a recent network comparison method. The pipeline can identify changes occurring between specific sub-modules of networks built in a case-control biomarker study, discriminating key groups of genes whose interactions are modified by an underlying condition. The proposal is independent from the classification algorithm used. Two applications on genomewide data are presented regarding children susceptibility to air pollution and early and late onset of Parkinson’s disease. 1 Introduction Nowadays, it is widely accepted that most known diseases are of systemic nature, i.e. their phenotypes can be attributed to the breakdown of a set of molecular interactions among cell components rather than imputed to the malfunctioning of a single entity such as a gene. Such sets of interactions are the focus of attention of a new discipline known as network medicine [1] devoted to understand how pathology may alter cellular wiring diagrams at all possible levels of functional organization (from transcriptomics to signaling, the molecular pathways being a typical example). The key tools for this discipline are derived by recent advances in the theory of complex networks [2, 3, 4, 5, 6]. Applications can be achieved by reconstruction algorithms for inferring networks topology and wiring starting from a collection of high-throughput measurements [7]. However, the tackled problem is “a daunting task” [8] and these methods are not flawless [9], due to many factors. Among them, under determinacy is a major issue [10], as the ratio between network dimension (number of nodes) and the number of available measurements to infer interactions plays a key role for the stability of the reconstructed structure. Although some initial progress, the stability –and thus the reproducibility– of the process is still an open problem. Here we propose a machine learning pipeline for identifying disruption of key molecular pathways induced by or inducing a condition, given microarray data in a case/control experimental design. The problem of under-determinacy in the inference procedure is avoided by focusing only on subnetworks. Moreover, the relevance of the studied pathways for the disease is evaluated from their discriminative relevance for the underlying classification problem. The profiling part of the pipeline is composed by a classifier and a feature selection method embedded within an adequate experimental procedure
2
Proceedings of CIBB 2011
or Data Analysis Protocol [11]. Its outcome is a ranked list of genes with the highest discriminative power. These genes undergo an enrichment phase [12, 13] to identify whole pathways involved, to recover established functional dependencies that could get lost by limiting the analysis to the selected genes. Finally, a network is inferred for both the case and the control samples on the selected pathways. The two structures are compared to pinpoint the occurring differences and thus to detect the relevant pathway related variations. A noteworthy point of this workflow is independence from its components: the classifier, the feature ranking algorithm, the enrichment procedure, the inference method and the network comparison function can all be exchanged with alternative methods. In particular, this property is desirable for the network comparison section. Despite its common use even in biological contexts [14], the problem of quantitatively comparing network (e.g. using a metric instead of evaluating network properties) is a widely open issue affecting many scientific disciplines. As discussed in [15], the drawback of many classical distances (such as those of the edit family) is locality, that is focusing only on the portions of the network interested by the differences in the presence/absence of matching links. Alternative metrics can overcome this problem so to consider the global structure of the compared topologies; in particular spectral distances - based on the list of eigenvalues of the Laplacian matrix of the underlying graph - are effective in this task. Within them, the Ipsen-Mikhailov [16] distance has been proven to be the most robust in a wide range of situations. In what follows we will describe the workflow in details, providing two examples of application in problems of biological interest: the first task concerns the transcriptomics consequences of exposure to environmental pollution on two cohorts of children in Czech Republic, while the second one investigates the molecular characteristics of Parkinson’s disease (PD) at early and late stages. To further validate our proposal, different experimental conditions will be used in the two studies, by varying the algorithm component throughout the various steps of the workflow. In both application studies, biologically meaningful considerations on the occurring subnetwork variations can be drawn, consistently with previous findings. 2 Methods In this section we will describe the proposed pipeline and its main phases. Each phase can be completed using alternative methods. In the present work we applied: SRDA and `1 `2 for the feature selection step; WebGestalt toolkit for the pathway enrichment step; WGCN and ARACNE for the subnetwork inference step and the Ipsen-Mikhailov distance to evaluate distances between the reconstructed networks. 2.1 The pipeline The proposed machine learning pipeline handles case/control transcription data through four main steps, that connect a profiling task (output: a ranked list of genes) with the identification of discriminant pathways (output: ranked list of GO terms differentiating pathophysiology states), see Figure 1.
Gene Expression Data
Phenotype Classification Regression
Feature selection step
Pathway Enrichment
Subnetwork Inference
Aracne, WGCNA SRDA, L1L2
GSEA, GSA Density
Figure 1: Schema of the analysis pipeline.
Subnetwork Analysis
Subnetwork Comparison
Proceedings of CIBB 2011
3
In particular, we are given a collection of n samples, each described by a d-dimensional vector x of measurements. Each sample is also associated with a phenotypical label y = {1, −1}, assigning it to a class (e.g. pollution vs. no-pollution in first experiment hereafter). The dataset is therefore represented by a n × d gene expression data matrix X (d >> n) and the label vector Y . The pair (X, Y ) is used to feed the profiling part of the pipeline, i.e. the identification of a predictive classifier and of a set of most discriminant biomarkers. Following [11], biomarker identification is based on Data Analysis Protocol (DAP) to ensure accurate and reproducible results. In our proposal predictive models are trained on the variables identified either from a sparse regression method (e.g., `1 `2 ) or from a classifier (e.g., SRDA) coupled with a feature selection algorithm. For microarray data, the output of the profiling part of the pipeline is a ranked list of genes g1 , ..., gd from which we extract a gene signature g1 , ..., gk of the top-k most discriminant genes. The gene list is chosen as a solution balancing accuracy of the classifier and stability of the signature [11]. In the second part of the pipeline, pathway enrichment techniques (e.g., GSEA or GSA) [12, 13] are applied to retrieve for each gene gi the corresponding whole pathway pi = {h1 , ..., ht }, where the genes hj 6= gi not necessarily belong to the original signature g1 , ..., gk . Extending the analysis to all the hj genes of the pathway allows us to explore functional interactions that would otherwise be missed. The subnetwork inference phase requires to reconstruct a network for each pathway pi by using the steady state expression data of the samples of each class y. The network inference procedure is limited to the sole genes belonging to the pathway pi in order to avoid the problem of intrinsic underdeterminacy of the task. As an additional caution against this issue, in the following experiments we limit the analysis to pathways having more than 4 nodes and more than 1000 nodes. For each pi and for each y, we obtain a real-valued adjacency matrix, which is binarized by choosing a threshold on the correlation values. This strategy requires the construction of a binary adjacency matrix Npi ,y,ts for each pi , for each y and for a grid of threshold values t1 , ..., tT . For each value ts of the grid, we compute for each pi both the distance D (e.g., the Ipsen-Mikhailov distance) between the case and control pathway graphs and the corresponding densities. We choose ts considering the best balance between the average distance across the pathways pi and the network density. For a fixed ts and for each pi , we obtain a score D(Npi ,y=1,ts , Npi ,y=−1,ts ) used to rank the pathways pi . A threshold chosen to maximize the scale-freeness of the entire network would not necessarily guarantee the same property for its sub-networks, as shown in [17]. Therefore, as pointed out in [18], it is advisable to maximize the density of the subnetwork of interest in order to have a sufficient amount of information. As an additional scoring indicator for g1 , ..., gk , we also provide the difference between the weighted degree in the patient and in the control network. A final step of biological relevance assessment of the ranked pathways concludes the pipeline. Alternative algorithms can be used at each step of the pipeline: in particular in the profiling part different classifiers, regression or feature selection methods can be adopted. In what follows we describe the elementary steps used in the examples described in Section 4. 2.2 Experimental setup for the examples Spectral Regression Discriminant Analysis (SRDA). SRDA belongs to the Discriminant Analysis algorithms family [19]. Its peculiarity is to exploit the regression framework for improving the computational efficiency. Spectral graph analysis is used for solving only a set of regularized least squares problems avoiding the eigenvector computation. A score is assigned to each feature and can be interpreted as a feature weight, allowing directly feature ranking and selection. The regularization value α is the only parameter needed to be tuned. The method is implemented in Python and it is
Proceedings of CIBB 2011
4
available within the mlpy library1 . The `1 `2 feature selection framework (`1 `2F S ). `1 `2F S with double optimization is a feature selection method that can be tuned to give a minimal set of discriminative genes or larger sets including correlated genes [20]. The objective function is a linear model f (x) = βx, whose sign gives the classification rule that can be used to associate a new sample to one of the two classes. The sparse weight vector β is found by minimizing the `1 `2 functional: ||Y − βX||22 + τ ||β||1 + µ||β||22 where the least square error is penalized with the `1 and `2 norm of the coefficient vector β. The training for selection and classification requires a careful choice of the regularization parameters for both `1 `2 and RLS. Indeed, model selection and statistical significance assessment is performed within two nested K-cross validation loops as in [21]. The framework is implemented in Python and uses the L1L2Py library2 . Functional Characterization. WebGestalt is an online gene set analysis toolkit3 . This web-service takes as input a list of relevant genes/probesets and performs a GSEA analysis [13] in Gene Ontology (GO) , identifying the most relevant pathways and ontologies in the signatures. In this set of experiments we selected the WebGestalt human genome as reference set, 0.05 as level of significance, 3 as the minimum number of genes and the default Hypergeometric test as statistical method. Medline 4 was used to retrieve the available domain knowledge on the genes. Weighted Gene Co-Expression Networks (WGCN). WGCN networks are based on the idea of using (a function of) the absolute correlation between the expressions of a pair of genes across the samples to define a link between them. Soft thresholding techniques are then employed to obtain a binary adjacency matrix, where a suitable biologically motivated criterion (such as the scale-free topology, or some other prior knowledge) can be adopted [18, 23]. Due to the very small sample size, scale-freeness can not be considered as a reliable criterion for threshold selection so we adopted a different heuristics: for both networks in the two classes the selected threshold is the one maximizing the average Ipsen-Mikhailov distance on the selected pathways. Algorithm for the Reconstruction of Accurate Cellular Networks (ARACNE). ARACNE is a recent method for inferring networks from the transcription level [24] to the metabolic level [25]. Besides being originally designed for handling the complexity of regulatory networks in mammalian cells, it is able to address a wider range of network deconvolution problems. This information-theoretic algorithm removes the vast majority of indirect candidate interactions inferred by co-expression methods by using the data processing inequality property [26]. In this work we use the MiNET (Mutual Information NETworks) Bioconductor package keeping the default value for the data processing inequality tolerance parameter [27]. The adopted threshold criterion is the same as the one applied for WGCN. Ipsen-Mikhailov distance. The definition of the � metric follows the dynamical interpretation of a N -nodes network as a N -atoms molecules connected by identical elastic strings, where the pattern of connections is defined by the adjacency matrix of the corresponding network. The vibrational frequencies ωi of the dynamical system are given by the eigenvalues of the Laplacian matrix of the network: λi = −ωi2 , with λ0 = ω0 = 0. The spectral density for a graph as the sum of Lorentz distributions N −1 X γ , where γ is the common width5 and K is defined as ρ(ω) = K (ω − ω )2 + γ2 k i=1 R∞ is the normalization constant solution of 0 ρ(ω)dω = 1. Then the spectral distance 1
http://mlpy.fbk.eu/ http://slipguru.disi.unige.it/Research/L1L2Py 3 http://bioinfo.vanderbilt.edu/webgestalt/ [22] 4 http://www.ncbi.nlm.nih.gov/pubmed/ 5 γ specifies the half-width at half-maximum (HWHM), equal to half the interquartile range. 2
Proceedings of CIBB 2011
5
� between two graphs G and H with densities ρG (ω) and ρH (ω) can then be defined qR ∞ as [ρG (ω) − ρH (ω)]2 dω . To get a meaningful comparison of the value of � on 0 pairs of networks with different number of nodes, we define the normalized version �(G, H) �ˆ(G, H) = , where En , Fn indicate respectively the empty and the fully con�(Fn , En ) nected network on n nodes: they are the two most �-distant networks for each n. The common width γ is set to 0.08 as in the original reference: being a multiplicative factor, it has no impact on comparing different values of the Ipsen-Mikhailov distance. The network analysis phase is implemented in R through the igraph package. 3 Data description In this section we will describe the datasets chosen for the analysis. In the first experiment we used a microarray dataset investigating the effects of air pollution on children. In the second experiment we analyzed gene expression data on PD. Both examples are based on publicly available data on the Gene Expression Omnibus (GEO). Children susceptibility to air pollution. The first dataset (GSE7543) collects data of children living in two regions of the Czech Republic with different air pollution levels [28]: 23 children recruited in the polluted area of Teplice and 24 children living in the cleaner area of Prachatice. Blood samples were hybridized on Agilent Human 1A 22k oligonucleotide microarrays. After normalization we retained 17564 features. Clinical stages of Parkison’s disease. PD data is composed of two publicly available datasets from GEO, i.e. GSE6613 [29] and GSE20295 [30]. The former includes 22 controls and 50 whole blood samples coming from patients predominantly at early PD stages while the latter is composed of 53 controls and 40 PD patients with late stage PD. Biological data were hybridized on Affymetrix HG-U133A platform, estimating the expression of 22215 probesets for each sample. 4 Results In this section we will report the results obtained from the analysis on air pollution and PD data. In the former case the feature selection and the subnetwork inference tasks were accomplished using SRDA and WGCN while in the latter the same two tasks were carried out using respectively `1 `2 and ARACNE. 4.1 Air Pollution Experiment The SRDA analysis of the effects associated to air pollution provided a molecular profile e.g. a gene signature differentiating between children in Teplice (exposed) and Prachatice (non-exposed) with 76% classification accuracy. Selected by 100 × 5-fold cross validation, the signature consists of a ranked list of 50 probesets, corresponding to 43 genes then used for the enrichment analysis. According to the analysis, 11 enriched ontologies in GO were identified. The most enriched ones concern the developmental processes. This GO class contains ontologies especially related to the development of skeletal and nervous systems, which undergo a rapid and constant growth in children. Other enriched terms are related to the capacity of an organism to defend itself (i.e. response to wounding and inflammatory response), to the regulation of the cell death (i.e. negative regulation of apoptosis, the multi-organism process, the glycerlolipid metabolic process), the response to external stimuli (i.e. inflammatory response, response to wounding) and to locomotion. We then constructed the corresponding WGCN networks for the 11 selected pathways for both cases and controls. In Table 1 (left) we report the pathways together with the number of the included genes, ranked for decreasing Ipsen-Mikhailov distance, i.e. difference between cases and controls. The most disrupted pathway is GO:0043066 (apoptosis) followed by GO:0001501
6
Proceedings of CIBB 2011
Table 1: Air Pollution Experiment: pathways corresponding to mostly discriminant genes ranked by �ˆ (left) and differential degree of the top genes belonging to the 11 analyzed pathways (right).
Pathway Code GO:0043066 GO:0001501 GO:0009611 GO:0007399 GO:0016787 GO:0005516 GO:0007275 GO:0006954 GO:0005615 GO:0007626 GO:0006066
�ˆ 0.257 0.149 0.123 0.093 0.078 0.076 0.076 0.048 0.038 0.000 0.000
# Genes 21 89 16 252 718 116 453 180 417 5 8
Agilent ID 4701 12235 8944 3697 4701 12537 13835 11673 16424 13094 8944 14787 15797 15797 11302 15797
Gene NRGN DUSP15 CLC ITGB5 NRGN PROK2 OLIG1 HOXB8 FKHL18 DHX32 CLC MATN3 CXCL1 CXCL1 MYH1 CXCL1
Pathway GO:0007399 GO:0016787 GO:0016787 GO:0007275 GO:0005516 GO:0006954 GO:0007275 GO:0007275 GO:0007275 GO:0016787 GO:0007275 GO:0001501 GO:0006954 GO:0005615 GO:0005516 GO:0007399
∆ Degree -2.477 -1.586 -1.453 -1.390 -1.357 1.069 0.834 -0.750 -0.685 -0.575 0.561 0.495 0.467 0.338 -0.194 0.131
(skeletal development). Since the children under study are undergoing natural development, especially physical changes of their skeleton, the high difference between cases and controls of the GO:0001501 and the involvment of pathway GO: 0007275 i.e. developmental process is biologically very sound. Another relevant pathway is GO:0006954, representing the response to infection or injury caused by chemical or physical agents. Several genes included in GO:0005516 bind or interact with calmodulin, that is a calcium-binding protein involved in many essential processes, such as inflammation, apoptosis, nerve growth, and immune response. This is a key pathway that is linked with all the above mentioned terms as well as to GO:0007399, which is meaningful, being one of the most stimulated pathways together with the i.e. skeletal development. Table 1 (right) also lists the genes that most sensibly change their connection degree, that is, the strength of their interactions within the pathway. Some of them (FKHL18, HOXB8, PROK2, DHX32, MATN3) are directly involved in the development. Furthermore: CLC is a key element in the inflammation and immune system; OLIG1 is a transcription factor that works in the oligodendrocytes within the brain. NRGN binds calcium and is a target for thyroid hormones in the brain. Finally, MYH1 encodes for myosin which is a major contractile protein component of striated, smooth and non-muscle cells, and whose isoforms show expression that is spatially and temporally regulated during development. 4.2 Parkinson Disease Experiment The `1 `2 analysis of the PD dataset lead to two gene signatures for the early and late stages of PD. The early stage signature consisted of 77 probesets corresponding to 70 genes with a 62% accuracy. The late stage signature consisted of 94 probesets (90 genes, 80% accuracy). The selection was performed within a 9-fold and 8-fold nested cross validation loop. The enrichment analysis on the two gene lists identified relevant enriched nodes either specific or common between early and late PD. The common pathways have a very general meaning (e.g. intracellular, cytoplasm, negative regulation of biological process). Those specific for the early stage concern the immune system, the response to stimulus (i.e. stress, chemicals or other organism like virus), the regulation of metabolic processes, the biological quality and cell death. The pathways specific for late stage are
7
Proceedings of CIBB 2011
related to the nervous system (e.g. neurotransmitter transport, transmission of nerve impulse, learning or memory) and to response to stimuli (e.g. behavior, temperature, organic substances, drugs or endogenous stimuli). Table 2: Parkinson’s disease: selected pathways for late (left) and early (right) stage.
PD early Pathway Code �ˆ GO:0012501 0.49 GO:0005764 0.39 GO:0019901 0.38 GO:0005506 0.38 GO:0008219 0.38 GO:0016323 0.37 GO:0006952 0.37 GO:0046983 0.36 GO:0045087 0.36 GO:0046914 0.35 GO:0016265 0.33 GO:0042802 0.33 GO:0042803 0.32 GO:0050896 0.31 GO:0006955 0.31 GO:0006915 0.31 GO:0042981 0.30 GO:0030218 0.29 GO:0006950 0.28 GO:0020037 0.26 GO:0005938 0.26 GO:0005856 0.24 GO:0016567 0.23 GO:0003779 0.23 GO:0042592 0.22 GO:0051607 0.21 GO:0016564 0.18 GO:0005200 0.16 GO:0030097 0.15 GO:0009615 0.14 GO:0008092 0.12 GO:0030099 0.07 GO:0019900 0.04 GO:0034101 0.00 GO:0051707 0.00
# Genes 4 257 116 434 110 111 160 153 112 51 6 473 411 213 778 687 206 33 253 176 50 816 103 431 9 26 229 127 76 111 77 19 32 8 5
PD late Pathway Code �ˆ Genes GO:0019226 0.31 20 GO:0010033 0.20 30 GO:0007611 0.16 34 GO:0030234 0.15 20 GO:0042493 0.15 109 GO:0032403 0.12 14 GO:0019717 0.12 79 GO:0009725 0.11 27 GO:0030424 0.10 93 GO:0005096 0.09 252 GO:0007267 0.09 264 GO:0050790 0.09 15 GO:0019001 0.09 34 GO:0017111 0.09 157 GO:0007585 0.09 47 GO:0005516 0.09 215 GO:0005626 0.09 41 GO:0045202 0.08 278 GO:0007610 0.08 40 GO:0005624 0.08 616 GO:0043087 0.08 22 GO:0003779 0.08 423 GO:0008047 0.07 60 GO:0042995 0.07 231 GO:0006928 0.07 166 GO:0003924 0.07 294 GO:0007568 0.06 35 GO:0043234 0.06 233 GO:0007268 0.06 201 GO:0030030 0.05 27 GO:0005525 0.05 450 GO:0006412 0.05 466 GO:0043005 0.05 51 GO:0006836 0.05 42 GO:0043025 0.04 82 GO:0042221 0.00 16 GO:0009266 0.00 6 GO:0014070 0.00 13 GO:0046578 0.00 8 GO:0050804 0.00 11 GO:0017076 0.00 7
The relevance networks for late stage PD and for early stage PD were constructed for both cases and controls with ARACNE, for 35 and 42 pathways respectively. Pathways and number of included genes are listed in Table 2, ranked for decreasing Ipsen-
8
Proceedings of CIBB 2011
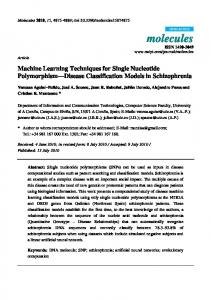
Mikhailov distance. Again top entries correspond to highest difference due to pathophysiological status. The functional alteration of pathways characterized for both early and late stage PD allows a comparative analysis from the biological viewpoint. Common pathways between the two stages are considered up to 1000 nodes, hence discarding more general terms in the GO (see 2.1). Indeed, the only common pathway is GO:0003779, i.e. actin binding. Actin participates in many important cellular processes, including muscle contraction, cell motility, cell division and cytokinesis, vescicle and organelle movement, cell signaling. Clearly, this term is strictly associated to the most evident movement-related symptoms in PD, including shaking, rigidity, slowness of movement and difficulty with walking and gait. In both early and late PD we note some alteration within the biological process class of response to stimulus. In the early PD list we identified GO:0006950 i.e. response to stress, GO:0009615 i.e. response to virus and GO:0051707 i.e. response to other organism. In the late PD list we found GO:0042493, i.e. response to drug, GO:0009725 i.e. response to hormone stimulus, GO:0042221 i.e. response to chemical stimulus, GO:0014070 i.e. response to organic cyclic substance and GO:0009266 response to temperature stimulus. The pathways specific to early PD identify an involvement of the immune system, which is greatly stimulated by inflammation especially located in particular brain regions (mainly substantia nigra). Indeed, we identified: GO:0006952 i.e. defense response, GO:0045087 i.e. innate immuno response also visualized in Figure 2, GO:0006955 i.e. immune response and GO:0030097 i.e. hemopoiesis. In late stage PD,
(a) early PD patients
(b) controls
Figure 2: Networks of the pathway GO:0045087 (innate immune response) for Parkinson’s early development patients (a) compared with healty subjects (b). Node diameter is proportional to the degree, and edge width is proportional to connection strength (estimated correlation).
we detected several differentiated terms related to the Central Nervous System. Among others, we mention: GO:0019226 i.e. transmission of nerve impulse, GO:0007611 i.e. learning or memory, GO:0007610 i.e. behavior and GO:007268 i.e. synaptic transmission. These findings are fitting the late stage PD scenario, where cognitive and behavioral problems may arise with dementia. 5 Conclusions The theory of complex networks has recently proven to be a helpful tool for a systematic and structural knowledge of the cell pathophysiological mechanisms [1]. Here we propose to enhance its value by coupling it with a machine learning preprocessor providing ranked gene lists associated to disease phenotype. This strategy aims at shifting the focus from global to local interaction scales, i.e. on pathways which are most likely to change within specific pathological stages. as a side effect, the strategy is also better tailored to deal with situations where small sample size may affect the reliability of the network inference on a global scale. The pipeline has been validated on two disease datasets of environmental pollution (case vs. control) and Parkinson onset (control, early and late PD). In both applications the pipeline has detected differential pathways that are biologically meaningful. All the components of the pipeline are available as
Proceedings of CIBB 2011
9
open source software. Acknowledgments The authors at FBK acknowledge funding by the European Union FP7 Project HiperDART, by the CARITRO Project CancerAtlas and by the PAT funded Project ENVIROCHANGE. References [1] A. L. Barabasi, N. Gulbahce, and J. Loscalzo. Network medicine: a network-based approach to human disease. Nature Review Genetics, 12:56–68, 2011. [2] S.H. Strogatz. Exploring complex networks. Nature, 410:268–276, 2001. [3] M.E.J. Newman. The Structure and Function of Complex Networks. SIAM Review, 45:167–256, 2003. [4] S. Boccaletti, V. Latora, Y. Moreno, M. Chavez, and D.-U. Hwang. Complex networks: Structure and dynamics. Physics Reports, 424(4–5):175–308, 2006. [5] M.E.J. Newman. Networks: An Introduction. Oxford University Press, 2010. [6] M. Buchanan, G. Caldarelli, P. De Los Rios, F. Rao, and M. Vendruscolo, editors. Networks in Cell Biology. Cambridge University Press, 2010. [7] F. He, R. Balling, and A.-P. Zeng. Reverse engineering and verification of gene networks: Principles, assumptions, and limitations of present methods and future perspectives. J. Biotechnol., 144(3):190–203, 2009. [8] A. Baralla, W.I. Mentzen, and A. de la Fuente. Inferring Gene Networks: Dream or Nightmare? Ann. N.Y. Acad. Sci., 1158:246–256, 2009. [9] D. Marbach, R.J. Prill, T. Schaffter, C. Mattiussi, D. Floreano, and G. Stolovitzky. Revealing strenghts and weaknesses of methods for gene network inference. PNAS, 107(14):6286–6291, 2010. [10] R. De Smet and K. Marchal. Advantages and limitations of current network inference methods. Nature Review Microbiology, 8:717–729, 2010. [11] The MicroArray Quality Control (MAQC) Consortium. The MAQC-II Project: A comprehensive study of common practices for the development and validation of microarray-based predictive models. Nature biotechnology, 28(8):827–838, 2010. [12] B. Zhang, S. Kirov, and J. Snoddy. WebGestalt: an integrated system for exploring gene sets in various biological contexts. Nuc. Acid. Res., 33, 2005. [13] A. Subramanian, P. Tamayo, V. K. Mootha, S. Mukherjee, B. L. Ebert, M. A. Gillette, A. Paulovich, S. L. Pomeroy, T. R. Golub, E. S. Lander, and J. P. Mesirov. Gene set enrichment analysis: A knowledge-based approach for interpreting genome-wide expression profiles. PNAS, 102(43):15545–15550, 2005. [14] R. Sharan and T. Ideker. Modeling cellular machinery through biological network comparison. Nature Biotechnology, 24(4):427–433, 2006. [15] G. Jurman, R. Visintainer, and C. Furlanello. An introduction to spectral distances in networks. In Proc. WIRN 2010, pages 227–234, 2011. [16] M. Ipsen and A.S. Mikhailov. Evolutionary reconstruction of networks. Phys. Rev. E, 66(4):046109, 2002.
Proceedings of CIBB 2011
10
[17] M. P. H. Stumpf, C. Wiuf, and R. M. May. Subnets of scale-free networks are not scale-free: Sampling properties of networks. Proceedings of the National Academy of Sciences of the United States of America, 102(12):4221–4224, 2005. [18] B. Zhang and S. Horvath. A General Framework for Weighted Gene CoExpression Network Analysis. Statistical Applications in Genetics and Molecular Biology, 4(1):Article 17, 2005. [19] D. Cai, X. He, and J. Han. Srda: An efficient algorithm for large-scale discriminant analysis. IEEE Transactions on Knowledge and Data Engineering, 20:1–12, 2008. [20] C. De Mol, S. Mosci, M. Traskine, and A. Verri. A regularized method for selecting nested groups of relevant genes from microarray data. Journal of Computational Biology, 16:1–15, Apr 2009. [21] P. Fardin, A. Barla, S. Mosci, L. Rosasco, A. Verri, and L. Varesio. The l1-l2 regularization framework unmasks the hypoxia signature hidden in the transcriptome of a set of heterogeneous neuroblastoma cell lines. BMC Genomics, Jan 2009. [22] B. Zhang, S. Kirov, and J. Snoddy. Webgestalt: an integrated system for exploring gene sets in various biological contexts. Nucleic Acids Res, 33, Jul 2005. [23] W. Zhao, P. Langfelder, T. Fuller, J. Dong, A. Li, and S. Horvath. Weighted gene coexpression network analysis: state of the art. Journal of Biopharmaceutical Statistics, 20(2):281–300, 2010. [24] A.A. Margolin, I. Nemenman, K. Basso, C. Wiggins, G. Stolovitzky, R. DallaFavera, and A. Califano. Aracne: an algorithm for the reconstruction of gene regulatory networks in a mammalian cellular context. BMC Bioinform., 7(7), 2006. [25] I. Nemenman, G.S. Escola, W.S. Hlavacek, P.J. Unkefer, C.J. Unkefer, and M.E. Wall. Reconstruction of Metabolic Networks from High-Throughput Metabolite Profiling Data. Ann. N.Y. Acad. Sci., 1115:102–115, 2007. [26] T.M. Cover and J. Thomas. Elements of Information Theory. Wiley, 1991. [27] P. Meyer, F. Lafitte, and G. Bontempi. minet: A R/Bioconductor Package for Inferring Large Transcriptional Networks Using Mutual Information. BMC Bioinform., 9(1):461, 2008. [28] D.M. van Leeuwen, M. Pedersen, P.J.M. Hendriksen, A. Boorsma, M.H.M. van Herwijnen, R.W.H. Gottschalk, M. Kirsch-Volders, L.E. Knudsen, R.J. Sram, E. Bajak, J.H.M. van Delft, and J.C.S. Kleinjans. Genomic analysis suggests higher susceptibility of children to air pollution. Carcinogenesis, 29(5), 2008. [29] C.R. Scherzer, A.C. Eklund, L.J. Morse, Z. Liao, J.L. Locascio, D. Fefer, M.A. Schwarzschild, M.G. Schlossmacher, M.A. Hauser, J.M. Vance, L.R. Sudarsky, D.G. Standaert, J.H. Growdon, R.V. Jensen, and S.R. Gullans. Molecular markers of early Parkinson’s disease based on gene expression in blood. PNAS, 2007. [30] Y. Zhang, M. James, F.A. Middleton, and R.L. Davis. Transcriptional analysis of multiple brain regions in Parkinson’s disease supports the involvement of specific protein processing, energy metabolism and signaling pathways and suggests novel disease mechanisms. American Journal of Medical Genetics Part B Neuropsychiatric Genetics, 137B:5–16, 2005.