Available online at www.sciencedirect.com
ScienceDirect Procedia - Social and Behavioral Sciences 175 (2015) 122 – 129
International Conference on Strategic Innovative Marketing, IC-SIM 2014, September 1-4, 2014, Madrid, Spain
A mobile robot vending machine for beaches based on consumers´ preferences and multivariate methods André S. P. H. Navarroa, Carlos M.F. Monteirob*, Carlos B. Cardeirac a
MSc., Departamento de Engenharia e Gestão, Instituto Superior Técnico, Universidade de Lisboa, Portugal b CEG-IST, Instituto Superior Técnico, Universidade de Lisboa, Portugal c LAETA/IDMEC, Instituto Superior Técnico, Universidade de Lisboa, Portugal
Abstract On public beaches and at seaside resorts, the construction of bars and restaurants to deliver food and beverages to visitors is prohibited or highly restricted in many parts of the world. This has motivated the design of a new energetically independent autonomous mobile robot concept that is able to provide this service. To integrate the needs and preferences of the potential customers, a marketing research study was carried out. Respondents were selected using a snowball sampling procedure, and a social network was used to invite additional respondents to fill in an online questionnaire. The preferences of more than seven hundred respondents were used to determine the initial product assortment to be offered by the mobile robot vending machine. In addition, the respondents’ preferences towards a range of design characteristics of the robot were factor analysed, revealing that respondents use seven main importance dimensions when evaluating this new concept. Cluster analysis based on the derived seven dimensions allowed five groups of respondents to be found that valued the various characteristics of the robot differently. This paper then puts forward ideas for how this methodology could be used to guide the further development of this new robot concept. © © 2015 2015 The The Authors. Authors.Published Publishedby byElsevier ElsevierLtd. Ltd. This is an open access article under the CC BY-NC-ND license Peer-review under responsibility of I-DAS- Institute for the Dissemination of Arts and Science. (http://creativecommons.org/licenses/by-nc-nd/4.0/). Peer-review under responsibility of I-DAS- Institute for the Dissemination of Arts and Science. Keywords: new product development; mobile robot; vending machine; multivariate statistics; market segmentation
1. Introduction The construction of beach establishments that can serve food is prohibited in many parts of the world. In these locations, the only option available for visitors is to buy from travelling vendors, who lack the appropriate tools to supply the right products in the best conditions and at the right time (Timothy & Wall, 1997). Moreover, as they have to carry the products themselves, the vendors are limited to offering only a small number of food items. In these circumstances, visitors can become disappointed with the lack of food distribution services. This limitation can be overcome with the use of vending machines, which allow food products that might be refrigerated to be bought in an automatic fashion in unattended locations and with no time restrictions, as long as the instructions on how to operate the machine are understood by the user (Horne et al., 1992). However, the great majority of vending machines are fixed and dependent on an energy source, usually obtained through a power outlet, which makes them unsuitable for mobile vending.
* Corresponding author. Tel.: +351-218 417 981; Fax: +351- 218 499 242. E-mail address:
[email protected]
1877-0428 © 2015 The Authors. Published by Elsevier Ltd. This is an open access article under the CC BY-NC-ND license (http://creativecommons.org/licenses/by-nc-nd/4.0/).
Peer-review under responsibility of I-DAS- Institute for the Dissemination of Arts and Science. doi:10.1016/j.sbspro.2015.01.1182
André S.P.H. Navarro et al. / Procedia - Social and Behavioral Sciences 175 (2015) 122 – 129
123
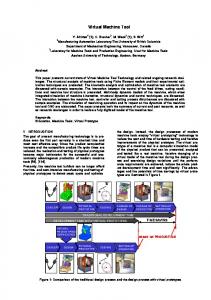
The main purpose of this paper is to illustrate how one can use the perceptions of potential customers and multivariate statistical techniques to support the development of a new autonomous mobile robot vending machine, which is energetically independent, to distribute food products on beaches. The specific objectives of the present research are (1) to determine the initial product assortment to be carried by the robot, (2) to uncover the respondents’ preference dimensions for a range of design characteristics of the robot and (3) to find market segments based on these preference dimensions, which can be used to guide the further development of this new means of distribution in food retail. 2. Literature review The literature acknowledges the importance of involving the customer from the very initial steps of the product development process. Kleef et al. (2005) considered the integration of the ‘voice of the consumer’ early in the new product development process to be a critical success factor in new product development. Hoven (2011) stated that the best way to develop successful new products is to involve the potential customers in the early stages of their creation. An important aspect of consumer involvement in the new product development process is the identification of the consumer’s needs and his or her preferences towards the design characteristics of the new product or service. The methods of gathering consumer needs and preferences can be classified into compositional and decompositional methods – additional details on these can be found in Monteiro et al. (2010). Due to the methodological approach taken in this research, where respondents were asked to directly rate the importance of each design attribute of the new product, compositional methods were used. In the convenience retail sector, Krafft and Mantrala (2010) have stated that only innovators who adopt new technologies to create unique buying experiences for their customers will thrive in the European market. This lends support to the present research concerning the development of a new vending machine for food distribution that takes into consideration the opinions of consumers. To the best of the authors’ knowledge, there is no energetically independent autonomous mobile robot vending machine like the one described in this paper presently being developed. There are, however, some robot implementations that get close to some of the concepts defined for this robot. The Heineken robot (Barlow et al., 2010) is able to move through a preestablished route, stopping only when it detects the hovering hand of a person; then, the robot waits for a glass to be deposited in its cup holder, fills it with beer and waits for the glass to be retrieved. HelpMate (Krishnamurthy & Evans, 1992) is a robot designed to transport meals in a hospital. Extra care has been taken with its compartment’s design, in order to control the inside temperature and subsequently diminish the probability of food contamination. I-Merc (Carreira et al., 2006) is a concept robot for delivering meals in hospital that follows a similar design approach to the one developed in this work. Minerva (Thrun et. al. 1999) is a mobile robot designed to educate and entertain people in public places, which specifically addresses issues such as safe navigation in unmodified and dynamic environments, and short-term human–robot interaction. A relatively similar navigation approach was developed by Carreira et al. (2012, 2014). SnackBot (Lee et al., 2009) is able to operate on a university campus carrying snacks to people, while avoiding obstacles. The Cool Robot, designed for polar science campaigns (Lever and Ray, 2008), and the Hyperion or the more recent Zoë, designed to explore the Atacama Desert (Wettergreen et al., 2005), are some examples of robots that use solar energy to recharge their batteries. However none of these robots is able to fulfil all the features proposed for this robot; namely, the ability to move on a sandy pavement, interact with humans, collect money from transactions, keep food refrigerated and be energetically autonomous. The subject of assortment planning is very important in the design of a vending machine due to the significant space constraints for the storage of products. An optimal and generalized assortment solution has still to be created. In fact, most of the existing models were not tested in a real environment, or were only tested in large general stores using records of the sales and costs of the inventory – information that is not available for business start-ups (Brijs, 2002; Vaidyanathan, 2011). Lin et al. (2011) are the only researchers found in the literature to have addressed the product assortment problem of a new vending machine. Their study indicates that the initial product assortment should take into consideration the sales of other vending machines located nearby, and that the most differentiated bestselling products should be chosen. However, the solution suggested by Lin et al. (2011) only takes into account the products supplied by competitors, in case they are available. The present research will add to the study by Lin et al. (2011) since it will also use the preferences of the consumers to determine the initial product assortment to be carried by the robot vending machine. 3. Methodology An online questionnaire was used in order to achieve the research objectives; namely, to determine the initial product assortment to be carried by the robot, to ascertain the respondents’ preference dimensions towards a range of design characteristics of the robot and to find market segments based on these preference dimensions. The approach taken in this research was to initially develop a 3D virtual prototype of the energetically independent autonomous mobile robot vending machine to test how respondents would react to this new concept, in this way obtaining additional feedback for its further development. At the beginning of the questionnaire four perspectives on the new robot concept are shown – see Fig. 1. The population of interest are residents in Portugal who purchase food products when they go to the beach. Respondents were selected using a snowball sampling procedure, where the Facebook social network was used to invite additional respondents to
124
André S.P.H. Navarro et al. / Procedia - Social and Behavioral Sciences 175 (2015) 122 – 129
fill in the questionnaire. In total, 712 valid questionnaires were gathered. The questionnaires were distributed online during November and December 2012. The questionnaire is divided into four sections. The first section asks about the consumers’ buying habits when they go to the beach; the second section taps into consumers’ preferences for a range of food products in general and those bought from the robot; the third section captures the consumers' preferences for fifteen design characteristics of the robot – on a five-point importance scale, from 1 – not important at all to 5 – very important; while the fourth section focuses on demographic information. To support the design of the questionnaire, initial exploratory research involving in-depth face-to-face semistructured interviews with 13 bathers and six managers of beach establishments was carried during Summer 2012 in Lisbon’s metropolitan area beaches of São João, Castelo, Rei, Nova Vaga, Carcavelos and Guincho; in addition, five travelling vendors were observed. The questionnaire was pre-tested on a small convenience sample during October 2012, and the minor problems
found with the format and some of the questions were resolved before the actual data collection (Malhotra, 2006). Fig. 1. Perspectives on the autonomous mobile robot vending machine concept.
Data was computed using the IBM SPSS Statistics software. Besides descriptive statistics, to describe the characteristics of the respondents and their preferences concerning the product assortment to be carried by the robot, factor and cluster analyses were performed. Factor analysis was applied to respondents’ preferences towards a range of design characteristics of the robot in order to uncover the main importance dimensions used by respondents when they assessed the robot design variables. The principal components extraction method was chosen because it does not imply any assumption about the distribution of the original data and is one of the most utilized multivariate methods for data reduction in marketing research (Del Campo et al., 2008; DeSarbo et al., 2007). Varimax rotation was selected since this technique has the ability to improve the interpretation of the factor solution and create uncorrelated factors, which are then used in cluster analysis (Hair et al., 2010). Cluster analysis was applied to the derived factors’ scores in order to find segments of respondents that differed in terms of their preferences towards the design characteristics of the robot. Following the recommendations of Milligan and Cooper (1985), the Ward’s method, with the squared Euclidean measure, was used to build the clusters. To determine the number of clusters, which were further profiled and analysed, the dendrogram and the variance ratio criterion (VRC) of Caliński and Harabasz (1974) were used.
4. Analysis and results 4.1. Descriptive statistics The sample was composed mainly of females (59%), young people (65% aged between 15 and 24 years old), and people living in the region of Lisboa and Vale do Tejo (82%) who frequently went to the beaches of the Lisboa and Vale do Tejo, and Algarve (38% and 36% of the sample, respectively). Respondents in sample were also highly educated – 43% had a degree and 94% had at least completed high school; they were mainly students (60%) and they went to the beach unaccompanied by children (62%). The majority (56%) preferred to buy food products from beach establishments instead of travelling vendors (38%) and
André S.P.H. Navarro et al. / Procedia - Social and Behavioral Sciences 175 (2015) 122 – 129
most (70%) spent more than €2/day on these products. The willingness of the respondents to pay for the food products from the robot was measured against beach establishments and travelling vendors. Only about 10% of the respondents agreed with paying more for products bought from the robot; on the other hand, the general opinion was very encouraging, since 93% of the sample indicated that they would like to try and buy food products from the robot. For respondents, the most consumed food categories at the beach are water, sandwiches and ice-creams (72%, 59% and 54%, respectively). However, when they were asked about which food items they would prefer buying from the robot, the categories most often chosen were water, ice-creams and sodas at 62%, 55% and 42%, respectively, while sandwiches were mentioned by 38% of the respondents. All the 15 design characteristics of the robot showed average values above 3.5. The most valued characteristics were “V4 – the robot keeps products fresh and refrigerated”, “V5 – the robot is easy to use”, “V3 – the robot uses sun and wind as energy resources”, and “V6 – the purchase from the robot is quickly made”, with average values of 4.90, 4.69, 4.42 and 4.41, respectively (see Table 1). Table 1. Average values for the design attributes of the robot Design attributes
Average
V4 – the robot keeps products fresh and refrigerated
4.90
V5 – the robot is easy to use
4.69
V3 – the robot uses sun and wind as energy resources
4.42
V6 – the purchase from the robot is quickly made
4.41
V2 – the robot moves close to the bathers
4.15
V8 – the robot provides healthy food
4.04
V12 – the robot has an ice dispenser
4.03
V7 – the robot sells a wide variety of products
3.93
V14 – the location of the robot is available by SMS
3.87
V1 – the robot design is appealing
3.86
V15 – the customer suggests favourite products through a website
3.83
V11 – the robot is an autonomous guided vehicle
3.76
V9 – the robot’s menu is large enough to be visible at a reasonable distance
3.63
V10 – the transaction runs autonomously without human intervention
3.61
V13 - the robot has a bell to warn customers about its presence nearby
3.57
4.2. Determining the Initial Product Assortment To select the products to be offered by the robot a table was created with the absolute frequency a product was selected by respondents to be part of the robot´s product assortment, for each of the seven most preferred food categories to be carried by the robot (see Table 2). To be included in the final product assortment list, each category leader was chosen as well as all products with an absolute frequency of over 40. Moreover, decisions were made not to offer ice-cream products, since these would increase the energy needs of the robot and would require a separate compartment, or alcoholic beverages, due to legal reasons. The resultant assortment list includes nine products representing seven food categories: Luso mineral water, Coca-Cola Classic, tuna sandwiches and chicken sandwiches, grapes, natural orange juice, “bola-de-Berlim” with cream and “bola-de-Berlim” without cream (cakes), and chicken salad. Table 2. Most preferred food products to be offered by the robot Category
Category quota
Product
Product's Absolute Frequency
Waters
62%
Luso mineral water
439
Sodas
42%
Coca-Cola Classic
134
Lipton’s Ice Tea lemon
34
Sandwiches
38%
Coca-Cola Zero
32
Tuna sandwiches
79
Chicken sandwiches
46
125
126
André S.P.H. Navarro et al. / Procedia - Social and Behavioral Sciences 175 (2015) 122 – 129
Fruits
23%
Ham and cheese sandwiches
32
Grapes
31
Apple
31
Peach
27
Natural Fruit juices
21%
Orange juice
48
Cakes and candies
17%
Bola-de-Berlim with cream
72
Bola-de-Berlim without cream
49
Chicken salad
49
Salads
15%
4.3. Factor analysis to uncover the main important dimensions used to assess the robot design variables To uncover the main importance dimensions respondents used when they assessed the robot design variables, factor analysis was applied to all the 15 design variables of the robot, except variable “V12 – the robot has an ice dispenser”. This variable was excluded from the analysis since the energy necessary to produce ice would greatly affect the robot´s autonomy. A visual examination of the correlation matrix reveals a considerable degree of correlation of the data with all but four variables having at least one correlation coefficient greater than 0.3, although the four variables found to have the lowest correlation coefficients showed values close enough to this threshold. Also, of the 196 correlations, only 18 were non-significant at the 0.05 level. The KMO measure, with a value of 0.729, is classified as “median” (Kaiser & Rice, 1974), and Bartlett’s test presented an associated probability lower than 0.05, meaning that the factor analysis can be performed on these variables. The main importance dimensions were extracted with the principal components method, followed by a Varimax rotation. The decision on the number of factors to retain was based on the eigenvalue and on the scree-plot criteria (Hair et al., 2010). The first five factors showed eigenvalues greater than 1. However, the scree-plot also suggested the extraction of four or six factors. All of the above solutions were analysed but have provided unsatisfactory factor structures. A good factor structure was found when seven factors were extracted; all the communalities found showed values between 0.62 and 0.85, the variance explained was 74% of the total variance of the original variables, and the factor structure was easily interpreted (see Table 3). Based on the loadings of the original variables on the various factors, the names chosen for factors 1 to 7 were “Convenience”, “Menu”, “Automation”, “Distant Interaction”, “Aesthetics and Proximity”, “Sustainability” and “Sound Warning”, respectively Table 3 – Seven-factor solution obtained with the principal components method and Varimax rotation Component 1
2
3
4
Communalities 5
6
7
Extraction
V5 – the robot is easy to use
0.822
0.739
V6 – the purchase from the robot is quickly made
0.729
0.644
V4 – the robot keeps products fresh and refrigerated
0.723
0.795
V7 – the robot sells a wide variety of products
0.799
V8 – the robot provides healthy food V9 – the robot’s menu is large enough to be visible at a reasonable distance V10 – the transaction runs autonomously without human intervention
0.724
V11 – the robot is an autonomous guided vehicle V15 – the customer suggests favourite products through a website V14 – the location of the robot is available by SMS
0.695 0.411
0.677
0.718 0.878
0.689
0.837
0.705 0.847
0.620
0.838
0.804
V1 – the robot design is appealing
0.828
V2 – the robot moves close to the bathers
0.739
V3 – the robot uses sun and wind as energy resources V13 – the robot has a bell to warn customers about its presence nearby
0.738
0.786 0.853 0.858
0.781 0.881
0.786
André S.P.H. Navarro et al. / Procedia - Social and Behavioral Sciences 175 (2015) 122 – 129
4.4. Finding market segments with cluster analysis To find segments of respondents cluster analysis, with the Ward’s method and the squared Euclidean measure, was applied to their scores on the seven factors found with factor analysis. Clustering the factor scores obtained with the Varimax rotation, instead of using the original variables, allows groups of respondents to be created on the basis of uncorrelated evaluative dimensions. The nearest neighbour method was first run to detect outliers and, as a result, 702 respondents were subjected to the cluster analysis. The observation of the dendrogram indicated both a five or seven cluster solution as good cluster choices. To help decide on the final number of clusters, the Variance Ratio Criterion index was used, which and pointed towards the 5-cluster solution. Each cluster was then profiled, using the average values of the factors and the averages of the other variables not used to form the clusters, and this information was taken into account in to labelling each cluster. Table 4 shows the averages of the seven factor scores for each of the five clusters; for each factor, the lowest average value is in italics, whereas the highest average value is shown in bold. Table 4. Averages of the seven factor scores for each of the five clusters
C1
F1
F2
0.30
0.12
F3
F4
−0.38 −0.74
F5
F6
F7
0.46
−0.96
0.20
C2 −2.53
0.11
0.37
0.06
−0.52 −1.06 −0.37
C3
0.08
0.25
−0.02
0.34
0.07
0.33
0.50
C4
0.33
0.02
−0.33
0.36
0.08
0.19
−1.28
C5
0.31
−0.90
0.73
−0.70
-0.47
0.23
−0.14
Cluster 1 comprises 103 respondents, corresponding to 15% of the sample. It has the highest average scores on factor “F5 – Aesthetics and Proximity”, while factor “F1 – Convenience” was close to the highest average value. It also has the lowest average values on factor “F3 – Automation” and “F4 – Distant Interaction”, while factor “F6 – Sustainability” was close to the lowest value. Cluster 2 is the smallest cluster; it has 48 respondents, corresponding to 7% of the sample, and has the lowest average factor scores on three factors, namely, “F1 – Convenience”, “F5 – Aesthetics and Proximity” and “F6 – Sustainability”. Cluster 3, which will be further analysed, is the biggest cluster and contains 323 respondents, corresponding to 46% of the sample. It presents the highest average factor scores for three factors, namely, “F2 – Menu”, “F6 – Sustainability” and “F7 – Sound Warning”, while a fourth factor, “F4 – Distant Interaction”, is close to the highest value. In relation to the other variables not used in the clustering procedure, this cluster distinguishes itself by having the largest percentage of female respondents (67.8%) and the lowest percentage of people that would refuse to try buying food products from the robot (6.8%). Cluster 4 contains 120 respondents, corresponding to 17% of the sample. It shows the lowest average value on factor “F7 – Sound Warning”, while the factor “F3 – Automation” is close to the lowest average value, and it also displays the highest average factor scores on factors “F1 – Convenience” and “F4 – Distant Interaction”. Cluster 5 includes 108 respondents, corresponding to 15% of the sample. It is the group with the highest average factor scores on “F3 – Automation”, while factor “F1 – Convenience” is close to the highest value. It also shows the lowest average value on factor “F2 – Menu”, while factors “F4 – Distant Interaction” and “F5 – Aesthetics and Proximity” were close to the lowest figures. 4.5. Using the perceptions and preferences of respondents to guide the further development of the new robot concept This section illustrates how the respondents’ perceptions and preferences can be used to guide the future development of the new robot concept. Cluster 3, which was named the “green supporters”, was selected as the target segment to please because, besides being the biggest cluster, it is the cluster that has the greatest number of highest average factor scores (see factors F2, F6 and F7 in Table 4), meaning that the respondents in this cluster valued many of the design characteristics of the robot. Looking at factor F2 in Table 3, the two design variables with the highest loadings on this factor are “V7 – the robot sells a wide variety of products”, and “V8 – the robot provides healthy food”. Turning to factor F6, the variable with the highest loading on this factor is “V3 – the robot uses sun and wind as energy resources”, whereas on factor F7, the variable with the highest loading on this factor is “V13 – the robot has a bell to warn customers about its presence nearby”. Focusing also on the factor F4, which is close to the highest loading, the two variables with the highest loadings on this factor are “V14 – the location of the robot is available by SMS” and “V15 – the customer suggests favourite products through a website”. The computation of the averages of the original design variables across the five clusters reveals that the highest average values for variables V3, V7, V8, V13 and V14 are obtained for respondents in cluster 3, and that the average value for V15, computed for cluster 3, is very close to the highest value across all clusters. This means that respondents in cluster 3 considered it is highly important that the robot possesses the design characteristics measured by variables V3, V7, V8, V13, V14 and V15. Therefore, in terms of future development, since design variable “V3 – the robot uses sun and wind as energy resources” is highly valued by respondents in this cluster, one may suggest the application of photovoltaic panels to cover the robot’s exterior and the use of biaxial solar trackers. This also supports the use of high performance technologies, or the presence of a wind
127
128
André S.P.H. Navarro et al. / Procedia - Social and Behavioral Sciences 175 (2015) 122 – 129
microturbine, which in fact has little energy recovery capacities. High average scores on design variables V7 and V8 support the inclusion of a wide variety of healthy food products, whereas variables V14 and V15 indicate that the inclusion of the distant interaction design characteristics of the robot are a good bet. Finally, the respondents in cluster 3 wanted the inclusion of a bell to warn customers about the nearby presence of the robot; however, this characteristic was undesired by other segments. 5. Conclusions The paper illustrates how multivariate statistical techniques, namely factor and clusters analyses, can be used to examine the perceptions and preferences of customers and to support the development of a new energetically independent autonomous mobile robot vending machine for food distribution on beaches. Concerning the initial product assortment to be carried by the robot, nine food product items, many of them healthy, were identified; factor analysis identified that the respondents used seven main design dimensions when they assessed the robot, namely “Convenience”, “Menu”, “Automation”, “Distant Interaction”, “Aesthetics and Proximity”, “Sustainability” and “Sound Warning”. Cluster analysis applied to the respondents´ scores on the seven dimensions allowed five clusters of respondents to be found. Using cluster 3, the “green supporters”, as an example of a target segment, shows how this multivariate methodology can be used to guide the future development of the robot concept, with the suggestion that future work should focus on the enhanced use of renewable energies. Acknowledgments This work was supported in part by FCT, through IDMEC, under LAETA Pest-OE/EME/LA0022. References Barlow, C., Lewis, D., Bell, J., Irps, T., Prior, S. D., Erbil, M. A., & Karamanoglu, M. (2010). Developing a low-cost beer dispensing robotic system for the service industry. International Conference on CAD/CAM, Robotics and Factories of the Future, Pretoria. Brijs, T. (2002). Retail market basket analysis: a quantitative modelling approach (PhD Thesis). Limburg University Centre, Belgium. Caliński, T., & Harabasz, J. (1974). A dendrite method for cluster analysis. Communications in Statistics-theory and Methods, 3(1), 1–27. Carreira, F., Calado, J., Cardeira, C., & Oliveira, P. (2014). Enhanced PCA-based localization using depth maps with missing data. Journal of Intelligent & Robotic Systems, Springer, Published Online. Carreira, F., Canas, T., Silva, A., & Cardeira, C. (2006). I-Merc: A mobile robot to deliver meals inside health services. In Proceedings of the IEEE Conference on Robotics, Automation and Mechatronics. 2006. Carreira, F., Christo, C., Valerio, D., Ramalho, M., Cardeira C., Calado, J., & Oliveira, P. (2012). 2D PCA-based localization for mobile robots in unstructured environments. IROS 2012 IEEE/RSJ International Conference on Intelligent Robots and Systems, October 7–12, 2012. Vilamoura, Algarve, Portugal, pp. 3867–3868. Del Campo, C., Monteiro, C. M., & Soares, J. O. (2008). The European regional policy and the socio-economic diversity of European regions: a multivariate analysis. European Journal of Operational Research, 187(2), 600–612. DeSarbo, W., Hausman, R., & Kukitz, J., (2007). Restricted principal components analysis for marketing research. Journal of Modelling in Management, 2 (3), 305–328. Hair Jr, J. F., Anderson, R. E., Babin, B. J., & Black, W. C. (2010). Multivariate data analysis. 7th edition. Upper Saddle River, NJ: Prentice Hall. Horne, A. H., Henderson, R. J., & Anderson, D. C. (1992). Inventory, cash, security, and maintenance control apparatus and method for a plurality of remote vending machines. U.S. Patent No. 5,091,713. Washington, DC: U.S. Patent and Trademark Office. Hoven, M. V. (2011). Fresh on-the-go snacks, a market orientated research. LAP Lambert Academic Publishing. Kaiser, H.F., & Rice, J. (1974). Little Jiffy, Mark IV. Educational and Psychological Measurement, 34, 111–117. Kleef, E., Trijp, H., & Luning, P. (2005). Consumer research in the early stages of new product development: a critical review of methods and techniques. Food Quality and Preference, 16, 181–201. Krafft, M., & Mantrala, M. K. (2010). Retailing in the 21st century: current and future trends. 2nd edition. Springer. Krishnamurthy, B., & Evans, J. (1992). HelpMate: a robotic courier for hospital use. Proceedings of the IEEE International Conference on Systems, Man and Cybernetics. Chicago, October, pp. 1630–1634. Lee, M. K., Forlizzi, J., Rybski, P. E., Crabbe, F., Chung, W., Finkle, J., & Kiesler, S. (2009). The snackbot: documenting the design of a robot for long-term human-robot interaction. Proceedings of the 4th ACM/IEEE International Conference on Human-Robot Interaction (HRI), March, pp. 7–14. Lever, J. H., & Ray, L. E. (2008). Revised solar-power budget for Cool Robot polar science campaigns. Cold Regions Science and Technology, 52(2), 177–190. Lin, F. C., Yu, H. W., Hsu, C. H., & Weng, T. C. (2011). Recommendation system for localized products in vending machines. Expert Systems with Applications, 38(8), 9129–9138. Malhotra, N. K. (2006). Questionnaire design and scale development. In R. Grover & M. Vriens (Eds.), The Handbook of Marketing Research Uses Misuses and Future Advances, pp. 83–94. Thousand Oaks, CA: Sage. Milligan, G. W., & Cooper, M. C. (1985). An examination of procedures for determining the number of clusters in a data set. Psychometrika, 50(2), 159–179. Monteiro, C., Dibb, S., & Almeida, T. (2010). Revealing doctors’ prescribing choice dimensions with multivariate tools: a perceptual mapping approach. European Journal of Operational Research, 201(3), 909–920. Timothy, D. J., & Wall, G. (1997). Selling to tourists: Indonesian street vendors. Annals of Tourism Research, 24(2), 322–340.
André S.P.H. Navarro et al. / Procedia - Social and Behavioral Sciences 175 (2015) 122 – 129 Thrun, S., Bennewitz, M., Burgard, W., Cremers, A. B., Dellaert, F., Fox, D., Hähnel, D., Rosenberg, C., Roy, N., Schulte, J., & Schulz, D. (1999). MINERVA: a second generation mobile tour-guide robot. Proceedings of the IEEE International Conference on Robotics and Automation (ICRA). Detroit, USA. Vaidyanathan, R. (2011). Retail demand management: forecasting, assortment planning and pricing (PhD Thesis). University of Pennsylvania. Wettergreen, D., Cabrol, N., Baskaran, V., Calderón, F., Heys, S., Jonak, D., Lüders, A., Pane, D., Smith, T., Teza, J., Tompkins, P., Villa, D., Williams, C., & Wagner, M. D. (2005). Second experiments in the robotic investigation of life in the Atacama desert of Chile. Proceedings of the 8th International Symposium on Artificial Intelligence, Robotics and Automation in Space. Munich, Germany.
129