A model-based approach for the specification and verification of clinical guidelines Simona Bernardi
Jorge Albareda
Centro Universitario de la Defensa Ctra de Huesca, 50090 Zaragoza, Spain Email:
[email protected]
Orthopaedic Surgery department University Hospital ”Lozano Blesa” San Juan Bosco 15, 50009 Zaragoza, Spain Email:
[email protected]
Jos´e-Manuel Colom
Cristian Mahulea
Dept. of Computer Science and Systems Engineering, University of Zaragoza Maria de Luna 1, 50018 Zaragoza Email:
[email protected]
Dept. of Computer Science and Systems Engineering, University of Zaragoza Maria de Luna 1, 50018 Zaragoza Email:
[email protected]
Abstract—This paper presents a modeling methodology for clinical guidelines used in hospitals. The clinical guidelines are assumed to be given in a graphical form in a structure obtained by combining few elements. It is shown how the clinical guidelines represented with this syntax can be automatically converted into a mathematical model represented as Petri nets. The main advantage of the new model is the inclusion of resources and patient flow in the same model which makes possible its use in analysis and verification of the guidelines. Moreover, if different clinical guidelines in a hospital or department in a hospital are considered, the models can be used for resource optimization and performance evaluation. The clinical guideline of hip fracture from the ”Lozano Blesa” University hospital in Zaragoza is taken as an example.
I. I NTRODUCTION Public healthcare system is managed by national or local governments, who define the purpose and targets of the service together with policies and financial resources. However, because of the complexity of understanding, planning and controlling the system behavior, governments struggle to make good short-term and long-term decisions. This struggle is the same all through the management hierarchy, down to the daily work with patients. This means that the implementation of new legislation is often expensive, can have a long delay and is prone to fail. In the recent scientific literature, healthcare systems constitute an important research topic given their crucial role in the welfare and prosperity of societies. The literature on these systems is huge and is continuously expanding. As reported in [4], about 30 new articles per day are written on simulation and modeling in healthcare systems. The Research Into Global Healthcare Tool (RIGHT) project (www.right.org.uk) perceived that there is an overwhelming demand for modeling and simulation tools in the healthcare community, whilst there is a sizeable body of knowledge amongst the modeling community, yet there is a clear gap between what is needed
and what is on offer. Bridging such a gap between the two communities will require a great deal of effort in trying to identify main linkages and successfully setting them up. Simulation techniques have mainly been used in the literature for the analysis of healthcare systems. Amongst these techniques, the most frequent modeling methodologies are discrete event simulation [5], [10], [6], [11] and system dynamics [7], [1]. Being mainly simulation approaches, these techniques for studying a given property are specific to the given model, and it is difficult to extend them to general systems. On the other hand, one of the most frequently used approaches for modeling complex information systems is business process modeling (BPM). Several standard modeling languages exists for this purpose, such as the Unified Modeling Language (UML) [16] and the Business Process Model and Notation (BPMN) [14] both managed by the Obiect Management Group (OMG). A business process model reflects the behavior of a complex process in terms of the involved participants, the causality/concurrence/conflict of the activities carried out by the formers as well as the data flow generated by the process. Such model is then used for performing simulation experiments and implementing analysis methods to better understand the effects of running that process. When trying to model healthcare behavior using a number of workflow tools, the authors of [13] observed that these tools’ inability to describe flexibility made it difficult to apply them in practice. In this paper we will develop a new modeling methodology for describing healthcare systems, in particular for the management and planning of hospitals. The main idea of the approach is to model different clinical guidelines (or care plans) existing in a hospital for different medical problems. These guidelines can be defined by the interaction among activities (treatments and cares), resources (medical and paramedical staff, management), and requirements from the stakeholders. Available modeling methods cannot fully
2014 IEEE Emerging Technology and Factory Automation (ETFA)
c 2014 IEEE 978-1-4799-4845-1/14/$31.00
handle the complex and often-changing activity interactions found in healthcare systems. In this paper we start from clinical guidelines defined using UML activity diagram basic elements that are easy to understand for the medical doctors. We enrich the UML activity diagram semantics with UML annotations to specify the resource and workload requirements in the health domain. The UML annotations consist of taggedvalues associated to model elements of UML activity diagrams (e.g., actions, transitions) which are compliant with the OMG standard UML profile MARTE [15]. Transformation patterns from UML basic elements to Petri Nets are then provided in order to get a formal model of the clinical guideline which is amenable to be analyzed for the correctness verification and performance evaluation purposes. We show that by using the transformation patterns we can obtain Petri net models similar with the ones used in Resource Allocation Systems for modeling manufacturing systems. The formal Petri net model can be used for qualitative and quantitative analysis by applying the already existing methods and algorithms. In order to illustrate the methodology we used the clinical guideline for hip fracture in elderly patients developed by the doctors of the University Hospital ”Lozano Blesa” in Zaragoza. This kind of fracture is a problem in all orthopaedic hospital services because of its progressive frequency, its high morbidity and the high hospitalization costs. Today the orthopaedic department of the ”Lozano Blesa” hospital treats around 470 patients a year, representing 30% of all urgent hospitalizations and 49% of hospital stays. There is an average surgical delay of three days after admission and mortality in the first week of 9%. These indices are similar to those of other hospitals. The models presented in this paper could give a mathematical approach to improve the surgical delay by reducing the pre-surgery stay to less than two days. The resulting shorter hospital stay will significantly reduce the economic costs of the treatment process. II. H EALTHCARE PROBLEM DOMAIN Clinical guidelines are systematically developed statements designed to help practitioners and patients decide on appropriate healthcare for specific clinical conditions and/or circumstances. They are developed by groups of medical staff (usually doctors and nurses) and should provide information on the benefits and limitations of different diagnostic and therapeutic intervention so that the doctors could evaluate individual cases. Guidelines can be used in a wide range of settings to promote effective and efficient healthcare. For example, to guide the introduction of new procedures or services, promote effective healthcare in primary or secondary care settings, encourage the adoption of cost-effective interventions and improve the timing and processes of the discharge of patients. If guidelines are to achieve their potential, they should have adequate and enough resources. Therefore, the correct assignment of resources could have benefits on the implementations of these guidelines. However, the correct assignment and release of resources cannot be verified without a mathematical
model. In the last years, we have seen that the medical doctors are starting to be more interested in costs and resources needed for each part of their job (cost of necessary/unnecessary tests, cost of treatments, alternatives that can be used with the same efficiency). There is evident that a correct use of resources will improve the efficiency and effectiveness of the hospital. It is clear that these cannot be done without the use of special tools. Over the last years, there have been attempts at developing languages and tools to handle information in the healthcare system. One such tool suite is the PHI Technology [19] developed by the ITAL TBS group, which is based on a Reference Information Model (PHI RIM) derived from the international standard HL7 RIM. Another tool used for healthcare applications is ProM [18], developed by TU/e, which uses business process models. The MedModel tool [9] can be used for healthcare simulations in order to optimize the structure and the dynamics of emergency departments, operating suites, nursing units and ambulatory patient care. In order to represent clinical guidelines, different modeling language have been proposed, e.g., guideline interchange format (GLIF) [3] or guideline elements model [2], for decision support systems. These models have friendly interfaces for the doctors and mainly can be used to simulate the system under different scenarios. The main drawback of these models is that they do not incorporate explicitly the resources being targeted only on the flow of patients. This paper aims to propose a modeling language that will be used for mathematical analysis and verification of the guidelines in which the resources and activities are presented in the model. We will start with a high-level graphical language, i.e., UML activity diagrams enriched with annotations in which the doctors could represent a guideline and our purpose is to obtain a mathematical model in form of a Petri net. We will give a set of patterns to transform the annotated activity diagrams to a Petri net and we will show how the formal model can be used for the specification and verification of clinical guidelines. It is worth to notice that some of the transformation patterns presented in this paper actually do not differ from UML activity diagrams to Petri Net translation methods already proposed in the literature (see for example [12]). However, the novelty of the proposed approach is the interpretation of the modeling elements in the health domain context. A. UML background The Unified Modeling Language (UML) [17] is a well known general purpose standardized modelling language for software system specification. UML is also equipped with a profiling mechanism that allows to customize UML for a particular domain or platform. Stereotypes, tags and constraints are the extension mechanisms used to define a UML profile. A stereotype extends one or more UML meta-classes and can be applied to those UML model elements that are instantiations of the extended meta-classes. Just like classes, a stereotype can have properties which are referred as tags:
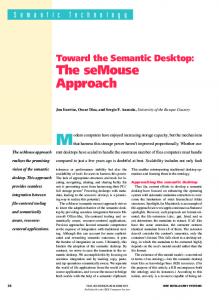
when a stereotype is applied to a model element, the value assigned to a stereotype property is called tagged-value. In this work, we have used extensions defined in the OMGstandard MARTE profile [15] to specify acquisition/release of resources and the initial workload. Although MARTE does not address the healthcare domain, we decided to reuse the same tags since they represent similar concepts in different domains. For example, in Figure 2, the initial transition leading to Evaluate before hospitalization action is stereotyped gaAcqStep to specify the kind and the number of resources (acqRes and resUnits, respectively) acquired to carry out the subsequent actions1 . III. P ETRI N ET MODEL - BASED APPROACH Petri Nets are formal models used to describe Discrete Event Systems (DES) using two basic concepts: state and transition. A state define a configuration of the described system by means of a set of variables, whose values define the current configuration of the system. A transition defines the change from a state to another state based on the changes produced in some variables defining the state. In Petri Nets, the state variables are named places and the values that can be assigned are only natural numbers. The value of a place is named the marking of the place. Graphically, places are represented by circles and the marking of a place by a set of black tokens inside the circle. Transitions are represented by rectangles, and the change of state requires the removing from a set of places (named input places) a number of tokens specified by means of numeric labels in the arcs from the places to the transition (precondition for the occurrence of the transition, i.e. for the change of state). After the satisfaction of the precondition, the occurrence of the transition proceeds in an atomic way by the removing of the tokens from the input places, and the addition of the tokens to the output places in a prefixed quantity specified in the numeric labels of the arcs from the transition to the output places. With these elementary objects many different kinds of systems can be modeled. Nevertheless, the construction of these models requires to define a priori two important methodological issues to obtain operative models for healthcare systems. • The methodological approach discussed throughout this paper is based on obtaining manageable Petri Nets from the observation of real-world systems. To this end, we will discard those irrelevant details for the properties to be studied, while preserving those relevant aspects. Such process is known as the process of abstraction. • The basic objects used in the construction of the models will have a specific meaning in terms of the application domain, that in our case is the domain of clinical guidelines. This meaning is important in order to make the abstraction process from the real-world to the model, but also is very important in order to interpret the conclusions obtained from the model in terms of the system modeled. 1 For readability reasons, the stereotypes are not explicitly shown and the tagged-values are specified as note symbols attached to the stereotyped elements.
In the context of this paper, the meaning of places and transitions will be the following. Places will be used to represent three different classes of information of a clinical guideline allowing to characterize the state of the overall healthcare system being modeled. The first group of places, named clinical state places or process places will be associated to a clinical situation in which a patient can be found when he/she is following a clinical guideline in the hospital. The marking of a place of this type will represent the number of patients that are in this clinical situation associated to the place. The second group of places represent types of resources of the healthcare system needed to realize the different clinical tasks over a patient. The marking of a place of this type will represent the number of available copies of kind of resource represented by this place. Observe that in this paper, resources can represent items needed to realize a task but also can represent space available to realize the task itself. Finally, a third group of places represent communications or signalling channels between different parts of the healhtcare system that is modeled. The marking of these places will represent the number of messages or sent signals that has been produced by the sender and that they are pending to be consumed. Transitions will represent the change of clinical situation of a patient identified by a token. A transition moves the patient from the unique input clinical state place to the unique output clinical state place both connected to the transition. Additionally, the transition can have connected: (1) input resource places representing the allocation of some copies of the type of resource represented by the resource place, or; (2) output resource places representing the release of some copies of the type of resource represented by the place, or; (3) input communication places representing the consumption of a message or signal or authorization sent from other part of the system, or; (4) output communication places representing the production of a message or signal or authorization for other part of the system. This meaning of the the elementary objects represents a kind of abstraction of the clinical guidelines that is oriented to the study of the flow of patients following the guideline and using a set of available resources. This allows to construct modular models following this kind of abstraction. In this case a module is composed by all clinical state places and transitions that are connected between them. The module will be a state machine (automata-like net) representing the different paths that one patient can follow in a clinical guideline from the admission state to the discharge state of the patient. The interaction between these modules is realized through two different mechanisms: (1) The competition between modules for a set of shared resources and whose number is limited. This means that the shared resource will be represented by a resource place that is connected to transitions of both modules (2) The passage of messages between modules through the communication channels. This means that the communication channel will be represented by means of a communication place from the producer module to the consumer module. After the construction of the model the following step in
Number of resources: Doctor=3
infections?
Doctor yes
3
infections? no
yes
no
(a) Resource (personnel, equipment,etc) (d) Protocol control flow: alternative step
protocol start population=N
protocol start N
2 acqDoctor
(b) Workload (n. of patients, etc)
acqRes=Doctor resUnits=2
..... task
task
info/ object
Doctor
.... relRes=Doctor resUnits=2
(c) Protocol control flow: task step
task A
3
relDoctor 2
(e) Use of resources (acquisition,release)
task A
task B
task B
info/object (f) Information/object exchange
Fig. 1.
PN patterns modeling clinical guidelines concepts.
the proposed methodology is the analysis and verification of the model. To do that we can distinguish different stages in this task. •
•
The first stage determines if the model is well-structured. At this level it is necessary to study if the model has good properties from the point of view of the structure. Anomalies at the structural level represent sufficient conditions for the appearing of bad behaviors. For example, we must determine if the resources are used in a conservative way, that is, if the number of copies of a given type of resource is an invariant for all possible execution of the system and from different scenarios defined by the workload of patients and the available resources to manage the workload. This property can be analyzed searching for structural invariants of the Petri Net containing the resource under study (this can be done computing the so called p-semiflows of the Petri Net containing the resource place). Other analysis that must be realized, for example, is to determine if here exist absorbing or generating circuits of communication channels that represent sufficient conditions for deadlock the system or for overflow the capacity of the channel. Finally, another example is to verify that the subnets composed by the clinical state places and the connected transitions is a forest of state machines. The second stage starts after a well-formed model has been obtained. At this level the goal is to understand the functioning of the clinical guideline in order to design the scenarios to be considered in the formal verification
•
process. In this context the main tool to be used are based on the emulation or controlled simulation of the Petri net under different initial markings. The final result is to capture the properties of the system to be studied in Petri nets terms and the set of scenarios (mainly defined through the set of initial markings to be considered) of analysis of the system. The third stage is the formal verification of the property formulated on the Petri Net. In the general case, we must use standard model checking techniques based on the state space of the Petri Net (if it is finite) and the expression of the property in a temporal logic. The result of the model checker can be positive, informing that the property is fulfilled by the model, or can be negative, and in this last case the model checker gives counterexamples of the property that can aid to the designer to fix the problem. In order to fix the problem, is very important the interpretation of the Petri Net objects in terms of the healthcare system. For example, if we are trying to verify that the guideline is deadlock-free (there is no a state where a set of patients cannot be never discharged in the future because they need resources to progress in the guideline that are not available and are allocated by the patients in the same set) and the answer is negative, the counterexamples are sequences of occurrence of transitions leading to the deadlock state because the sharing of resources. Therefore, to fix the problem we must extract from the counterexamples the set constraints in the allocation of resources forbidding these sequences.
This way of verification can be very expensive from the computational point of view because the state space is involved. For this reason, can be very interesting to have theoretical results allowing a verification without the state space and using only structural information of the net plus the initial marking considered just as a parameter in the decision procedure. Unfortunately, these kind of results are only available for constrained subclasses of Petri nets, and in order to be used we must enforce the construction of models belonging to these restricted classes of nets. • Last but not least, if we add a timed interpretation to the model then we can apply a timed analysis of the model. In this case the timed interpretation is associated to the transitions of the net representing the duration of a task that is executed during the firing of the transition. The kind of analysis here is oriented to determine bottlenecks in the system, service times of the different activities or tasks, waiting queues for a given service or treatment, throughput of the clinical guideline, and so on. After this general statement, the following sections present an actual case that illustrates the proposed methodology based on the use of Petri nets. IV. T HE CASE STUDY The Figure 2 illustrates the clinical guideline used for hip fracture in University Hospital “Losano Blesa” of Zaragoza. This guideline includes all the tasks to be accomplished during the day of hospitalization (left side of the figure) and the postoperative day in the hospital (right side of the figure). Between the two parts, there is the day-D of the surgical intervention. The yellow annotations are added to specify the type and total number of resources (both material and personnel) required to carry out the guideline (Number of resources annotation), the patient workload (population), the acquisition/release of resource type and quantity (actRes,relRes and resUnits). By following the guideline, from the pre-operative day to the post-operative day, it is easy to calculate the time that one patient needs to be hospitalized for the surgical intervention (for hip fracture). As Figure 2 (left part) shows, a prerequisite to perform the guideline for a given patient is the availability of a bed (material resource) that will be assigned to the patient during the hospitalization stay. The first three tasks are carried out by a nurse (personnel resource) and consist in monitoring the health state of the patient waiting for the surgery. In particular, the nurse has to determine if the patient has new pathologies or not. If so, they should be evaluated before in order to determine the operability of patient. If there are no pathologies or they are compatible with the intervention for hip fracture and controlled, the next task performed by the nurse is to check the presence of urinary infections in the previous 4-6 weeks before hospitalization. If infections are detected, then a medical doctor does an urgent pre-operative study of the patient; which can include anamnesis, physical exam and analytical tests (e.g., urine
exam). If there is no evidence of previous urinary infection, the next tasks, carried out by a nurse, are first to determine whether the patient is included in the auto-transfusion program and, then, ask for the reserved blood units from the Blood Bank of the hospital. In case that the patient is not included in the autotransfusion program, the nurse has to start the treatment with Venofer 200 mg intravenous: he/she writes down a reminder for the second dosis that will by supplied in the post-operative day. Then, a medical doctor is in charge of providing antibiotic prophylaxis and antithrombotic prophylaxis with HBPM (Low molecular weight heparin) as well as to mark the region to be operated with a permanent marker. Finally, the last task to be performed by a nurse in the pre-operative day is to check that the patient has had a bath in the previous 6 hours before the surgery. The day-D of surgical intervention requires three medical doctors. The second part of the guideline is the post-operative day (Figure 2 - right part). Our patient has been operated and now he is recuperating in the hospital bed that was assigned to her/him the day of hospitalization. The tasks in the second part of the guideline are all performed sequentially by a nurse: checking analytical controls, moving urinary catheter and all drainage away, checking the accomplishment of the chemoprophylaxis protocol, administrating oxygen in nasal pipe for 24 hours, mobilization of the patient, asking for a control X-ray. In the case that the patient was no suitable for auto-transfusion, the nurse provides the second dosis of Venofer 200 mg intravenous. a) Construction of a PN model: The Petri Net (PN) model of the clinical guideline of Figure 2 has been obtained by applying the patterns of Figure 1. The resulting PN model is shown in Figure 3: the PN subnets enclosed in the dotted rectangles correspond to the two parts of the guideline, while the places outside the rectangles represent the initial available resources, i.e., 100 beds, 5 nurses and 3 medical doctors (cf. PN pattern in Figure 1-a). PN transitions, depicted as thin black bars, represent resource acquisition/ release (cf. PN pattern in Figure 1-e) or the alternative steps (cf. PN pattern in Figure 1-d); the remainder, depicted as thick white bars, model tasks (cf. PN pattern in Figure 1-c). There is only one information exchange example in the guideline that concerns the reminder of the second dosis of Venofer: the place VENOFER dosis represents the mailbox containing such information (cf. PN pattern in Figure 1-f). Observe that the PN model is parametric with respect to the initial marking (place start): indeed, the number of patients specified in Figure 2 is a parameter, i.e., N (cf. PN pattern in Figure 1-b). b) Analysis: The PN model of Figure 3 has been used, first, to verify the correctness of the clinical guideline and, then, to evaluate the performance with the GreatSPN tool [8]. In particular, the qualitative analysis has been carried out using state-based techniques (i.e., through the generation of the reachability graph) while simulation based techniques have been used for the performance analysis. We have set the initial number of patients to N = 7 and computed the state space
Fig. 2.
Hip fracture clinical guideline.
of the model2 . The resulting reachability graph consists of 3, 027, 527 states, there aren’t deadlocks, all the transitions are live and the initial marking is an home state. The boundedness of the state space guarantees that a limited amount of information is generated in the place VENOFER dosis. On the other hand the PN model is deadlock-free, so there are no blocking actions related to the acquisition/release of resources. The liveness of the transitions guarantees the possibility of executing all the tasks specified in the clinical guideline. Finally, the home state is concerned with the recoverability of the PN model, that guarantees the correct completion of the clinical guideline for all the patients. The PN model has been then enriched with timing and probabilistic parameters to carry out the performance analysis. Table IV-0b summarizes the parameters setting: mean durations have been associated to the transitions modeling tasks and probabilities have been assigned to transitions representing alternative steps. 2 N = 7 has been the maximum number of patients for which we were able to compute the state space with the GreatSPN tool. However, given the initial number of resources, it is a reasonable value for the purpose of the analysis since for N > 7 the considered properties still hold.
The purpose of the performance analysis is to provide a support for the resource planning in order to guarantee the required patient sojourn times, that for the case study should be maximum 3 days (i.e., the pre-operative day, the day of the surgical intervention and the post-operative day). To this aim, we compute the mean time to accomplish the clinical guideline for a patient by considering different patient workload assumptions (N ∈ [1, 100]). Such a metric corresponds to the cycle time of the PN model T = NX−#start , where acqBed N is the patient workload, #start is the mean number of tokens in place start and XacqBed is the throughput of the transition acqBed. We use the GreatSPN simulator (accuracy 3%, confidence level 90%) to perform sensitivity analysis. The blue curve in Figure 4 plots the mean time vs/ the number of patients considering the initial resource assumptions (i.e., 100 beds, 3 doctors and 5 nurses): the curve slope indicates that the number of personnel is clearly not sufficient to assist the patients (with 40 patients, the computed mean time is about 4 days). In particular, the doctors are busy more than 86% of the time (the Doctor resource is a bottleneck). Then, we considered other two differents personnel plannings, where the number of doctors are, respectively, duplicated and triplicated.
acqBed N start
Evaluate before hospitalization acqNurse
end
Evaluate existence of new pathologies
Bed 100 relBed
there are not pathologies there are pathologies
relNurse
Have special attention to urinary infections
Provide VENOFER
relNurse there are not infections
there are infections π=2 no auto-transfusion
acqDoctor Make urgent pre-operative study
Nurse VENOFER dosis 5
relDoctor
Ask for X-ray control Get up patient and sit him in a tall seat
acqNurse
Check patient
Check if included in auto-transfusion program auto-transfusion
no auto-transfusion
KO
Start VENOFER
Doctor 3
Move urinary catheter and drainage away
relNurse 3
OK Check chemoprophylaxis protocols
Ask for blood units
3
acqDoctor
OK
Provide rules for antibiotics Provide rules for prophilaxis
auto-transfusion
KO Mark the region to operate
Day of hospitalization
Check patient to take a bath
relDoctor acqNurse
Fig. 3.
Check analytical controls
Day of surgical intervention
relNurse acqDoctor
relDoctoracqNurse
Post-operative day
Petri Net model of the clinical guideline.
within about 3 days. When the number of doctors is triplicated, the performance is improved and the hospital is able to manage 100 patients during a mean sojourn time of 3 days and 10 hours.
V. C ONCLUSIONS
Fig. 4.
Performance figures.
The orange and yellow curves show the trend of the metric under the two planning assumptions: with 6 doctors, it is possible to accomplish the clinical guideline for 65 patients
This paper presents a new modeling methodology for the clinical guidelines used in hospitals to treat and cure a disease. A part of the hip fracture guideline used in the University Hospital ”Lozano Blesa” in Zaragoza is taken as a use-case. As formal formalism we use Petri nets and we show how three different and important elements of the clinical guideline are incorporated to the model: (1) the flow of patients representing the sequences of treatments and care that should follow the patients for a particular disease; (2) the correct allocation and release of the resources; (3) different message passing. Some simulations under different scenarios are given to show the potential of these models for the analysis and verification of the clinical guideline.
Transition Evaluate before hospitalization Evaluate existence of new pathologies Have a special attention to urinary infections Make urgent pre-operative study Check if included in auto-transfusion program Start VENOFER Ask for blood units Provide rules for antibiotics Provide rules for prophilaxis Mark the region to operate Check patient to take a bath Day of surgical intervention Check analitical controls Move urinary catheter and drainage away Check chemoprophylaxis protocolol Check patient Get up patient and sit him in a tall seat Ask for X-ray control Provide VENOFER Transition there are/ are not pathologies there are/ are not infections auto/ no auto transfusion OK/KO
Duration (hh:mm:ss) 00:22:30 00:22:30 00:22:30 00:45:00 00:11:15 00:11:15 00:11:15 00:22:30 00:22:30 00:22:30 00:11:15 01:30:00 00:22:30 00:11:15 00:22:30 00:22:30 00:22:30 00:22:30 00:11:15 Weight 10%/90% 10%/90% 50%/50% 90%/10%
TABLE I T IMING / PROBABILISTIC SPECIFICATION .
ACKNOWLEDGMENTS This work has been partially supported by MICINN [TIN2011-27479-C04-01]. R EFERENCES [1] Special issue on system dynamics for policy, strategy and management education. Journal of the Operational Research Society, 50(4), 1999. [2] R.-N. AShiffman, B.-T. Karras, A. Agrawal, R. Chen, L. Marenco, and S. Nath. GEM: A proposal for a more comprehensive guideline document model using xml. Journal of the American Medical Informatics Association, 7(5):488 – 498, 2000. [3] A. A. Boxwala, M. Peleg, S. Tu, O. Ogunyemi, Q. T. Zeng, D. Wang, V. L. Patel, R. A. Greenes, and E. H. Shortliffe. Glif3: a representation format for sharable computer-interpretable clinical practice guidelines. Journal of Biomedical Informatics, 37(3):147 – 161, 2004. [4] S.-C. Brailsford, P.-R. Harper, B. Patel, and M. Pitt. An analysis of the academic literature on simulation and modelling in health care. Journal of Simulation, 3(3):130–140, 2009. [5] R. Davies. An assessment of models of a health system. Journal of the Operational Research Society, 36(8):679–686, 1985. [6] D. Fone, S. Hollinghurst, M. Temple, A. Round, N. Lester, and A. Weightman. Systematic review of the use and value of computer simulation modelling in population health and health care delivery. Journal of Public Health Medicine, 24(4):325– 335, 2003. [7] J.-W. Forrester. The impact of feedback control concepts on the Management Sciences. In Collected Papers of J.W. Forrester, pages 45–60. Wright-Allen Press, 1960. [8] GreatSPN. http://www.di.unito.it/∼greatspn. University of Torino, 2002.
[9] C. Harrell and V. Lange. Healthcare simulation modeling and optimization using medmodel. In Proceedings of the Winter Simulation Conference, volume 1, pages 233–238, 2001. [10] J.-B. Jun, S.-H. Jacobson, and J.-R. Swisher. Applications of discrete event simulation in health care clinics: a survey. Journal of the Operational Research Society, 50(2):109–123, 1999. [11] B. Lehaney and V. Hlupic. Simulation modelling for resource allocation and planning in the health sector. Journal of Royal Society Health, 115(6):382–385, 2008. [12] J. P. L´opez-Grao, J. Merseguer, and J. Campos. From UML activity diagrams to Stochastic Petri nets: application to software performance engineering. In J. J. Dujmovic, V. A. F. Almeida, and D. Lea, editors, Proceedings of the Fourth International Workshop on Software and Performance, WOSP 2004, Redwood Shores, California, USA, January 14-16, 2004, pages 25–36. ACM, 2004. [13] R. Mans, W. van der Aalst, and N. Russell. Implementation of a healthcare process in four different workflow systems. Technical report, Technische Universiteit Eindhoven, 2009. [14] OMG. Business Process Model and Notation. Object Management Group, January 2011. Version 2.0, formal/11-01-03. [15] OMG. A UML profile for Modeling and Analysis of Real Time Embedded Systems (MARTE). Object Management Group, 2011. Document formal/11-06-02. [16] OMG. Unified Modelling Language: Superstructure. Object Management Group, August 2011. Version 2.4, formal/11-0805. [17] OMG. Unified Modelling Language: Superstructure. Object Management Group, August 2011. Version 2.4, formal/11-0805. [18] ProM. http://www.promtools.org/prom6/. The process mining group - Eindhoven Technical University, 2010. [19] P. T. white paper. http://wiki.hl7.org/. PHI TECHNOLOGY white paper, 2008.