A Model-Based Approach to System-Level Dependency and Real-Time Analysis of Embedded Software∗ Zonghua Gu, Sharath Kodase, Shige Wang and Kang G. Shin Real-Time Computing Laboratory Department of Electrical Engineering and Computer Science University of Michigan Ann Arbor, MI 48109-2122, USA
[email protected] Abstract We describe an end-to-end tool-chain for modelbased design and analysis of component-based embedded real-time software. All aspects of an embedded real-time system are captured in domain-specific models, including software components and architecture, timing and resource constraints, processes and threads, execution platforms, etc. We focus on the AIRES tool, which performs various static analysis tasks based on the models, including system-level dependency analysis, execution rate assignment to component ports, real-time and schedulability analysis, and automated allocation of components to processors. By capturing all relevant information explicitly in the models at the design-level, and performing analysis that provide insight into nonfunctional aspects of the system, we can raise the level of abstraction for the designer, and facilitate rapid system prototyping.
1
Introduction
As embedded real-time systems become more and more complex and mission- or safety-critical, the traditional development process of manual coding followed by extensive and lengthy testing is becoming inadequate. The overarching concern for an embedded system developer is no longer to optimize software at very low levels in order to squeeze every ounce of performance out of it,1 but to ensure high-level system correctness, modularity and maintainability at the expense of some performance loss. In order to increase developer productivity, the abstraction level for ∗ The work reported in this paper was supported in part by DARPA and ARO under contracts/grants F3615-00-1706 and DAAD19-01-1-0473, respectively. 1 This may still be true for certain domains such as digital signal processing for mass-produced consumer products, where performance optimizations can result in large savings in hardware costs.
software development has been raised from assembly language to modern programming languages such as C/C++ and Ada. There is a recent trend to raise the level of abstraction further to the model-level, and rely on automatic or semi-automatic code generators to produce code in a traditional programming language. Examples of this approach include Unified Modeling Language (UML) [15], Model-Driven Architecture (MDA) [14], and Model-Integrated Computing (MIC) [13]. In particular, the MIC approach advocates using domain-specific models throughout the engineering process that allow both system analysis (to determine the overall characteristics of the system) and synthesis (to generate configuration or functional code for the system). The DARPA MoBIES (Model-Based Integration of Embedded Software) program, started in 2000, has been exploring model-based approaches for embedded software composition and analysis, especially emphasizing non-functional issues such as timing, synchronization, dependability and resource constraints. The Bold Stroke framework [9, 10] is a productline architecture used at Boeing for developing avionics mission computing software, which is the embedded software aboard a military aircraft for controlling mission-critical functions, such as navigation, target tracking and identification, weapon firing, etc. It is modeled in UML, manually coded in C++, and runs on top of Real-Time CORBA Event Service implemented in TAO [8]. Even though there exist UML models for the software, they mainly serve in a documentation role that the software developer can refer to while performing manual coding. Therefore, the link between model and code is weak and easily broken in the process of system maintenance and evolution, where code is modified or enhanced without the corresponding changes at
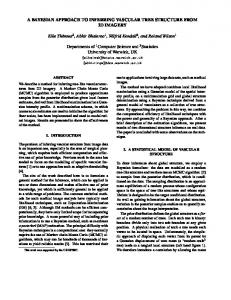
the model-level, or vice versa. Furthermore, UML has little support for analysis that is relevant for embedded systems, such as real-time properties like schedulability, safety properties like deadlock freedom, etc. UML Model Partial Import Analysis Results ESML Model Translation
AIF XML File
Analysis Tool (AIRES)
Translation
Code Generator
System Config Code
Figure 1: A partial view of the end-to-end MoBIES tool chain for avionics mission computing. Within the context of the DARPA MoBIES program, researchers from multiple institutions have been working together to produce an end-to-end tool chain with the Bold Stroke framework as an one of the application domains. The Embedded Systems Modeling Language (ESML) has been designed as a domain-specific modeling notation. Figure 1 shows portion of the toolchain relevant to this paper. The process starts with the existing UML models in Rational Rose, and partially imports them into the ESML models as components. The designer then manually constructs models of system architecture by inter-connecting the components, and enhances the models with attributes specific to embedded systems such as timing and resource information. Information collected from runtime instrumentation of the system can be also imported into the model as annotations. Once we have the models, a code generator tool can be used to generate system configuration file used for initializing the component inter-connection topology at runtime. With a translator provided by Vanderbilt University, we can also extract information from the models for analysis purposes in the form of Analysis Interface Format (AIF) XML files, which is essentially a subset of the ESML language that contains the dependency and real-time information needed by the analysis tools. AIF was designed mainly to facilitate integration of third-party modeling and analysis tools, and will not be discussed further. A tool called AIRES (Automatic Integration of Reusable Embedded Software) that we have been developing is the focus of the paper.
Given an AIF file generated from ESML models, AIRES extracts system-level dependency information, including event- and invocation-dependencies, and constructs port- and component-level dependency graphs. Various analysis tasks are supported based on these graphs, such as checking for anomalies such as dependency cycles, visual display of dependency graphs, as well as forward/backward slicing to isolate relevant components. It then assigns execution rates to component ports, and uses real-time scheduling theory to analyze the resulting system of real-time task set. If the task set is not schedulable, the designer can add more processors and allocate components to them with the help of the automated allocation algorithm. This paper is structured as follows: Section 2 describes the ESML modeling language. Section 3 describes the dependency analysis capabilities of the AIRES tool. Section 4 describes the real-time analysis techniques. Section 5 describes the algorithm for automated allocation of components to processors. Section 6 demonstrates the usage of the tool with an application example. Section 7 talks about related work, and the paper concludes with Section 8.
2
Embedded Systems Modeling Language
Based on the Model-Integrated Computing [13] approach, the Generic Modeling Environment (GME) is a configurable toolset for creating domain-specific modeling and program synthesis environments through a meta-model that specifies the modeling paradigm of the application domain. The meta-model captures all the syntactic, semantic and presentation information regarding the application domain, and defines the family of models that can be created using the resulting modeling environment. The ESML meta-model [6] defines a comprehensive modeling language that captures all essential aspects of the embedded system, including software architecture, timing and resource constraints, execution threads, execution platform information (processors and network), allocation of components to threads/processors, etc. We only describe the aspects of ESML that are essential for later discussions in this paper. ESML is based on Real-Time Event Channel implemented in the TAO CORBA [8]. Components are composite objects with ports, which interact with one another, either through event triggers or procedure invocations. The CORBA Component Model (CCM) terminology is adopted, where each component can have the following types of ports: • Publish Port to publish events.
• Subscribe Port to subscribe to events. • Receptacle to issue method invocations. • Facet to accept method invocations. Component interactions follow a control-push datapull style as shown in Figure 2. First, the data producer component publishes a DataAvailable event from its publish port indicating that it has fresh data; when the data consumer component receives the event from its subscribe port, it issues a GetData call from its receptacle to the producer’s facet to retrieve the data. Note that we abstract away from detailed functional behavior of the components, and only focus on the interaction dynamics. Facet
Receptacle
From ESML models, we first generate AIF files, and then extract system dependency information and construct a directed graph called Port Dependency Graph (PDG), where each node is a port, and each edge denote dependencies between ports. Note that we use ports to refer to both event publish/subscribe ports, and invocation facet/receptacles. Definition. A Port Dependency Graph (PDG) is a graph (Vp , Ep ), where • Vp is a set of ports, {pi , 1 ≤ i ≤ Np }. Each pi can be one of 4 types: publish port ppub , subscribe port psub , receptacle precep or facet pf acet . • Ep is a set of directed, weighted port connections, {conni , i ≤ i ≤ Nconn }, and each conni can be one of 2 types:
Invocation Publisher Component
Subscriber Component Event Publish Port
Subscribe Port
Figure 2: The control-push data-pull style of interaction. Each input port (subscribe port or facet) has an associated action that in turn triggers one or more output ports (publish port or receptacle) of the same component. This allows us to determine the intra-component trigger pathways used in the subsequent dependency analysis. Each action also has a WCET(worst-case execution time) attribute used for real-time analysis. Each subscribe port can subscribe to multiple events, and has a correlation attribute, either AND or OR. For AND correlation, an input port inp is triggered, i.e., the action associated with inp is executed, only when all of the input events arrive at inp; for OR correlation, the port is triggered when any of the input events arrive.
3
System-Level Dependency Analysis
Traditional software dependency analysis works at the code-level, and studies control and data flow relationships associated with functions and variables. Control dependency refers to flow of control through a sequential program, and data dependency refers to the locations of definitions and uses of the program variables. When we raise the level of abstraction from code to models, it is necessary to perform system-level dependency analysis, that is, structural and behavioral relationships between software components and ports at the level of system architecture, which often involve concurrency and distribution.
Inter-component dependency: is either event-trigger dependency from output port of the publisher component to input port of the subscriber component, or invocation dependency from receptacle of the invoking component to facet of the invoked component. Intra-component dependency: describes the intra-component trigger pathways from input ports to output ports of the same component. The weight of an edge is equal to the execution rate of the ports that it connects multiplied by the size of data transferred at each execution cycle. The PDG captures all the relevant dependency information in the ESML model, and serves as the backbone data structure for all subsequent analysis tasks. However, we define component dependency graphs (CDG) for purposes of convenient visual display as well as easy manipulation in certain analysis tasks. CDG captures dependency information at a higher level of abstraction – component-level instead of port-level – hiding all the intra-component dependencies. It can be derived directly and straightforwardly from PDG. We can use conventional graph algorithms to analyze the dependency graphs, and identify certain anomalies such as: • Dependency cycles. A cycle of event or invocation dependencies indicates a design error if it becomes an infinite loop at runtime. However in the case of feedback loops, it is possible to have a legitimate dependency cycle if the component receiving the feedback has AND correlation for its inputs.
• Events published with no subscribers, or events subscribed to with no publishers. • Component ports unreachable from any timers, hence unable to be assigned rates. This is elaborated in Section 4. In all the cases AIRES provides warnings to the designer, but it is up to the designer to decide if it is an error or not. We can also perform forward/backward slicing of the dependency graphs. Given a component or a port, we can answer user queries such as • What downstream components/ports can this component or port potentially affect via event or invocation dependencies? • What upstream components/ports can potentially affect this component or port? This is achieved by traversing the dependency graphs forward or backward starting from a component (for CDG) or a port (for PDG). These queries are useful in software evolution, where a designer can assess the impact of changing or replacing a certain component, as well as for other purposes such as localizing faults, minimizing regression tests, reusing components, and system re-engineering. Even though the current avionics software does not allow dynamic creation or destruction of components, both the inter- and intra-component dependencies can change at runtime due to modal behavior, that is, components can change mode to publish new events, stop publishing old events, or change its internal trigger pathways. For example, a modal component can have both active and inactive modes. When in the active mode, an input event triggers an output event; when in the inactive mode, an incoming event is simply ignored and dropped. ESML allows modeling of such behavior by associating a finite state machine with a modal component. Instead of a single PDG, we can view the system as having multiple pre-defined system-level modes, obtained by all combinations of component modes. Besides component modes, it is also possible for the system to have a system-wide normal mode and a fault mode. In the fault mode, one or more processors can fail, and certain backup components on the working processors are activated to replace components on the failed processors. We can construct a PDG for each system-level mode, and apply the analysis techniques to each mode separately.
4
Real-Time Analysis
The runtime execution framework for Bold Stroke uses RT-CORBA Event Service [8] running on the realtime operating system VxWorks, which supports a single address-space process on each processor with multiple threads. The mission computer interacts with sensors and actuators through periodic messages on one or more communication buses. Messages are triggered at harmonically-related execution rates such as 1Hz, 5Hz, 10Hz, etc. As a result, each processor has a number of system threads, also called rate groups, running at harmonically related rates. This periodicity forces processing within a rate group to be divided into execution frames, where each frame represents the fixed execution period. For example, the execution frame for a 20Hz rate group has length 50ms. Triggered by the Timeout events generated by a periodic timer, the frame begins by polling input messages from the communications buses. After inputs are complete, a DataAvailable event is pushed to initiate a chain of actions along the dependency graph. When all actions within a given rate group complete (frame processing completes), an output message is sent to external devices on the communications bus. A frame failing to complete outputs prior to the start of the next frame is said to be in a frame overrun condition, meaning that it has missed its deadline, here equal to its period. Each component/port pair is assigned an execution rate. All the ports assigned the same execution rate run within the context of the system thread with that rate. For example, all ports assigned rate of 20Hz run within the context of the 20Hz thread. The WCET (worst-case execution time) of the thread is thus the sum of WCETs of all the actions associated with input ports assigned to the thread. Note that rates are assigned to ports, not components, therefore a component may be multi-rate if it has multiple ports assigned different rates. The rate-assignment algorithm performs recursive depth-first search [3] on the PDG starting from each timer’s publish port, which publishes the Timeout event. All the ports reachable from a timer port is assigned the rate of the timer. If multiple input ports of a component are assigned different rates, and trigger the same output port, the output port is assigned the highest rate, i.e., the highest rate takes precedence and propagates through. If an input port of a component subscribes to multiple events with different rates, it is assigned the highest rate if its correlation attribute is set to OR, or the lowest rate if its correlation attribute is set to AND. For the latter case, the component under-samples the higher-rate inputs.
After the executing the rate assignment algorithm, we obtain a set of system threads or tasks (we use threads and tasks interchangeably). The Bold Stroke framework adopts fixed-priority, rate monotonic, preemptive scheduling discipline, that is, the higher rate thread has a higher execution priority and can preempt lower-priority threads. This allows us to use mature Rate Monotonic Analysis (RMA) techniques [7] to calculate thread response times. If the hardware platform is composed of multiple processors, and a system-level thread crosses processor boundary, it becomes a distributed and precedence-constrained task chain. The end-to-end response time analysis technique [12] can be applied for schedulability analysis of such task chains. We have not considered infrastructure overheads from RTOS and middleware during timing analysis, which can significantly impact the overall system response time according to measurements on the target. One approach is to roll the infrastructure overheads into component WCETs determined from runtime measurements. It is also part of our future work to incorporate message scheduling delays on the avionics bus into the end-to-end analysis.
5
Automated Allocation of Components to Processors
Given a component/port dependency graph and a multi-processor distributed hardware platform, we would like to allocate the components to processors in order to achieve certain objectives such as schedulability, load balancing, minimized network communication, etc. The typical allocation process works as follows: the designer manually allocates components to processors by modifying the ESML models in GME, then invokes AIRES to assess system real-time properties. If the system is not schedulable, he goes back to the models, redoes the allocation or adds more processors, and iterates the process until schedulability is achieved. As a typical system contains thousands of components and complex interactions, it is highly desirable to provide tool support to automate this process. At the most basic level, the designer can visually examine the dependency graphs to identify components with high or low-cohesion between them while making allocation decisions. We have also implemented simple algorithms such as first-fit (to minimize number of processors) and best-fit (to achieve load-balancing). Here we describe a heuristic algorithm based on [1] that attempts to minimize inter-processor communication costs while maintaining schedulability. No claims of optimality can be made due to its heuristic nature, and the designer can only view the allocation results as
suggestions that help him/her make the final decisions. The algorithm is performed on the Component Dependency Graph. First, we assign a util (utilization) attribute to each component, calculated from WCET and execution rate of its associated input ports. For example, an input port triggered at 20Hz and has an associated action with WCET of 5ms will contribute a utilization value of 5ms*20Hz/1000ms = 0.1. A component with two such input ports has utilization 0.2. The sum of utilizations of all components allocated to a processor must not exceed a certain upper bound util bound, which is a customizable parameter. According to the classic rate monotonic scheduling theory [7], any processor with utilization under 0.69 is schedulable. Setting util bound to a lower value puts more constraints on the allocation algorithm, and has the effect of balancing the workload across processors; setting it to a higher value makes it easier to find a feasible solution.2 We perform a heuristic k-way mincut algorithm [1] on the CDG, where k is the number of processors. That is, we cut the CDG into k clusters and allocate each cluster to a processor, while minimizing the total weight of edges that are cut, subject to the constraint that the total utilization on each processor does not exceed util bound . It is possible that the algorithm may fail to find a feasible allocation. In that case, the designer must redesign the system either by adding more processors, or increase util bound for each processor. This algorithm works under the assumption that the underlying platform is homogeneous, that is, all processors have the same processing power, and communication costs between processors are all the same. This is realistic for the tightly coupled avionics hardware architecture, which is PowerPC processors plugged into a VME backplane, but may not be applicable in the general case. More sophisticated optimization algorithms such as branch-and-bound or simulated annealing are needed to obtain accurate results, which have exponential complexity in the worst case, while the graph min-cut algorithm has polynomial complexity at the expense of optimality.
6
Sample Usage of AIRES
We consider one of the application scenarios provided to us by Boeing. Functionally, the scenario rep2 In order to obtain more accurate results, real-time scheduling theory [7, 12] need to be used as a subroutine in the allocation algorithm to assess system schedulability in place of the util bound parameter. Since the allocation algorithm is heavily heuristic in nature, we did not use more sophisticated schedulability checks during component allocation. However the designer should use the tool capabilities described in Section 4 to access system schedulability after allocation.
Figure 3: A screenshot of AIRES.
Figure 4: The end-to-end timeline of distributed system threads of 20Hz (left) and 1Hz (right). The numbers in square brackets denote response time interval [BCRT, WCRT] of the task starting from the timer trigger. The dark portion of the horizontal bar denotes BCRT, and the dark portion combined with light portion denotes WCRT. resents steering calculations needed to support various displays on the aircraft. There are two rate groups/system threads in the system: a 1Hz thread and a 20Hz thread. In the 1Hz thread, information from various waypoints – certain signposts along the designated route – is merged into route-based steering information, and is shown either in the navigation
or flight plan display, depending on the pilot steering mode. In the 20Hz thread, inputs from track sensors are merged and fed into the tactical steering and HUD (Heads-Up) display. This scenario is relatively simple from an analysis perspective since the dependency graphs for the two threads are disjunct from each other, but it serves as a good illustrating example. In
order to demonstrate the end-to-end distributed realtime analysis functionality, we modify the original scenario, which runs on a single processor, to run on a 2-processor distributed platform. Both threads crosses processor boundaries to become distributed tasks. In Figure 3, the normal mode system configuration is analyzed and displayed. This scenario does not have a fault mode. The Warnings Dialog displays dependency anomalies such as event dependency cycles, events published with no subscribers, component/port unreachable from timers, hence unable to be assigned rates, etc. Shown on the lower right is the Component Dependency Graph, and the upper right is the task graph, drawn with the Graphviz freeware tool. The left pane tree view displays the processors, tasks and components organized hierarchically; the right pane list view displays different analysis results depending on the item selected on the left pane. In this figure, a processor node is selected in the tree view, and the list view displays tasks running on the processor, with attributes such as WCET, period, utilization, WCRT (worst-case response time), BCRT (best-case response time), system slacks (the maximum scale-up factor while maintaining system schedulability), etc. Figure 7 shows the end-to-end timeline for the two distributed system threads in the task graph. In this application scenario, the two system threads do not intersect at a component, so there is no blocking time due to contention for shared resources. On the left is the timeline for the 20Hz thread with period 50ms. P1 50 is the timer-triggered task segment on processor P1, and P2 50 is the subsequent task segment on P2 triggered by the completion event of P1 50. The 20Hz thread is the highest priority thread in the system, and suffers neither preemption nor blocking delays. Therefore, its WCRT and BCRT are the same as its WCET. On the right is the timeline for the 1Hz thread with period 1000ms. It suffers preemption delays caused by the 20Hz thread. The first task segment P1 1000 on P1 has response time interval [26, 46]ms, and the next task segment P2 1000 on P2 has response time interval [33, 66]ms, both calculated relative to the 1Hz timer trigger on P1. Both system threads are schedulable since they finish within their deadlines.
non-functional analyses along many dimensions such as real-time, performance and reliability. Cadena [5] is an integrated environment for building and analyzing CORBA Component Model (CCM) based systems. Its main functionalities include CCM code generation in Java, dependency analysis and model-checking with DSpin [4]. Some of the concepts in dependency analysis are necessarily similar to ours, such as the Port Dependency Graph, since both tools are targeted towards the Bold Stroke framework. However the emphasis of Cadena is on verification of software logical properties through model-checking instead of system-level real-time and schedulability properties. The model-checking approach suffers from the wellknown state space explosion problem that limits its scalability. MetaH [2] is an ADL and toolset for development of real-time, fault-tolerant, securely-partitioned, multiprocessor software in the avionics domain. The toolset supports runtime executive code generation in Ada, real-time schedulability analysis based on RMA, as well as reliability and security analysis. The Bold Stroke framework is different from the MetaH framework in many ways. For example, Bold Stroke uses RT-CORBA Event Service as its underlying communication and execution substrate, which can be viewed as the counterpart of the MetaH runtime executive. The use of COTS (commercial off-the-shelf) software like TAO CORBA eliminates the need for generation of a customized executive for each application. There are also subtle differences in the runtime execution model. The port-to-port connections in MetaH cause periodic assignments to occur between the buffer variables associated with the ports. Therefore, for an end-to-end distributed task chain, the predecessor task T1 and successor task T2 are decoupled and both execute independently and periodically. In the Bold Stroke framework, T2 is directly triggered by the event issued by T1 instead of executing periodically. Classic RMA analysis techniques [7] can be applied to the MetaH framework, while the end-to-end response time analysis technique [12] must be used for the Bold Stroke framework to obtain accurate response times for an end-to-end task chain.
7
8
Related Work
VEST (Virginia Embedded Systems Toolkit) [11]is an integrated environment for constructing and analyzing component based embedded systems. Designers can select or create passive components, compose them into a system, map them onto runtime structures such as processes or threads, map them onto hardware platform, and perform dependency checks and
Conclusions and Future Work
We have described a model-based approach for analysis and rapid prototyping of object-oriented real-time software, using the avionics mission computing software as an application domain. The entire end-to-end tool-chain is a result of collaboration among multiple institutions, but in this paper we have mainly focused on the system-level dependency and real-time analy-
sis techniques implemented in the AIRES tool, which include dependency anomaly detection, visual displays of dependency graphs, assignment of execution rates to component ports, timing and schedulability analysis, automated allocation of components to processors, etc. All the algorithms implemented in the tool are of polynomial complexity and scalable to large, realisticallysized systems. We believe AIRES fills a gap in the current software development practice, which relies heavily on timeconsuming and expensive testing on the target platform, as it provides insight into non-functional aspects of models at design-level, and helps the engineer make high-level design decisions that have a large impact on the embedded software. It is complementary to tools in a typical IDE (Integrated Development Environment) that work at the code level, such as compilers, debuggers, runtime tracers and automated testers. As the model-based approach is becoming more mainstream, as evidenced by the Model-Driven Architecture initiative [14] and the number of tool vendors in the embedded real-time domain that claim to support it, analysis tools like AIRES that work at the model-level will become more prevalent. As part of our future work, we plan to use runtime data collected from instrumented application programs running on the target platform to provide accurate timing annotations in ESML models such as component WCET information, as well as validate analysis results produced by AIRES such as end-to-end response times. An instrumentation framework and log data format in XML has already been defined by Boeing. Standardized APIs for accessing XML files facilitate integration of such runtime information into AIRES.
References [1] Tarek F. Abdelzaher and Kang G. Shin. Periodbased load partitioning and assignment for large real-time applications. IEEE Transactions on Computers, 49(1):81–87, 2000. [2] P. Binns, M. Englehart, M. Jackson, and S. Vestal. Domain-specific software architectures for guidance, navigation and control. International Journal of Software Engineering and Knowledge Engineering, 6(2):201–227, June 1996. [3] Thomas H. Cormen, Charles E. Leiserson, Ronald L. Rivest, and Cliff Stein. Introduction to Algorithms. McGraw Hill Publishers, 2nd edition, 2001.
[4] Claudio Demartini, Radu Iosif, and Riccardo Sisto. dSPIN: A dynamic extension of SPIN. In SPIN, pages 261–276, 1999. [5] John Hatcliff, William Deng, Matthew Dwyer, Georg Jung, and Venkatesh Prasad. Cadena: An integrated development, analysis, and verification environment for component-based systems. In International Conference on Software Engineering, 2003. [6] Gabor Karsai, Sandeep Neema, Arpad Bakay, Akos Ledeczi, Feng Shi, and Andy Gokhale. A model-based front-end to tao/ace. In Proceedings of the 2nd Workshop on TAO, 2002. [7] Mark H. Klein, Thomas Ralya, Bill Pollak, and Ray Obenza. A Practitioner’s Handbook for RealTime Analysis: Guide to Rate Monotonic Analysis for Real-Time Systems. Kluwer Academic Publishers, 1993. [8] D. Schmidt, D. Levine, and T. Harrison. The design and performance of a real-time corba object event service. In Proceedings of ACM Conference on Object-Oriented Programming, Systems, Languages, and Applications, pages 434–445, 1997. [9] David Sharp. Reducing avionics software cost through component based product line development. In Proceedings of the Software Technology Conference, 1998. [10] David Sharp. Object-oriented real-time computing for reusable avionics software. In Proceedings of Fourth International Symposium on ObjectOriented Real-Time Distributed Computing, pages 185–192, 2001. [11] John Stankovic. Vest: A toolset for constructing and analyzing component based operating systems for embedded and real-time systems. Technical report, University of Virginia, 2000. [12] Jun Sun and Jane W.S. Liu. Bounding the endto-end response times of tasks in a distributed real-time system using the direct synchronization protocol. Technical report, University of Illinois, 1996. [13] Janos Sztipanovits and Gabor Karsai. Modelintegrated computing. IEEE Computer, 30(4):110–111, April 1997. [14] OMG MDA website. www.omg.org/mda. [15] OMG UML website. www.omg.org/uml.