A Modified Extensigraph Method for Evaluating Dough Properties of Hard Wheat Breeding Lines R. Y. Chen,1,2 B. W. Seabourn,1 F. Xie,3 and T. J. Herald1 ABSTRACT
Cereal Chem. 86(5):582–589
A modified extensigraph method reduced sample quantity to 100 g from 300 g and testing time by half with easy dough preparation compared to the AACC standard extensigraph method, which challenges wheat breeding programs where the sample size is small and evaluations of large numbers of samples are demanded. Correlation coefficients (r) for 93 pairs of each of six extensigraph dough characteristics of 31 different tested wheat samples were r = 0.95 for resistance-to-extension, r = 0.80 for extensibility, r = 0.93 for ratio of resistance-to-extension to extensibility, r = 0.92 for ratio of maximum resistance-to-extension to ex-
tensibility, and r = 0.81 for area under the curve (energy). Correlation coefficients for the measurements of extensigraph dough characteristics at each of three rest-time tests between the modified and standard methods were significant. Some dough mixing characteristics and bake tests correlated better with dough extension characteristics when determined by the modified method. Repeatability of the modified method test was good. The modified extensigraph method can be a useful alternative to the standard method for the milling and baking industries, crop quality surveys, and wheat quality research.
Rheological characteristics of wheat flour dough with explicit, nonlinear shear thinning (pseudoplastic), and thixotropic behaviors (Weipert 1990) are complex and very important parameters for wheat quality evaluation and determination of end product quality. The complex and important rheological parameters, stress vs. strain, resistance-to-extension vs. extensibility, elasticity vs. viscosity, and maximum pressure vs. time taken for bubble to burst, can be measured with fundamental or empirical techniques. Fundamental measurements are not suited for establishing the possible relationship between the rheological properties of wheat flour dough and its baking behavior because the small deformations involved are completely different from the large deformations during fermentation and baking (Kokelaar et al 1996). However, rheological tests developed using either small or large strain levels give information that can be related to the structural characteristics of dough (Davidou et al 2008). The empirical tests have proven to be useful in practical industrial applications and continue to be used in research on wheat flour dough (Janssen et al 1996) because they generally correlate well with breadmaking performance (Tronsmo et al 2003). The Brabender extensigraph is one of several empirical rheological instruments that offer a measurement of stress-strain relationship in dough after defined rest periods (Preston and Hoseney 1991). The extensigraph test can specifically determine dough extension characteristics that predict breadmaking quality or other end product qualities of wheat flour, estimate gluten quality, standardize optimum dough properties for baked goods, evaluate specific effects of dough ingredients and additives, differentiate qualities of breeding lines, improve the rapid screening of wheat cultivars, and control the flour quality for both the milling and baking industries (Bloksma 1990a,b; Hoseney 1994; Kokelaar et al 1996; Anderssen et al 2004; Mirsaeedghazi et al 2008). Although the standard extensigraph method has been widely used for many years, it requires a large sample size (300 g), which does not include amount of flour for determination of flour water ab-
sorption and mix time using the 50-g farinograph and a lengthy testing time with complicated dough preparation. Other instruments that are used for evaluation of dough extension characteristics include the Chopin alveograph and the TA-XT2i texture analyzer with a modified-geometry Kieffer rig used as a smallscale method (Kieffer et al 1998; Mann et al 2005). The alveograph method also requires a large sample size (250 g) and relies on identical water absorption and mix time for dough preparation. Large sample size and time requirements for both standard extensigraph and alveograph tests have precluded their general use for breeding programs in the United States (Nash et al 2006). Although a small flour sample was used for the TA-XT2i texture analyzer with a Kieffer rig, the data did not correlate with the standard extensigraph method, making the data interpretation difficult. In addition, very little information was reported about the reproducibility of the small-scale extension test (Dunnewind et al 2004). Thus, the standard extensigraph test has more advantages and benefits than other extension tests, but with some significant limitations such as requiring large amounts of flour, long testing times, and inconvenient dough preparation. Such limitations do not allow the standard extensigraph test to be used for evaluation of wheat samples in wheat breeding programs where sample size is small and evaluation is demanded of large number of samples. U.S. hard winter wheat breeders are interested in the dough extension tests for their breeding programs if the test requires small sample size (personal conversations). The USDA-ARS Hard Winter Wheat Quality Lab in Manhattan, KS, has conducted the standard extensigraph or alveograph tests on composite hard winter wheat breeding lines for some of hard winter wheat breeding programs in the Great Plains. Composite breeding lines were used for the dough extension tests because of lack of seeds in one location. Therefore, developing or modifying a method that requires a small amount of flour, cuts testing time, allows easy dough preparation, generates satisfying results, and has good repeatability for the dough extension tests on the extensigraph instrument could help avoid many limitations of the standard extensigraph and other tests and bring about a more efficient and effective evaluation of dough extension characteristics. Our objective was to modify the standard extensigraph method and minimize its limitations by reducing sample size and decreasing dough preparation time. A modified method that offered convenient dough preparation and required small sample size and less testing time would be available to evaluate flour samples in wheat breeding programs and available as an alternative to the standard extensigraph method for the milling and baking industries, wheat crop quality surveys, and wheat quality research.
1 USDA,
ARS, Hard Winter Wheat Quality Laboratory, 1515 College Ave., Manhattan, KS 66502. author. Phone: 785-776-2750. Fax: 785-537-5534. E-mail address:
[email protected] 3 Kansas State University, Department of Grain Science and Industry, Manhattan, KS 66506. 2 Corresponding
doi:10.1094 / CCHEM-86-5-0582 This article is in the public domain and not copyrightable. It may be freely reprinted with customary crediting of the source. AACC International, Inc., 2009.
582
CEREAL CHEMISTRY
MATERIALS AND METHODS
bake mix time and loaf volumes generated by eight Wheat Quality Council collaborators was used to estimate the relationship with data generated by modified and standard extensigraph methods.
Wheat Samples Thirty-one hard winter wheat cultivars and advanced breeding lines (2006 and 2007 crop years) grown in seven states (Texas, Oklahoma, Kansas, Colorado, Nebraska, South Dakota, and Montana) were used in this experiment (Table I). These samples had been submitted for the Hard Winter Wheat milling and baking evaluation of the Wheat Quality Council located in Pierre, SD, where the mission is to advocate the development of new wheat cultivars that improve the value of wheat to all parties in the U.S. supply chain. The test weight of the samples was 74.9–84.1 (kg/hL) and the thousand kernel weight (TKW) was 22.3–37.9 (g). The wheat physical characteristics were evaluated using the Single Kernel Characterization System (Approved Method 55-31, AACC International 2000). Average wheat kernel hardness was 51–87, average kernel diameter was 1.87–2.65 (mm), and average kernel weight was 24.4–38.6 (mg). The wheat samples were milled with a Miag mill located in Kansas State University, Department of Grain Science and Industry. The straight-grade flour was used for all analyses, baking, and physical dough tests.
Modified Extensigraph Test A 100-g micro mixer (National Mfg Division, TMCO, Lincoln, NE) was used for dough preparation with 100 g of flour (14% moisture basis) and a salt solution. The salt solution was prepared in a 100-mL plastic beaker using 2.0 g of salt (sodium chloride) and amount of distilled water (% as is) resulting in a 50-g farinograph consistency of 500 BU minus 2%, which was very close to the water absorption used for dough prepared in the 300-g farinograph in the standard extensigraph test. Dough mix time for the 100-g pin mixer was estimated using a 10-g mixograph. Flour dough was mixed to optimum development, which was determined by an experienced operator or baker. Optimum dough development occurs when the dough pulls away from the sides and bottom of the mix bowl and is smooth and clear in appearance. If the optimum point is passed, the dough will loose elasticity and become wet and sticky. Dough is usually smooth and clear appearance from the sides and bottom of the mix bowl after optimum development. The dough was then scaled to 150 g, rounded, molded, placed in an extensigraph dough holder, and rested for 30, 60, and 90 min in the extensigraph rest cabinets at 30°C. The dough was then tested as prescribed by the standard extensigraph method after each of three rest times. There was one piece of the dough per sample evaluated.
Flour Analysis Untreated wheat flour samples were analyzed for moisture, ash, and protein content according to Approved Methods (44-15, 0801, and 46-30, respectively) (AACC International 2000). Wheat flour protein content of the samples (14% moisture basis) was 10.6–14.0% (Table I). Flour ash content was 0.38–0.49%. Farinograph, mixograph, and extensigraph tests were conducted on the samples according to AACC Approved Methods (54-21, 54-40A, and 54-10, respectively). All samples were baked utilizing the pup loaf test according to AACC Approved Method 10-10B. Data of
Statistical Analysis All statistics were calculated using a statistical data analysis of Excel program for correlation coefficients.
TABLE I Physical and Chemical Properties of Wheat Samples Grown at Different Locations in 2006 and 2007a SKCS Results Samples Hatcher CO03W239 CO03W054 CO02W237 Millennium NH03614 OK Bullet OK00514 OK05737W OK03522 OK02405 Tandem SD98W175 SD01058 SD0111 SD01273 Genou MT0495 MTS04114 Fuller KS990498 KS970274 Overley Smoky Hill Aspen Duster Tam 111 Tam 112 TX01A5936 TX01D3232 TX01V5314 a b
Stateb CO CO CO CO NE NE OK OK OK OK OK
SD SD SD SD SD MT MT MT KS KS KS KS KS KS OK TX TX TX TX TX
Test Wt (kg/hL)
TKW (g)
Kernel Hardness
Kernel Size (mm)
Kernel Wt (mg)
Flour Protein (14% mb)
FlourAsh (14% mb)
82.3 80.9 80.9 81.5 77.5 77.5 83.5 82.9 80.2 84.1 77.6 81.4 81.4 80.1 80.9 80.9 77.0 81.0 82.0 79.1 76.1 80.2 79.3 79.7 79.2 83.5 79.1 80.1 81.1 76.5 74.9
31.4 30.1 30.8 28.4 26.4 28.8 31.7 31.3 27.5 37.9 30.8 32.9 27.8 30.6 32.6 32.8 22.3 32.8 33.2 37.5 32.1 35.0 33.4 30.0 36.4 29.0 28.9 30.1 32.6 28.6 27.1
60 64 70 53 66 55 77 80 65 75 80 66 70 57 68 72 64 69 56 51 65 67 56 62 62 87 62 70 61 68 64
2.29 2.22 2.34 2.11 2.13 2.32 2.55 2.55 2.40 2.63 2.34 2.46 2.22 2.16 2.41 2.27 1.87 2.43 2.41 2.65 2.34 2.64 2.63 2.41 2.57 2.32 2.20 2.20 2.41 2.19 2.11
33.1 30.5 32.4 29.5 29.2 32.4 33.5 33.6 32.0 38.5 31.8 34.4 29.2 31.4 33.9 33.1 24.4 32.9 35.5 38.6 33.9 35.8 36.7 33.0 38.0 30.0 29.8 30.4 34.1 28.2 29.2
13.54 13.23 13.35 13.25 11.91 11.03 12.40 11.61 11.73 10.92 12.13 12.47 12.30 11.94 12.39 11.12 13.74 11.03 11.72 13.25 12.11 12.34 13.64 12.83 13.47 10.64 12.18 12.74 13.36 12.55 13.96
0.42 0.39 0.45 0.40 0.48 0.44 0.46 0.48 0.46 0.39 0.44 0.42 0.44 0.41 0.48 0.46 0.43 0.38 0.39 0.38 0.41 0.39 0.40 0.49 0.47 0.38 0.41 0.44 0.39 0.40 0.48
Test Wt, test weight; TKW, thousand kernel weight; Kernel Hardness, single kernel hardness; Kernel Size, single kernel size, Kernel Wt, single kernel weight. CO, Colorado, NE, Nebraska, OK, Oklahoma, SD, South Dakota, MT, Montana, KS, Kansas,TX, Texas. Vol. 86, No. 5, 2009
583
RESULTS AND DISCUSSION Farinograph Results and Dough Preparations for Extensigraph Tests Table II summarizes the results of 50-g farinograph tests and water absorption and mix time used for the modified method to prepare dough in the 100-g mixer. The optimum water absorption determined by the 50-g farinograph test for the 31 flour samples was 55.9–66.4% on a 14% moisture basis, with an average of 60.8%. Average farinograph dough development time was 11.0 min; CO03W054 and Duster samples had the longest and shortest times at 26.3 and 1.9 min, respectively. Other farinograph results such as mix stability, mix tolerance index, and dough breakdown varied among the samples. These samples not only differed in dough physical properties as indicated by farinograph measurements, but also in protein content (Table I), locations, and sample sources. Water absorption and mix time used to prepare dough in the 100-g mixer for the modified extensigraph test were 56.2–68.1% and 2.5–6.9 min, respectively. The mix time for dough preparation using the 100-g mixer with rotating pins was much shorter than dough made from the standard method using the 300-g farinograph with Z-blades. Average mix time for the 31 dough samples prepared in the 100-g mixer was only 4.1 min, at 2.5–6.9 min, while the average mix time was ≈11.0 min, at 1.9–26.3 min if the dough was prepared in the 300-g farinograph for the standard extensigraph method. The dough mix time was much shorter in the 100-g mixer than in the farinograph if the farinograph mix time was >20 min. For example, dough mix time for CO03W054 was only 6.0 min in the 100-g mixer but 26.3 min in the farino-
graph. The mixing action in a pin mixer is the superposition of a large number of stretches and folds of the dough around the pins (Anderssen et al 1997; Gras et al 2000). Mixing on a 100-g mixer can be viewed as a series of extension tests (Anderssen et al 1997; Bekes et al 2000; Gras et al 2000), whereas the farinograph mixes in a different manner, through a pack and squeeze action (Mann et al 2008). This may be a reason why the mix time in a pin mixer is shorter than in a farinograph with Z-blades. In addition to the advantage of short dough mixing time, dough preparation using the 100-g mixer was easier, more convenient, and faster than dough preparation using the 300-g farinograph based on instrument operation, cleaning of mixing parts, and handling of the mix bowl. Therefore, the improved dough preparation in the 100-g mixer is more efficient and effective for the modified extensigraph test, and more samples can be evaluated on a daily basis for breeding programs, wheat crop quality surveys, and wheat quality research. Repeatability of the Modified Dough Preparation Repeatability of any test method is critical. Six flour samples were chosen at random from the 31 samples for evaluation to determine the repeatability of the modified extensigraph test. Dough extension measurements determined by the modified extensigraph methods for each of the six flour samples were conducted for three replicates. Means (Avg), standard deviation (SD), and coefficients of variation (CV) were calculated for the three replicates. Two samples were used as examples for discussion because the other four samples had similar results (Table III). The modified extensigraph method at 30, 60, and 90 min was encouraging by the good results based on means, standard deviation, and
TABLE II Farinograph Results and Mix Time for Dough Prepared in a 100-g Mixera 50-g Farinograph Samples
Hatcher CO03W239 CO03W054 CO02W237 Millennium NH03614 OK Bullet OK00514 OK05737W OK03522 OK02405 Tandem SD98W175 SD01058 SD0111 SD01273 Genou MT0495 MTS04114 Fuller KS990498 KS970274 Overley Smoky Hill Aspen Duster Tam 111 Tam 112 TX01A5936 TX01D3232 TX01V5314 Avg Max Min a
Water Abs (as is %)
Water Abs (14%mb)
65.1 64.2 70.1 65.1 62.0 58.8 65.5 65.1 62.3 65.5 63.0 63.7 63.7 62.2 63.2 64.1 63.8 61.9 60.5 62.0 58.2 58.6 63.9 59.7 66.6 64.8 60.4 63.9 63.8 62.8 64.6 63.2 70.1 58.2
62.3 60.4 66.4 61.6 58.5 55.9 62.4 62.2 60.5 63.8 60.8 61.5 60.8 60.3 60.6 61.9 62.0 60.6 59.3 59.6 56.4 57.8 62.3 57.3 64.3 62.4 58.3 61.0 61.5 60.2 62.4 60.8 66.4 55.9
Development Time (min) 12.3 11.5 26.3 11.0 5.2 6.5 6.0 6.3 6.2 6.1 20.2 8.5 6.2 8.5 9.0 6.2 25.3 7.2 10.0 22.2 23.8 18.5 22.0 8.5 7.5 1.9 6.3 6.7 7.5 9.2 8.8 11.0 26.3 1.9
Mix Stability (min) 27.3 24.6 28.7 31.4 10.7 18.5 11.9 14.9 14.9 19.1 31.6 23.2 13.5 20.2 17.7 14.0 35.2 13.3 19.1 31.9 36.0 29.0 28.9 32.2 18.4 4.2 13.9 26.5 12.5 16.0 16.3 21.1 36.0 4.2
Abs, absorption; MTI, mix tolerance index; Avg, average; Max, maximum; Min, minimum.
584
CEREAL CHEMISTRY
100-g Mixer MTI 10 12 0 9 30 13 31 23 20 21 0 10 21 15 18 18 10 27 11 8 9 4 19 16 18 63 28 10 26 19 15 17 63 0
Breakdown (min) 30.2 27.5 34.1 34.0 9.4 20.1 10.2 12.8 12.5 12.6 34.2 25.1 14.2 22.0 19.6 14.5 40.5 12.7 21.6 33.6 37.8 30.4 30.8 34.2 17.3 2.7 11.6 27.9 15.1 17.4 19.2 22.1 40.5 2.7
Water Abs (as is %)
Dough Mix Time (min)
63.1 62.2 68.1 63.1 60.0 56.8 63.5 63.1 60.3 63.5 61.0 61.7 61.7 60.2 61.2 62.1 61.8 59.9 58.5 60.0 56.2 56.6 61.9 57.7 64.6 62.8 58.4 61.9 61.8 60.8 62.6 61.2 68.1 56.2
3.8 3.6 6.0 4.3 3.0 4.1 3.0 3.4 3.4 4.3 5.9 3.6 2.5 3.3 3.0 3.0 5.5 3.0 4.0 5.8 6.9 6.0 4.8 5.4 3.3 4.8 2.6 3.5 3.1 4.3 3.8 4.1 6.9 2.5
coefficient of variation for each of the six dough extension measurement traits. All traits were observed to have low CV and small SD. Therefore, this modified extensigraph method test is repeatable. Correlations Between Modified and Standard Extensigraph Methods The dough extension characteristics evaluated by the extensigraph tests included resistance-to-extension (R), extensibility (E), maximum resistance-to-extension (Rmax), ratio of resistanceto-extension to extensibility (R/E), ratio of the maximum resistance-to-extension to extensibility (Rmax/E), and area under the curve (W), which is a proportion of energy used for stretching a cylindrically shaped dough piece until the dough piece breaks. The resistance-to-extension is also referred to as dough strength (Kieffer et al 1998; Mann et al 2005). However, Rosada (2004) refers to the dough strength as a balance between dough extensibility and dough elasticity. The curve height (resistance-toextension) and area under the curve are taken as measures of flour strength (Hoseney 1994). The term dough strength is not used here for discussion to avoid the various definitions for flour and dough strength. Each piece of dough was stretched three times at 30, 60, and 90 min. Two pieces of dough for each flour sample were tested using the standard extensigraph method and averaged for data results. The averaged data was then used for correlation coefficient analysis with data from dough prepared in the 100-g mixer for the modified extensigraph method.
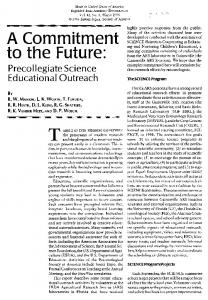
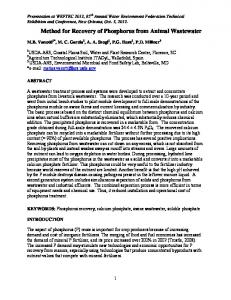
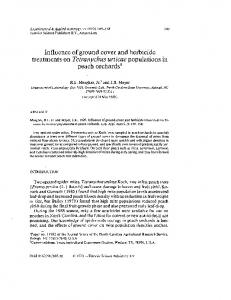
Significant relationships between modified and standard extensigraph parameters were observed despite the different dough preparations. Resistance-to-extension (R) and maximum resistance-to-extension (Rmax) obtained by the modified method were highly correlated with the data generated by the standard extensigraph method. Correlation coefficients (r) of 93 pairs of R and Rmax between the modified and standard extensigraph methods are r = 0.95 (P < 0.0001) (Fig. 1) and r = 0.93 (P < 0.0001) (Fig. 2), respectively. The resistance-to-extension from the dough extension test was important because of its high correlation with breadmaking performances such as water absorption, mix time, and loaf volume. A good breadmaking-performance dough usually exhibits a good balance between dough resistance-toextension and extensibility, as well as a maximum ability, not only to minimize gas cell breakage, but also to expand gas cell rising. Although R has a good correlation with Rmax, they are different from one other. Anderssen et al (2004) found that the Rmax represents an excellent basis for discriminating between wheat cultivars on the basis of glutenin composition. The modified extensigraph method was in agreement with the standard method for the dough strength-related parameters (R and Rmax). Extensibility is one of three rheological characteristics of wheat flour dough (Kokelaar et al 1996). Two other characteristics are strain hardening and resistance-to-deformation. There was a good correlation coefficient (r = 0.80) (P < 0.0001) of the 93 pairs of extensibility values between the standard and modified methods (Fig. 3). Nonetheless, the extensibility correlation coefficient was
TABLE III Repeatability of Modified Extensigraph Method Based on Standard Deviation and Coefficients of Variationa Time (min)
Result
CO02W237 30 30 30 30 30 30 60 60 60 60 60 60 90 90 90 90 90 90
T1 T2 T3 Avg SD CV T1 T2 T3 Avg SD CV T1 T2 T3 Avg SD CV
2
Energy (cm ) 121 126 132 127 5.2 4.1 163 178 173 171 7.7 4.5 166 148 175 163 13.6 8.3
Resistance (R) (BU) 474 501 504 493 16.5 3.4 891 884 848 874 23.1 2.6 999 995 999 998 2.3 0.2
Extensibility (E) (mm) 144 142 149 145 3.3 2.2 125 132 130 129 3.6 2.8 122 110 125 119 8.2 6.9
Maximum (Rmax) (BU) 650 700 669 673 25.2 3.8 1,000 993 996 996 3.5 0.4 999 998 999 999 0.6 0.1
R/E Ratio
Rmax/E Ratio
3.3 3.5 3.4 3.4 0.1 3.5 7.1 6.7 6.5 6.8 0.3 4.6 8.2 9.1 8.0 8.4 0.6 6.9
4.5 4.9 4.5 4.6 0.2 5.2 8.0 7.5 7.7 7.7 0.2 3.2 8.2 9.1 8.0 8.4 0.6 7.1
OK Bullet 30 T1 89 325 155 411 2.1 2.7 30 T2 82 303 152 390 2.0 2.6 30 T3 93 338 152 441 2.2 2.9 30 Avg 88 322 153 414 2.1 2.7 30 SD 5.6 17.7 1.7 25.6 0.1 0.2 30 CV 6.4 5.5 1.1 6.2 5.5 6.5 60 T1 108 386 156 498 2.5 3.2 60 T2 93 364 147 471 2.5 3.2 60 T3 111 407 151 542 2.7 3.6 60 Avg 104 386 151 504 2.6 3.3 60 SD 9.5 21.5 5.0 35.8 0.1 0.2 60 CV 9.1 5.6 3.3 7.1 5.0 6.8 90 T1 102 373 154 489 2.4 3.2 90 T2 111 380 157 522 2.4 3.3 90 T3 113 424 151 551 2.8 3.6 90 Avg 109 392 154 521 2.6 3.4 90 SD 6.1 27.6 2.9 31.0 0.2 0.2 90 CV 5.6 7.0 1.9 6.0 8.5 7.0 a T1, first test; T2, second test; T3, third test; R max, maximum resistance to extension; Avg, average; SD, standard deviation; CV, coefficient of variation. Vol. 86, No. 5, 2009
585
lower than R or Rmax, possibly because 1) more flour components affect extensibility than resistance-to-extension; 2) extensibility is more sensitive than resistance-to-extension; and 3) flour water absorption affects the dough extensibility more than dough resistance-to-extension. Grausgruber et al (2002) found that there was a very low correlation coefficient of extensibility between standard extensigraph method and small-scale extension test using the TA.XT2i texture analyzer equipped with the Kieffer dough and gluten extensibility rig. Mann et al (2005) compared a small-scale (modified Kieffer) extension test with the standard extensigraph method and discovered that the extensibility obtained by the two methods was less related than the other dough strength parameters. This modified method is much better than the other modified extension tests based on the correlation coefficient of extensibility with the standard extensigraph method. The area under the curve, referred to as energy, is proportional to deformation work (W) and indicates flour strength. The area under the curve determined by the modified method was correlated with measurements of area under the curve by the standard extensigraph method (Fig. 4). The correlation coefficient was r = 0.81 (P < 0.0001). In another micro-extensigraph study, Grausgruber et al (2002) found significantly lower coefficients for the area under the curve. In this study, the energy generated by the modified method was more highly correlated with loaf volume and dough mix characteristics than was the energy measured with the standard extensigraph method. Therefore, the modified extensigraph method could be more useful than the standard extensigraph method for predicting baking performance because dough preparation for the modified method is very similar to that for the breadbaking test, while it would not be very similar for the stan-
dard extensigraph method. Dough preparation affects dough rheological characteristics. Figures 5 and 6 show the relationships of ratio of resistance-toextension to extensibility (R/E) and ratio of maximum resistanceto-extension to extensibility (Rmax/E) between the modified and standard methods. Gas bubble expansion, which shows bread loaf volume quality (Anderson et al 2004), can be characterized either by R or by Rmax and extensibility, the correlation coefficients of each were: R/E (r = 0.92, P < 0.0001) and Rmax/E (r = 0.91, P < 0.0001). A good balance between the two factors, resistance-toextension and extensibility, is indicative of the dough expansion and gas holding capability. Janssen et al (1996) found that E/Rmax exhibited the same trend as did tan δ (G'' [loss modulus]/G' [storage modulus]), which can describe rheological properties of material. The best quality dough should have sufficiently high resistance to internal flow to prevent gas cells from coalescing and have sufficiently low resistance to internal flow to allow the gas cells to expand easily (referred to as extensibility). Therefore, the ratio value is one of the most important dough characteristics for bread dough quality. Correlation coefficients of dough extension characteristics were assessed between the modified and standard extensigraph methods after each test of three dough rest times (30, 60, and 90 min) (Table IV). There was a significantly positive correlation in the dough resistance-to-extension at all the dough resting times, with values of r = 0.91–0.93. Correlations between the two methods for Rmax were r = 0.86 at 30 min to r = 0.95 at 60 min. Correlations of the area under the curve (Energy) between two methods were r = 0.83 at 30 min, r = 0.82 at 60 min, and r = 0.73 at 90 min. The Rmax/E between the two methods had a high correlation, values of r = 0.88–0.91. Correlation of E between the two methods increased with length of the rest time. Because flour dough
Fig. 1. Correlation of resistance to extension (R) between the modified and standard extensigraph methods (n = 93), significantly different at P < 0.0001. Fig. 3. Correlation of extensibility (E) between the modified and standard extensigraph methods (n = 93), significantly different at P < 0.0001.
Fig. 2. Correlation of maximum resistance to extension (Rmax) between the modified and standard extensigraph methods (n = 93), significantly different at P < 0.0001. 586
CEREAL CHEMISTRY
Fig. 4. Correlation of area under curve (W) between the modified and standard extensigraph methods (n = 93), significantly different at P < 0.0001.
exhibited time-dependent fluid behaviors, all tests of the three rest times (30, 60 and 90 min) of the modified and standard methods were required. Grausgruber et al (2002) found that this was unnecessary for the micro-method using the TA.XT2i texture analyzer equipped with the Kieffer dough and gluten extensibility rig. Relationship Among Extensigraph Tests, Farinograph, and Bake Tests Analysis was extended to examine the correlations of the extensigraph testing results with measurements of the farinograph and bake tests (Table V). Most of the farinograph traits were correlated with the dough extension measurements determined by the modified and standard extensigraph methods. Mann et al (2008) reported that the 50-g farinograph and 2-g mixograph mixing traits (except mixograph peak resistance) were not correlated with the extensibility determined by the standard extensigraph method. However, dough extensibility determined by the standard method at two tests (60 and 90 min) was significantly and negatively correlated with farinograph mixing traits. Correlation coefficients of the farinograph development time with extensibility at 60 and 90 min were r = –0.89 and –0.86, respectively. Correlation coefficients between the dough extensibility evaluated using the modified method and farinograph mixing traits were low because the dough for the extension test was prepared in the 100-g mixer rather than in the 300-g farinograph. The resistance (R) and R/E ratio of the dough extension characteristics measured by the modified method correlated higher with mix stability and MTI of farinograph dough mixing properties than with the standard method. Correlations of the farinograph mixing characteristics with some dough extension characteristics evaluated using the modified method were more constant at dif-
Fig. 5. Correlation of resistance to extension to extensibility(R/E) ratio between the modified and standard extensigraph methods (n = 93), significantly different at P < 0.0001.
Fig. 6. Correlation of maximum resistance to extension to extensibility(Rmax/E) ratio between the modified and standard extensigraph methods (n = 93), significantly different at P < 0.0001.
ferent dough rest times than at the standard method (e.g., stability vs. energy, breakdown vs. energy, and MTI vs. energy). The differences in correlation coefficients of dough extension characteristics with the farinograph mixing properties resulted from two different mixing styles of dough preparation. The elastic portions of the deformations were approximately five times higher in the shear experiments than in the extension experiments. A small part of this difference could be explained by the longer recovery time (Bloskma et al 1988). Table V showed that correlations of area under the curve (energy) determined by the modified method with farinograph mixing traits were constant at tests of 30, 60, and 90 min. The constancy of the correlation indicated that the dough elastic recovery may be improved after the dough that was prepared in the 100-g mixer was stretched each time. The dough prepared in the 300-g farinograph may have been subject to extensive shearing, causing differences in recovery of the dough elasticity for different strengths of flour samples. Consequently, the correlation of farinograph mixing traits with energy measured by the standard method may be inconsistent. Therefore, the 100-g dough mixer may be more reliable and practical than the farinograph for extensigraph prepared tests. The relationship between the bake test traits (bake mix time and loaf volume) and dough extension measurements determined by the modified and standard methods were examined. There were good correlations between bake mix time and dough extension characteristics (Table V). Correlations of the bake mix time with most of dough extension characteristics determined by the modified method were improved compared to the standard method. The mixing time required for optimum dough development was related to several stress-related dough properties. The correlation was positive with stress at a large strain and strain hardening and negative with the strain rate-dependency of the stress (Sliwinski et al 2004). The mix time required for different flour samples to achieve optimum dough development for either breadbaking tests, extension tests, or other tests was very important. A relatively good correlation coefficient was obtained for Energy (W) measured by the modified extensigraph method at dough extension tests of 60 and 90 min versus the loaf volume (r = 0.73). There was a weak correlation between loaf volume and extensibility determined by either the modified or standard methods in this experiment. In contrast, Zounis et al (1993) found that extensigraph length (extensibility) was correlated to loaf volume (r = 0.61). After W results at tests of 30, 60, and 90 min were
TABLE IV Correlation Coefficients (r) of Dough Extensional Characteristics Between Modified and Standard Extensigraph Methodsa Time (min)
Dough Characteristics
30 30 30 30 30 30 60 60 60 60 60 60 90 90 90 90 90 90
Energy (cm2) Resistance (BU) Extensibility (mm) Max Resistance (BU) R/E Ratio Rmax/E Ratio Energy (cm2) Resistance (BU) Extensibility (mm) Max Resistance (BU) R/E Ratio Rmax/E Ratio Energy (cm2) Resistance (BU) Extensibility (mm) Max Resistance (BU) R/E Ratio Rmax/E Ratio
Correlation Coefficientsb (r) 0.83*** 0.91*** 0.68*** 0.86*** 0.88*** 0.88*** 0.82*** 0.93*** 0.70*** 0.95*** 0.91*** 0.90*** 0.73*** 0.93*** 0.78*** 0.93*** 0.91*** 0.88***
a
R/E, resistance to extension to extensibility; Rmax/E, maximum resistance to extension to extensibility; Max, maximum. b ***, Significantly different at P < 0.0001. Vol. 86, No. 5, 2009
587
averaged, the average energy from either the modified or standard extensigraph methods was fairly well correlated with loaf volume (Figs. 7 and 8). Relationship (r = 0.72) between the modified method and loaf volume was slightly better than between the standard method and loaf volume (r = 0.68). Nash et al (2006) found the area under the
curve to be a good predictor of final loaf volume and may provide a valuable measure to breeders in joint selection for optimal bread quality. Therefore, this modified extensigraph method seemed to be better than the standard method or at least a great alternative to it for wheat quality evaluation in terms of correlation of dough extension measurements with mixing and bake test traits.
TABLE V Correlation Coefficients (r) of Farinograph Dough Properties and Baking Tests with Dough Characteristics of Modified and Standard Extensigraph Methodsa 50-g Farinograph Test Time (min)
Dough Extension Characteristics
Develop Time (min)
Mix Stab (min)
MTI
Bake Test Breakdown (min)
Bake Mix Time (min)
Avg Loaf Vol (cm3)
Modified Method 30 30 30 30 30 30 60 60 60 60 60 60 90 90 90 90 90 90
Energy (cm2) Resistance (BU) Extensibility (mm) Max Resistance (BU) R/E Ratio Rmax/E Ratio Energy (cm2) Resistance (BU) Extensibility (mm) Max Resistance (BU) R/E Ratio Rmax/E Ratio Energy (cm2) Resistance (BU) Extensibility (mm) Max Resistance (BU) R/E Ratio Rmax/E Ratio
0.60** 0.79*** –0.21ns 0.73*** 0.77*** 0.78*** 0.60** 0.84*** –0.54* 0.71*** 0.83*** 0.75*** 0.45* 0.80*** –0.65*** 0.64*** 0.84*** 0.75***
0.67*** 0.81*** –0.22ns 0.78*** 0.78*** 0.81*** 0.65*** 0.81*** –0.53* 0.77*** 0.78*** 0.78*** 0.61* 0.83*** –0.58** 0.71*** 0.80*** 0.74***
–0.57** –0.77*** 0.31ns –0.72*** –0.78*** –0.79*** –0.68*** –0.79*** 0.59** –0.82*** –0.78*** –0.83*** –0.65*** –0.79*** 0.58** –0.80*** –0.76*** –0.80***
0.69*** 0.81*** –0.16ns 0.79*** 0.76*** 0.81*** 0.75*** 0.85*** –0.53* 0.85*** 0.81*** 0.83*** 0.70*** 0.87*** –0.58** 0.81*** 0.83*** 0.80***
0.78*** 0.84*** –0.07ns 0.86*** 0.77*** 0.86*** 0.81*** 0.91*** –0.14ns 0.89*** 0.84*** 0.90*** 0.67*** 0.84*** –0.52* 0.72*** 0.81*** 0.73***
0.40* 0.44* –0.06ns 0.43* 0.39* 0.42* 0.73*** 0.58** –0.11ns 0.63** 0.47* 0.51* 0.73*** 0.59** –0.20ns 0.66*** 0.50* 0.53*
Standard Method 30 30 30 30 30 30 60 60 60 60 60 60 90 90 90 90 90 90
Energy (cm2) Resistance (BU) Extensibility (mm) Max Resistance (BU) R/E Ratio Rmax/E Ratio Energy (cm2) Resistance (BU) Extensibility (mm) Max Resistance (BU) R/E Ratio Rmax/E Ratio Energy (cm2) Resistance (BU) Extensibility (mm) Max Resistance (BU) R/E Ratio Rmax/E Ratio
0.74*** 0.93*** –0.51* 0.90*** 0.91*** 0.93*** 0.34ns 0.93*** –0.89*** 0.77*** 0.96*** 0.92*** 0.01ns 0.87*** –0.86*** 0.74*** 0.93*** 0.90***
0.77*** 0.78*** –0.26ns 0.80*** 0.71*** 0.76*** 0.53* 0.80*** –0.68*** 0.76*** 0.77*** 0.79*** 0.26ns 0.77*** –0.68*** 0.76*** 0.76*** 0.78***
–0.69*** –0.74*** 0.30ns –0.74*** –0.70*** –0.73*** –0.58** –0.78*** 0.67*** –0.81*** –0.74*** –0.81*** –0.36ns –0.79*** 0.67*** –0.82*** –0.72*** –0.78***
0.82*** 0.81*** –0.26ns 0.85*** 0.74*** 0.81*** 0.61** 0.84*** –0.70*** 0.84*** 0.80*** 0.84*** 0.36ns 0.83*** –0.70*** 0.85*** 0.80*** 0.84***
0.82*** 0.83*** –0.27ns 0.87*** 0.77*** 0.84*** 0.76*** 0.87*** –0.36ns 0.85*** 0.83*** 0.85*** 0.39ns 0.81*** –0.71*** 0.68*** 0.82*** 0.78***
0.46* 0.43* –0.12ns 0.50* 0.38* 0.47* 0.58** 0.59** –0.40* 0.67*** 0.53* 0.61** 0.49* 0.62** –0.41* 0.68*** 0.55* 0.59**
a
MTI, mix tolerance index; *, **, ***, Significantly different at P < 0.05, P < 0.001, and P < 0.0001; ns, not significant.
Fig. 7. Relationship between area under the curve (W) measured with the modified method and the pup loaf volume (n = 31), significantly different at P < 0.0001. 588
CEREAL CHEMISTRY
Fig. 8. Relationship between area under the curve (W) measured with the standard extensigraph method and the pup loaf volume (n = 31), significantly different at P < 0.0001.
CONCLUSIONS Measurements of dough extension characteristics with this modified method are comparable to those generated by the standard extensigraph method. Therefore, this modified extensigraph method is a good alternative to the standard method and can be used to avoid limitations (sample size, testing time, throughput, dough preparation, and correlations of extension characteristics with dough mixing property and bake test) that the standard method has for wheat breeding programs. ACKNOWLEDGMENTS We would like to thank Guixiang (Lucy) Lu at USDA, Hard Winter Wheat Quality Lab in Manhattan, KS, for technical assistance and contributions for developing this method. We also thank the Wheat Quality Council for allowing us to use its flour samples and bake results for this experiment. LITERATURE CITED AACC International. 2000. Approved Methods of the American Association of Cereal Chemists, 10th Ed. Methods 08-01, 10-10B, 44-15, 46-30, 54-10, 54-21, and 54-40A. The Association: St. Paul, MN. Anderssen, R. S., Gras, P. W., and MacRitchie, F., 1997. Linking mathematics to data from the testing of wheat-flour dough. Chem. Austr. 64:3-5. Anderssen, R. S., Bekes, F., Gras, P. W., and Wood, J. T. 2004. Wheat flour dough extensibility as a discriminator for wheat varieties. J. Cereal Sci. 39:195-203. Bekes, F., and Gras, P. 2000. Small-scale dough testing as a breeding and research tool. Chem. Austr. 67:33-36. Bloksma, A. H. 1990a. Rheology of the breadmaking process. Cereal Foods World 35:228-236 and 959-960. Bloksma, A. H. 1990b. Dough structure, dough rheology, and baking quality. Cereal Foods World 35:237-255 and 960. Bloksma, A. H., and Bushuk, W. 1988. Rheology and chemistry of dough. In: Wheat Chemistry and Technology. Y. Pomeranz, ed. AACC International: St. Paul, MN. Davidou, S., Michon, C., Thabet, I. B., and Launay, B. 2008. Influence of shaping and orientation of structures on rheological properties of wheat flour dough measured in dynamic shear and in biaxial extension. Cereal Chem. 85:403-408. Dunnewind, B., Sliwinski, E. L., Grolle, K., and Vliet, V. T. 2004. The Kieffer dough and gluten extensibility rig—An experimental evaluation. J. Texture Stud. 34:537-560. Gras, P. W., Carpenter, H. C., and Anderssen, R. S. 2000. Modeling the developmental rheology of wheat flour dough using extension tests. J.
Cereal Sci. 31:1-13. Grausgruber, H., Schoggl, G., and Ruckenbauer, P. 2002. Investigations on the validity of the micro-extensigraph method to measure rheological properties of wheat doughs. Eur. Food Res. Technol. 214:79-82. Hoseney, R. C. 1994. Rheology of doughs and batters. In: Principles of Cereal Science and Technology, 2nd Ed. AACC International: St. Paul, MN. Janssen, A. M., Van Vlient, T., and Vereijken, J. M. 1996. Fundamental and empirical rheological behavior of wheat flour doughs and comparison with bread making performance. J. Cereal Sci. 23:43-54. Kieffer, R., Wieser, H., Henderson, M. H., and Graveland, A. 1998. Correlations of the breadmaking performance of wheat flour with rheological measurements on a micro-scale. J. Cereal Sci. 27:53-60. Kokelaar, J. J., Van Vliet, T., and Prins, A. 1996. Strain hardening properties and extensibility of flour and gluten doughs in relation to breadmaking performance. J. Cereal Sci. 24:199-214. Mann, G., Allen, H., Morell, K. M., Nath, Z., Martin, P., Oliver, J., Cullis, B., and Smith, A. 2005. Comparison of small-scale and large-scale extensibility of dough produced from wheat flour. Austr. J.Agric. Res. 56:1387-1394. Mann, G., Diffey, S., Allen, H., Pumpa, J., Nath, Z., Morell, M. K., Cullis, B., and Smith, A. 2008. Comparison of small-scale and large-scale mixing characteristics: Correlations between small-scale and large-scale mixing and extensional characteristics of wheat flour dough. J. Cereal Sci. 47:90-100. Mirsaeedghazi, H., Eman-djomeh, Z., and Mousavi, M. A. S. 2008. Rheometric measurement of dough rheological characteristics and factors affecting it. Int. J. Agric. Biol. 10:112-119. Nash, D., Lanning, S. P., Fox, P., Martin, J. M., Blake, N. K., Souza, E., Graybosch, R. A., Giroux, M. J., and Talbert, L. E. 2006. Relationship of dough extensibility to dough strength in a spring wheat cross. Cereal Chem. 83:255-258. Preston, K. R., and Hoseney R. C. 1991. Applications of the Extensigraph Handbook. F. Rasper and K .R. Preston, eds. AACC International: St. Paul, MN. Rosada, D. 2004. Dough strength: Evaluation and techniques. What’s Rising? Baking Institute Newsletter: San Francisco. Sliwinski, E. L., Kolster, P., Prins, A., and Van Vliet T. 2004. On the relationship between gluten protein composition of wheat flours and largedeformation properties of their doughs. J. Cereal Sci. 39:247-264. Tronsmo, M. K, Magnus, M. E, Baardseth, P., Schofield, D., Aamodt, A., and Fargestad, M. S. 2003. Commparison of small and large deformation rheological properties of wheat dough and gluten. Cereal Chem. 80:587-595. Weipert, D. 1990. The benefits of basic rheometry in studying dough rheology. Cereal Chem. 67:311-317. Zounis S., Quail J. K., and Ellison F. W. 1993. Modification of lveograph dough preparation method. Pages 273–277 in: Proceedings of 43rd Australian Cereal Chemistry Conference. RACI: Melbourne.
[Received June 3, 2009. Accepted August 22, 2009.]
Vol. 86, No. 5, 2009
589