directing me through the research has awarded me many values. ... Egypt's industrial zones (e.g.: New Port Said East Port, 10th of Ramadan City, etc.) in.
A MULTI-CRITERIA DECISION MAKING APPROACH FOR SELECTING INDUSTRIAL PROJECTS By
OMAR MOHAMED IBRAHIM AMER
A Thesis Submitted to the Faculty of Engineering at Cairo University In Partial Fulfillment of the Requirements for the Degree of
MASTER OF SCIENCE In
STRUCTURAL ENGINEERING
FACULTY OF ENGINEERING CAIRO UNIVERSITY GIZA – EGYPT SEPTEMBER 2010
TABLE OF CONTENTS Page LIST OF FIGURES …...…………………………………………..………………………….. vii LIST OF TABLES ……………………………………………...……………………….…… viii ACKNOWLEDGMENTS ……………..……………………..……..…………………………. x ABSTRACT …………………..……………………..……………………………..….……….xii
CHAPTER 1. INTRODUCTION ……………………………………………………………... 1 1.1 General ………………………………………………………………………………………. 1 1.2 Problem Definition …...……………………………………………………………………… 1 1.3 Research Objectives …………………………………………………………………………..2 1.4 Research Methodology ...……………………………………………………………………. 2 1.5 Thesis Organization …………………………………………………………………………. 4
CHAPTER 2. LITERATURE REVIEW…………………………………………………….. 5 2.1 General……………………………...………………………………………………………... 5 2.2 Multi-Criteria Decision Making Techniques ………………..………………………………. 5 2.2.1 Superiority and Inferiority Ranking Method – SIR……………..…………………. 5 2.2.2 Analytic Hierarchy Process – AHP ………………………………………………. 10 2.2.3 Weighted Sum Model – WSM ………………………...…………………………. 13 2.3 Multi-Criteria Decision Making Applications ……..…….…...…………………….……… 16 2.4 Industrial Projects: An overview …………….…………………………………………….. 17 2.4.1 Objectives of Establishing Industrial Zones ………..……………………………. 17 2.4.2 Principals and Criteria for the Selection of Industrial Zones Locations …………. 19 2.5 Summary……………………………………………………………………………………. 20
CHAPTER 3. INDUSTRIAL PROJECTS SELECTION FACTORS …………...……… 21 3.1 General ……...……………………………………………………………………………… 21 3.2 Factors Identification …..…………………………………………………………………... 21
3.3 Determination of Relative Factors …..…………………………………………………..…. 23 3.4 Analysis of Questionnaire Responses …………..………………………………………….. 23 3.5 Determination of Factors’ Importance ……………………………………………………... 27 3.6 Determining Factors’ Weights ………………………….………………………………….. 28 3.6.1 Simos’ Procedure ..……………………………………………………………….. 30 3.6.2 Relative Importance Questionnaire ..……………………………………………... 32 3.6.3 Analysis of Relative Importance ………..………………………………….…….. 34 3.6.4 Getting Factors’ Weights ………………...………………………………………. 37 3.7 Summary……………………………………………………………………………………. 40
CHAPTER 4. REACHING AN ALTERNATIVE….……………………………………… 41 4.1 General ………...…………………………………………………………………………… 41 4.2 Acquiring Values of Factors………………………………………………………………... 41 4.3 Ranking Technique – Weighted Sum Model……………………………………………….. 45 4.4 Ranking of Alternatives ………………………..…………………………………………... 47 4.5 Summary …………………………………………………………………………………… 56
CHAPTER 5. SENSITIVITY ANALYSIS………………………………………………….. 57 5.1 General ……………...……………………………………………………………………… 57 5.2 Absolute and Relative Approaches ………………………………………………………… 57 5.3 Determining Most Critical Criterion…………..……………………………………………. 58 5.3.1 Processing Most Critical Criterion – Absolute Terms……………………………. 60 5.3.2 Processing Most Critical Criterion – Relative Terms…………………………….. 61 5.3.3 Criticality Degrees and Sensitivity Coefficients………………………………….. 63 5.4 Monitoring Change in Weights of Criteria…………………………………………………. 65 5.5 Most Critical Measure of Performance …………………………………………………….. 81 5.6 Summary …………………………………………………………………………………… 88
CHAPTER 6. CONCLUSIONS AND RECOMMENDATIONS …………………….…… 89 6.1 Summary and Conclusions …………………..…………………………………………….. 89
6.2 Recommendations for Future Research ………….………………………………………… 90
REFERENCES………………………………………………………………………………... 91 APPENDICES………………………………………………………………………………… 95 Appendix A: Questionnaire I – Getting importance of factors ………………………………… 96 Appendix B: Filtering the gathered factors ……………………………………………..…..… 100 Appendix C: Questionnaire II – Getting relative importance of factors ……………………… 108 Appendix D: Microsoft Visual Basic 6.5® – Code Directory ………………………………… 113
LIST OF FIGURES
Page Figure 1.1: Methodology flowchart …….…………………………………………….................. 3
Figure 2.1: Partial and complete ranking in SIR (Marzouk 2008a) …...………………………… 6 Figure 2.2: Generic hierarchy structure (Bhushan and Rai 2004) ……………………………....11
Figure 3.1: Preliminary list of factors……………………………………………………………22 Figure 3.2: Analysis of questionnaire responses according to years of experience……………...24 Figure 3.3: Analysis of questionnaire responses according to field of experience ……………...25 Figure 3.4: Analysis of questionnaire responses according to profession……………………….26
Figure 4.1: Factory number 1 ……………………………….…………………………………...42 Figure 4.2: Factory number 3 – General view ……………….………………………………….43 Figure 4.3: Factory number 3 – Separate section …………….…………………………………43 Figure 4.4: Factory number 3 – CTC machine …………….……………………………………44 Figure 4.5: Factory number 3 – Machine ………………………….……………………….........44 Figure 4.6: Factory number 3 – General view ……………….………………………………….45
Figure 5.1: Weights of Criteria – Scenario I ……………….……………………………………67 Figure 5.2: Weights of Criteria – Scenario II ……………….…………………………………..69 Figure 5.3: Weights of Criteria – Scenario III ……………….………………………………….74 Figure 5.4: Weights of Criteria – Scenario IV ……………….………………………………….78
LIST OF TABLES Page Table 2.1: Generalized criteria (Brans et. al. 1986) ……………………...……………………….7 Table 2.2: Scale of pairwise comparison (Saaty 1980) ………………………..………………...11 Table 2.3: Typical pairwise matrix ……………………………………………………………...12 Table 2.4: Typical decision matrix ……………………………………………………………...14 Table 2.5: Decision matrix for the numerical example on the WSM (Figueira and Roy 2002) …………………………………………………………………………….15 Table 2.6: Final preferences (Figueira and Roy 2002) ………………………………………….15 Table 3.1: Importance frequency of gathered factors …………………………….…………..…29 Table 3.2: Presentation of the information given by the set of cards (Figueira and Roy 2002)…………………… …………………………………………………….....31 Table 3.3: Converting the ranks into weights by using Simos’ procedure (Figueira and Roy 2002) ………………………………………………………………………….…33 Table 3.4: Resultant of the second questionnaire responses …………………………………….35 Table 3.5: Modified resultant of the second questionnaire responses …………………………..37 Table 3.6: Determining weights of factors – Economic cluster …………………………………38 Table 3.7: Determining weights of factors – Socio-Economic cluster ………………………….38 Table 3.8: Determining weights of factors – Environmental cluster ……………………………39 Table 3.9: Determining weights of factors – Main clusters …………………………….…….…39 Table 3.10: Weights distribution …………………..…………………………………………….40 Table 4.1: Typical decision matrix ……………………………………………………………...46 Table 4.2: Decision matrix (project criteria Vs different possible alternatives) …………...……48 Table 4.3: Exposition of criteria ……………………………………………………………...…49 Table 4.4: Industrial Classifications (Aldaly 2009, Gad 2001) …………………………………50 Table 4.5: Limits of industrial classification according to volume (Gad 2001) ……………...…51 Table 4.6: Normalized decision matrix ………………………………………………………….53
Table 4.7: Weighted normalized decision …………………………………………………..…..54 Table 4.8: Final preferences and ranking ……………………………………………………..…55 Table 5.1: All possible δk,i,j values (absolute change in criteria weights) …………………….…62 Table 5.2: All possible δ/i,j,k values (relative change in criteria weights) ………………….……63 Table 5.3: List of criticality degrees …………………………………………………………….64 Table 5.4: List of sensitivity coefficients …………………………………………………….….64 Table 5.5: Weights of criteria – Scenario I ………………………………………………….…..66 Table 5.6: Weights of criteria – Scenario II ……………………………………………………..68 Table 5.7: Final preferences and ranking – Scenario II …………………………………………69 Table 5.8: All possible δk,i,j values (absolute change in criteria weights) – Scenario II ………...70 Table 5.9: All possible δ/i,j,k values (relative change in criteria weights) – Scenario II …………71 Table 5.10: Weights of criteria – Scenario III ……………………………………………….….73 Table 5.11: Final preferences and ranking – Scenario III ……………………………………….74 Table 5.12: All possible δk,i,j values (absolute change in criteria weights) – Scenario III ………75 Table 5.13: All possible δ/i,j,k values (relative change in criteria weights) – Scenario III ………76 Table 5.14: Weights of criteria – Scenario IV ……………………………………………….….77 Table 5.15: Final preferences and ranking – Scenario IV ……………………………………....78 Table 5.16: All possible δk,i,j values (absolute change in criteria weights) – Scenario IV ……...79 Table 5.17: All possible δ/i,j,k values (relative change in criteria weights) – Scenario IV ……....80 Table 5.18: Summary of scenarios (A) ……………………………………………………….…80 Table 5.19: All possible absolute critical measures of performance ……………………………82 Table 5.20: All possible relative critical measures of performance …………………………..…83 Table 5.21: Given ranges for Microsoft Visual Basic 6.5® …………………………………...…83 Table 5.22: All possible absolute critical measures of performance – Scenario II …………...…84 Table 5.23: All possible relative critical measures of performance – Scenario II ……………....85 Table 5.24: All possible absolute critical measures of performance – Scenario III ………….....85 Table 5.25: All possible relative critical measures of performance – Scenario III …………..….86 Table 5.26: All possible absolute critical measures of performance – Scenario IV ………….…86 Table 5.27: All possible relative critical measures of performance – Scenario IV ……………..87 Table 5.28: Summary of scenarios (B) ………………………………………………………….87
To my beloved Father, Mother, Sister and my future Family.
ACKNOWLEDGEMENTS I would like to express my full thankfulness to my teacher & direct academic advisor Dr. Mohamed Mahdy Marzouk, Associate Professor, Structural Engineering Dept., Cairo University, for his proficient supervision and for his insistence in assisting me to deliver a well developed thesis. His wisdom in directing me through the research has awarded me many values. He knows when to provide me with the assisting material and when to let me dig by myself. I would also like to thank my main academic advisor Prof. Moheeb El-Said, Professor of Construction Engineering and Management, Cairo University, for his enhancements, friendly cooperation and continuous encouragement. Special thanks to Prof. Faisal Abdel Maksoud, Professor of Urban Planning & formerly Head of Architectural Engineering Dept., Monufia University, for his constant feedback. He was extremely helpful and an informative reference indeed. I would also like to thank my former colleagues & senior supervisors at Dar Al-Handasah Consultants for their time in the first place and their response whenever I needed them. I would like to continue my appreciation to Mr. Omar Azzam, Chief Pre-Contracts Services, Mr. Hatem El-Gamal, Project Manager, Mr. Hatem Mourad, Project Manager, three at the Project Management Dept., and Prof. Sherif Wissa, Director of Geotechnical & Heavy Civil Engineering Dept., for their keenness to suggest & propose, and also for their instantaneous responses even if they are outside the country! Too generous of them. This is a good opportunity to thank Prof. Mohamed Emam, Head of Construction & Building Engineering Dept., Arab Academy for Science and Technology and Maritime Transport (AAST), for accepting to be among the examining committee. Also, for his fatherly guidance and sponsorship particularly in the undergraduate phase, which had an evident impact in my postgraduate studies and even extended to my professional career. I gained a lot from his fruitful discussions. I truthfully acknowledge any other individuals, entities or factories for the information they provided in order to make this research possible. Finally, I would like to express my deepest gratefulness and my sincerest gratitude to my Father Prof. Mohamed I. Amer, Professor of Geotechnical Engineering, Cairo University, and my Mother. Without their permanent support, encouragement, patience and advices all the way since the very beginning of my postgraduate studies, I would have never completed this research. There are no thanking words that can express my appreciation. They suffered a lot with me & I definitely owe them a lot. Thank you my precious beloved parents.
Omar Amer
ABSTRACT A feasibility study is basically a preliminary study. It is conducted in a stage prior to design, procurement and construction stages in order to determine the viability of project undertaken by an investor. This helps the investor in deciding whether s/he want to proceed with the project or not. The feasibility study needs to answer the question: “Does the idea make economic sense?” Multi-Criteria Decision Making process can be considered a part of the feasibility study.
Wrong decisions – in general – cause undesired losses. Wrong decisions for industrial projects cause even huge undesired losses. These losses might be in a form of money, land, assets or even jobs. In industrial projects, wrong decisions might lead to bankruptcy of crucial economic entities. Private investors might have good initiative and the capital to construct economically successful projects but they might either select the inappropriate type of industry that might turn the investment to a failure or might not include some important/crucial considerations into account. This research targets private investors (foreign or local) who have investment intentions in Egypt and aids them to select the most suitable/appropriate industrial project to be constructed in Egypt’s industrial zones (e.g.: New Port Said East Port, 10th of Ramadan City, etc.) in order to invest their capitals. This research presents a key-list of gathered factors that are considered the important factors and affect the selection of industrial projects. Importance, relative importance and weights of these factors are determined using Simos’ procedure. Five case-studies of industrial projects have been chosen. The keylist has been applied on the five case-studies and a Weighted-Sum Model (WSM) has been selected as a MCDM technique in order to acquire their final preferences, rank them and consequently come-up with the most preferred/suitable alternative to be constructed. Then, a sensitivity analysis has been performed to determine the most critical criterion of the key-list. Additionally, several scenarios have been processed to verify that the most important criterion of the key-list does not necessarily be the most critical criterion. Moreover, the sensitivity analysis also determines the most critical measure of performance assembled from the five case-studies.
CHAPTER (1)
INTRODUCTION
CHAPTER 1 INTRODUCTION 1.1 General Multi-Criteria Decision Making has taken massive concern in the research field over the past few decades. This reflects how important this issue is since its early conception. Decision making, in general, is intruding our life in nearly all scales even through simple decision making processes like in buying simple things such as a car or a laptop. When the number of factors/criteria which affect the decision making process increase to make it more complex, it is then considered multi-criteria decision making process.
1.2 Problem Definition Wrong decisions – in general – cause undesired losses. Wrong decisions for industrial projects cause even huge undesired losses. These losses might be in the form of money, land, assets, loss of jobs or shredded families. In industrial projects, wrong decisions might lead to bankruptcy of crucial economic entities as well as bankruptcy of banks and might expand to be rated as crimes, as in Waste of Public Money. How many have we seen industrial projects that have not recorded economic success after operation? How many have we seen huge industrial projects that have not even come to a complete construction? Taking into consideration that obviously a feasibility study should have been well prepared prior to any further procedures. There exist a type of private investors that might have the good initiative and the capital to construct economically successful projects but they might either select the inappropriate type of industry that might turn the investment to a failure or might not include some important/crucial considerations into account. This
research
targets
private
investors
(foreign
or
local)
who
have
investment
intentions in Egypt and who are confused in searching for the most suitable/appropriate industrial project to be constructed in Egypt’s industrial zones (e.g.: New Port Said East Port, 10th of Ramadan City, etc…) in order to invest their capitals.
1
CHAPTER (1)
INTRODUCTION
1.3 Research Objectives This research is proposing a methodology for selecting industrial projects. To achieve this main objective, the following sub-objectives will be achieved: 1) Create a short-list/key-list containing the most important factors on which the decision of the private investor in solving the problem defined earlier will be based. 2) Develop a multi-criteria decision making approach that can rank the alternatives of the possible industrial projects. 3) Apply sensitivity analysis from which we can conclude: a. The most critical criterion. b. The most critical measure of performance.
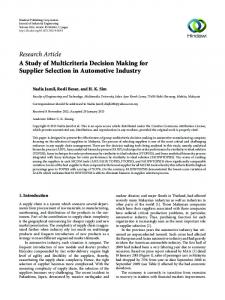
1.4 Research Methodology Eleven stages have been followed in order to conduct the research. These stages are: 1) Gathering the factors that affect industrial projects and cluster them. 2) Getting the importance of each factor. 3) Filtering the gathered factors. 4) Getting the relative importance for the factors. 5) Performing the final refinement before proceeding. 6) Checking if the existing factors are reliable (consistent & measurable). 7) Determining weights of factors. 8) Getting actual values/figures for the factors for several industrial projects. 9) Applying a ranking technique in the decision matrix in order to rank the alternatives. 10) Performing necessary sensitivity analysis. These stages are best presented through the flowchart shown in Figure 1.1.
2
CHAPTER (1)
INTRODUCTION
Start
- Gathering of factors - Categorization
Determine weights (Weighting Technique)
Getting importance of factors. (Questionnaire)
Get values for the factors, for different types of industries
Filter the gathered factors. (By eliminating the low importance factors)
Prepare Decision Matrix (Criteria Vs Industry alternatives)
Get relative importance. (Questionnaire # 2)
Rank alternatives (Using ranking technique)
Final refine
Performing sensitivity analysis
No
Are the existing factors consistent & measurable?
Research objective # 2 achieved
Yes
Research objective # 1 achieved
End
Figure 1.1: Methodology Flowchart
3
CHAPTER (1)
INTRODUCTION
1.5 Thesis Organization The research work presented in the next chapters is organized as follows:
Chapter (2) Literature Review, presents a review that includes an overview of different Multi-Criteria Decision Making techniques, their related topics and a snapshot on the industrial related material.
Chapter (3) Approach Formulation, explains how are the factors that affect the selection of the appropriate type of industry are gathered, how the gathered factors are filtered, the methodology of allocating local and global weights to the short-listed factors.
Chapter
(4)
Reaching
an
Alternative,
This
chapter
shows
how
the
possible
alternatives of industries are ranked and presents the ranking technique this is used to reach the most appropriate/preferred industrial project.
Chapter (5) Sensitivity Analysis, contains the analysis, mainly sensitivity analysis, for the results gained from ranking of types of industries comprised in determining the most critical criterion and the most critical measure of performance as well.
Chapter (6) Conclusions and Recommendations, presents the contributions proposed in the research along with the summary of the effort exerted in this thesis and recommendations for future research.
4
CHAPTER (2)
LITERATURE REVIEW
CHAPTER 2 LITERATURE REVIEW 2.1 General A dense literature review has been carried out in this research (from the author’s point of view). This literature review has passed through three main phases: i) Over-viewing the different Multi-Criteria Decision Making techniques being used in the research field, ii) Over-viewing the different applications related to MCDM techniques, iii) A general overview on industrial related material. These phases are described in the following subsections.
2.2 Multi-Criteria Decision Making Techniques Multi-Criteria Decision Making has taken massive concern not only in the near past but since long time ago as well. Every now and then, new MCDM technique appears and presents different way/method to reach a decision making solution until we had a truly wide diversity of developed MCDM techniques. Every MCDM technique has its advantages and its disadvantages; hence, this wide diversity needs to be reviewed in order to see which technique best fits the research problem presented earlier in the Introduction chapter.
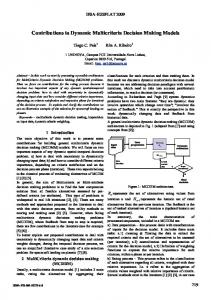
2.2.1 Superiority and Inferiority Ranking Method – SIR Superiority and inferiority ranking (SIR) method, proposed by (Xu 2001), is a generalization for the notations of superiority and inferiority scores defined by (Rebai 1993, Rebai 1994). It accounts for differences between criteria values and it allows using different types of generalization criteria. The SIR provides the ranking of alternatives either in a form of complete ranking or partial ranking. Figures 2.1-a and 2.1-b illustrate the procedure to rank alternatives using complete ranking and partial ranking, respectively.
5
CHAPTER (2)
LITERATURE REVIEW
Figure 2.1: Partial and complete ranking in SIR (Marzouk 2008a) As for the first step, a decision matrix called “D” is formed having the measured criteria (g1, g2, …, gn) and alternatives (A1, A2, …, Am).
D=
g1 (A1)
g2 (A1)
…
gn (A1)
g1 (A2)
g2 (A2)
…
gn (A2)
…
…
…
…
g1 (Am)
g2 (Am)
…
gn (Am)
Six generalization criterion types can be used to capture the characteristics of functions that represent the specified criteria (listed in Table 2.1). According to the decision maker’s attitude towards the preference structure and intensity of preference, the decision maker selects the generalized criteria (along with its associated parameters). The differences between criteria values are used to estimate the intensity of the preference of “A” over “A\” as per Equation 2.1: P(A, A/) = f(d) = f(g(A) – g(A\)) ……………………………………...……(2.1) Where P(A, A/) is the intensity of the preference of A over A/. As for the superiority and inferiority matrices, for each alternative Ai, the superiority index Sj (Ai) and inferiority index Ij (Ai), with respect to the jth criterion, are first calculated as follows:
6
CHAPTER (2)
LITERATURE REVIEW
Sj (Ai) = ∑ P(Ai, Ak) = ∑ fj (gj (Ai) - gj(Ak))………………………………...(2.2) Ij (Ai) = ∑ P(Ak, Ai) = ∑ fj (gj (Ak) - gj(Ai))………………………………...(2.3) The superiority and inferiority indexes are used to form superiority matrix (S-matrix) and inferiority matrix (I-matrix). S-matrix provides information about the intensity of superiority
of
each
alternative
on
each
criterion,
whereas,
I-matrix
provides
information about the intensity of inferiority.
Table 2.1: Generalized criteria (Brans wt. al. 1986)
The
superiority
and
inferiority
indexes
(arranged
in
S-matrix
and
I-matrix,
respectively) are aggregated into types of global preferences indexes: Superiority flow (S-flow) φ>(.) and inferiority flow (I-flow) φ(Ai) = ∑ wj Sj (Ai)………………………………………………………...(2.4) φ(Ai) = S- (Ai) / (S- (Ai) + S+ (Ai))…………………………………………(2.7) φ (Ai) – φ< (Ai)………………..………………………………...(2.17) φ r(Ai) = φ> / (φ> (Ai) + φ< (Ai)) …………………………………………..(2.18) As for the complete ranking, four complete ranking types are obtained from S-flow, Iflow, n-flow, r-flow. These are S-ranking (R>), I-ranking (R = {P>, I>}) is obtained based on the descending order of φ> (Ai) as follows: AiP>Ak iff φ> (Ai) > φ> (AK) ………………………..……………………..(2.19) AiI>Ak iff φ> (Ai) = φ> (AK) ……………………………...………………..(2.20) The I-ranking (R< = {P