A Multiobjective Genetic Algorithm for Automatic Orthogonal Graph Drawing [Track: Genetic Algorithms] Bernadete M. Mendonça Neta Department of Electrical Engineering Universidade Federal de Minas Gerais Belo Horizonte, MG, Brazil
[email protected]
Gustavo H. D. Araújo
Department of Electrical Engineering Universidade Federal de Minas Gerais Belo Horizonte, MG, Brazil
Frederico G. Guimarães Department of Electrical Engineering Universidade Federal de Minas Gerais Belo Horizonte, MG, Brazill
[email protected] [email protected] Renato C. Mesquita
Department of Electrical Engineering Universidade Federal de Minas Gerais Belo Horizonte, MG, Brazil
[email protected]
ABSTRACT
Categories and Subject Descriptors
We present a multiobjective hybrid technique for automatic orthogonal graph drawing. The new methodology combines the classical approach to automatic orthogonal graph drawings, the topology-shape-metric approach, and a multiobjective genetic algorithm based on the NSGA-II method. In the topology-shape-metric method, a fixed planar embedding is obtained in the planarization step and submitted to the orthogonalization and compaction steps, in this order. In the hybrid approach, a greater number of planar embeddings is explored by varying the order of edges insertion that forms the planar embedding in the planarization step. The problem is then formulated as a multiobjective permutationbased combinatorial optimization problem, considering the minimization of the number of crossings, the number of bends and the area of the drawing. Solutions on the estimated Pareto front represent different drawings, that can be stored and selected by the user in real-time. We illustrate a possible multicriteria decision making based on fuzzy decision. The results show that the hybrid methodology using NSGA-II is able to find good and diverse solutions, when compared to the traditional topology-shape-metric method.
G.1.6 [Numerical Analysis]: Optimization—global optimization, stochastic programming; G.2.1 [Discrete Mathematics]: Combinatorics—Permutations and combinations; G.2.2 [Discrete Mathematics]: Graph Theory—Graph algorithms
General Terms Algorithms, Design
Keywords Orthogonal graph drawing, multiobjective optimization, genetic algorithms, multicriteria decision making
1.
INTRODUCTION
Automatic graph drawing [6, 20, 17] is an important area of research concerning the study and development of automatic techniques for drawing graphs in different contexts. These automatic methods aim at providing a better way of visually representing data, information and relationships, considering the specific needs of each application domain. The topology-shape-metric methodology [2, 20] is a popular approach to automatic orthogonal graph drawing and consists of three main steps: planarization, where the edges sequence is defined around each vertex in a way that the number of crossings could be minimized; orthogonalization, where the bends of the edges are determined given the edges sequence; and compaction, where the coordinates of each element (vertices and bends) and the edges length are defined with the goal of satisfying a given aesthetic criterion, such as minimizing the total drawing area or minimizing the total sum of the edges length. However, problems related to graph drawings are generally very complex search problems. Patrignani discusses
Permission to make digital or hard copies of all or part of this work for personal or classroom use is granted without fee provided that copies are not made or distributed for prof t or commercial advantage and that copies bear this notice and the full citation on the f rst page. To copy otherwise, to republish, to post on servers or to redistribute to lists, requires prior specif c permission and/or a fee. GECCO’11, July 12–16, 2011, Dublin, Ireland. Copyright 2011 ACM 978-1-4503-0557-0/11/07 ...$10.00.
925
the complexity of the orthogonal compaction problem [18], showing that the search for high quality drawings from the point of view of readability and visibility is frequently associated to NP-hard problems. For this reason, such problems are solved through heuristics or metaheuristics, which do not always guarantee the best results, but make the problem tractable in practice. Minimizing the number of bends in all possible planar graph embeddings is also an NP-Hard problem [7, 18]. Garey and Johnson [13] show that minimizing the number of crossings in a planar graph is also NP-complete. When applying the topology-shape-metric, the final drawings are obtained by sequential steps, and solutions on each step affect the solutions on subsequent ones. This in turn directly affects the legibility and the visibility of the final drawing. In addition to the requirement of respecting the step sequence, the existing algorithms to solve the automatic graph drawing problem following the topology-shape-metric approach are based on a fixed planar embedding obtained in the first step, the planarization step [20]. However, a planar graph can have an exponential number of planar embeddings [7], each one impacting the next two steps in the process in a different way. In this paper we propose the use of a multiobjective genetic algorithm, namely the NSGA-II, for automatic orthogonal graph drawing based on the topology-shape-metric. We formulate the problem of searching for improved planar embeddings as a permutation-based combinatorial optimization problem. We employ the multiobjective genetic algorithm to solve this permutation-based problem, working on a population of individuals that represent permutations. Each permutation represents a different order of edges insertion for the planarization algorithm, which may represent a different planar embedding. In this way the multiobjective genetic algorithm is then able to evaluate properly the quality of different permutations by considering different aesthetic criteria. The main contribution of our methodology is the use of a multiobjective genetic algorithm for selecting a greater number of planar embeddings that lead to an optimized final drawing, taking into consideration preferences over the Pareto front. In many practical applications in graph drawing the generation of an optimized drawing takes time and much computational effort. Using the multiobjective approach, one can search for a distributed set of trade-off drawings for the graph (represented by vertices and edges previously stored in a data set) and make it available to the user. Since the preferences over aesthetic criteria are subjective, and usually not known a priori, the user can then select and evaluate drawings over the Pareto front a posteriori in real-time, without the need of generating an optimized graph again. That is one advantage of using a multiobjective approach for automatic graph drawing. In our results, we apply multicriteria decision making in a fuzzy environment to find a harmonious1 solution in the final Pareto solution set, considering the three aesthetic objectives (they will be described in section 2). Nonetheless, the user can modify the importance of each objective in the fuzzy decision making, selecting another result in the Pareto set. A mono-objective approach using the genetic algorithm
and the weighted sum of the objectives, presented in a previous work [16], has the following drawbacks: • Perhaps the main difficulty in using the weighted sum of the objectives is related to the selection of the weights, which may be a cumbersome task. • Moreover, if the user is not satisfied with the final result, (s)he needs to change the weights and run the optimization process again, which might require considerable time depending on the graph size. Therefore, changing preferences over the visualization of the graph in real time would be difficult to manage. For this reason it was necessary to develop a methodology that simultaneously finds some trade-off solutions, leaving the decision to the user, in a posteriori way. Our works differ from previous ones in the literature firstly by focusing on orthogonal graphs on a grid, since previous work on genetic algorithms for graph drawing has been directed to hierarchical graphs or non-orthogonal graphs (see for instance [1, 15]), and secondly by proposing a new approach for this problem based on the topology-shape-metric approach and soft computing techniques. The problem of searching for an improved planar embedding is formulated as an integer permutation-based combinatorial problem, and solved applying the multiobjective genetic algorithm using suitable operators for permutation representations [8], as well as the multicriteria decision making in a fuzzy environment [19] based on the Bellman-Zadeh approach [3]. The results illustrate the benefit of the proposed hybrid approach for automatic graph drawing. The experiments show that our approach can indeed find improved final drawings, better than those achieved by the typical methods based on the topology-shape-metric approach.
2.
BACKGROUND
The topology-shape-metric approach was first introduced by [2] and it was widely discussed and improved in [20]. The topology-shape-metric considers only orthogonal drawings on a grid (drawings whose edges are drawn with only horizontal and vertical lines and orthogonal bends). The final drawing is obtained with three sequential steps: planarization, orthogonalization and compaction. Each of these steps is responsible for handling one or more aesthetic criteria, which are ultimately responsible for the final drawing quality. This quality is related to the degree of clarity and visibility in the drawing. The planarization step determines the drawing topology. In this step, the goal is to reduce the number of edge crossings as much as possible. The number of crossings in a graph is generally considered the main cause for the difficulty in understanding the graph. Planarity testing and planar embeddings construction have been extensively studied, with direct applications in a variety of areas including circuit layout, graphics, and computer aided design. Tollis et al. [20] present algorithms that are widely used today as techniques for planarity tests of the planar graph embeddings. These algorithms are based on incrementally building a planar graph embedding. In this case, a drawing or an intermediate representation is constructed by adding vertices and edges of a graph G. In the insertion of each edge in a subgraph or planarization G′ of G, a planarity test is done to check if its insertion maintains the planarity
1 Harmonious with respect to the levels of satisfaction of all goals.
926
of G′ . If the edge insertion creates an intersection with another edge of G′ , it is classified as a non-planar edge. Finally the non-planar edges are added one by one in order to minimize the crossings. This is done through the construction of the dual of the subgraph G′ , where the shortest path (with fewer edges) in the dual graph G′ from the faces incident to the vertices is found. The edge and the primal graph are drawn through this path and a dummy vertex is added at the point where the crossing occurs. This procedure is known as the planarization operation. Notice that this procedure represents a heuristic method for incremental planarization and for determining the sequence of edge insertion. Its algorithm, shown in [20], is reproduced here:
Algorithm Planarize Input: graph G; Output: planarization G′ of G; 1. Compute a maximal planar subgraph S of the input graph G, and partition the edges into “planar” and “non-planar”, as follows:
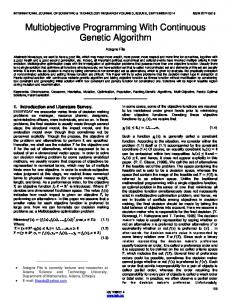
Figure 1: Graph G1 and three different planar embeddings of G1: E1, E2 and E3.
′
(a) Start with subgraph G consisting only of the vertices of G, but no edges; (b) For each edge e of G, if the graph obtained by adding e to G′ is planar, then add e to G′ and classify e as “planar”, else reject e and classify it as “nonplanar”.
3. 3.1
METHODOLOGY Multiobjective approach
As discussed in the previous section, the planarization step requires the order of the edges as input. Although the heuristic in the Algorithm Planarize is designed to reduce the number of crossings, the order in which the edges are inserted affects the final embedding produced by the algorithm, thus having an impact on the results obtained by the subsequent steps. For this reason, we formulate the problem of optimizing the overall graph drawing as an integer permutation-based optimization problem. A permutation represents the sequence of edges insertion, which is the input of the planarization algorithm. In this way, different permutations might result in different planar embeddings. Figure 1 illustrates how different permutations can lead to different planar embeddings. The three objectives of the problem are (i) minimizing the number of crossings, which is computed given the planar embedding produced in the planarization step; (ii) minimizing the number of bends, which is computed given the orthogonal representation H; and (iii) minimizing the total sum of the edges length, which is computed after the compaction step is performed. Notice that the evaluation of the three objectives for a given permutation requires the execution of the algorithms of the topology-shape-metric approach. In order to solve the problem, we employ a multiobjective genetic algorithm working on a genotype consisting in integer permutations. NSGA-II is a multiobjective genetic algorithm [5] which employs an elitist non-dominated sorting strategy. It works with the parent population Pt to generate the offspring population Qt as in conventional GAs. However, instead of finding the non-dominated front of Qt only, the two populations are combined together to form Rt = Pt ∪ Qt of size 2N , and then a non-dominated sorting is used to classify the entire population Rt . This strategy allows a global dominance check among the offspring and
2. Construct a planar embedding of the planar subgraph G′ , and the dual graph of S. 3. Add to G′ the nonplanar edges, one at a time, in order to minimize the number of crossings. This is done as follows for a nonplanar edge (u, v): (a) Find a shortest (least number of edges) path in the dual graph of the current embedding G′ from the faces incident to u to the faces incident to v; (b) Add the nonplanar edge and update G′ and its dual.
The orthogonalization step, according to the topology obtained in the previous step, is performed in order to shape the drawing, through an orthogonal representation H. The emphasis at this stage is to minimize the number of bends of the drawing, because human eyes can follow a straight line more easily than a zigzag line through the drawing. The minimization of bends in the drawing simplifies the graph in terms of its visibility. This problem is formulated as a minimum cost flow problem in a network [20]. The result of this step is called an orthogonal representation of the graph and it is taken to the next step. The compaction step receives an orthogonal representation H and determines the final coordinates of the vertices and bends in the drawing [20]. In this step, the goal is to minimize the drawing area or the total sum of the edges length.
927
order in which the values appear between those positions.
parent solutions. Each solution is separated by levels of dominance, now referred by Pareto fronts (Fi ). A fitness value is assigned to each solution according to the front it belongs. For solutions within the same front, a diversity measure called crowding distance is used. It takes into account how close the individuals are from their neighbors in the front. A higher value of crowding distance will result in better diversity in the population. The population Rt , now with size 2N , has to be accommodated into a population Pt+1 of size N . Each Pareto front is inserted while the size of Pt+1 ∪ Fi is less than N . For the last front to be inserted, the individuals are arranged in descending order of the crowding distance values, and only the best ones are used to fill the population Pt+1 . Parents are selected from the population Pt using binary tournament selection. The selected parents produce offspring through the application of suitable crossover and mutation operators, generating the population Qt . More details about the NSGA-II as well as the crowding distance procedure can be found in [4, 5].
3.2
For more details about the operators see for instance [8].
3.3
Algorithm Overview
The algorithm developed for this approach is described below: Algorithm TSM-NSGA-II Input: graph G; Output: an optimized planar drawing; 1. Generation of the initial population: N = number of individuals; (a) Generate at random the ordering of edge insertion for G (represented by an integer permutation);
Genetic Operators
In this work we formulate the problem of finding an optimal planar embedding for the graph as a permutation based combinatorial optimization problem. The problem is then solved with the multiobjective genetic algorithm (NSGAII), using suitable crossover and mutation operators. Our implementation employed the followings operators:
2. Computation of the objectives: i = 0; while ( i < N ) do (a) Submit solution i to the planarization step to obtain a planar embedding Γi and the number of crossings fX (si );
• binary tournament selection: In this selection process, two individuals are selected at random from the population and the fittest one is selected for reproduction.
(b) Submit the planar embedding Γi to the orthogonalization step to obtain the orthogonal representation H, and the number of bends fB (si ); (c) Submit the orthogonal representation H to the compaction step to obtain the final drawing and the total sum of the edges length fL (si );
• partially mapped crossover operator (PMX): Was firstly proposed by Goldberg and Lingle [14] as a recombination operator for the TSP problem and has become one of the most widely used operators for adjacency-type problems. Each offspring inherits a substring from one parent and the remaining elements are inherited from the other parent.
(d) i = i + 1;
3. Sort individuals according to the front they belong (F1 to Fn ), with F1 containing the non-dominated individuals;
• order crossover operator (OX): It was designed for order-based permutation problems. Two crossover points are randomly selected and the segment between them is copied to the offspring from the first parent. Starting from the second crossover point in the second parent, copy the elements to the offspring in the order they appear in the second parent, avoiding repetition. The second offspring is created in the same way, reversing the roles of the parents.
4. Calculate the crowding distance and fitness values for each individual in the population; 5. Apply the genetic operators for generating the offspring population. Each crossover operator (PMX or OX) for producing each offspring is selected with equal probability. The mutation operator to be used (scramble, swap, insert, and invert) for each offspring is also selected at random with equal chance;
• scramble mutation: This operator works by randomly selecting a subset of the individual and reorganizing the position of the alleles randomly.
6. Perfom elitist survival selection with Pt ∪ Qt to obtain Pt+1 ;
• swap mutation: This operator works by randomly picking two positions (genes) in the string and swapping their allele values.
7. Go to step 2 until the stop criterion is met;
• insert mutation: This operator works by randomly picking two alleles and inserting one right after the other.
In the next subsection we describe the fuzzy decisionmaking method, which can be applied to the final estimated Pareto set returned by the algorithm. This method can be used to select solutions that have greater harmony regarding the satisfaction levels of each objective.
• invert mutation: This operator works by randomly selecting two positions in the string and reversing the
928
3.4
Fuzzy decision-making
An important point in multicriteria decision making is the quality of the solution itself. It is considered high if the satisfaction levels of the objectives are equal or close to each other, giving rise to the so-called harmonious solutions, see [11, 12]. Some lack of clarity in the concept of an “optimal solution” usually arises when solving multicriteria problems. When applying the Bellman-Zadeh approach to decision making in a fuzzy environment [3] to solve multicriteria problems, this concept is defined with reasonable validity: the maximum degree of satisfaction for all goals serves as a criterion of optimality. When using fuzzy decision making, each objective function fi (x) can be replaced by a fuzzy objective function or a fuzzy set {x, µfi (x)}, where fi is one of the aesthetic criteria considered. The degree of satisfaction of all objectives is given by:
µD (x) =
m ^
µfi (x) =
i=1
min
i=1,2,...,m
µfi (x)
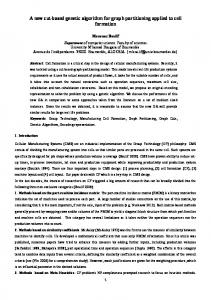
Figure 2: Computing time for the multiobjective genetic algorithm. • The population size is 30. First, we present results obtained with the classical approach that is the most popular technique used nowadays to solve orthogonal graph drawing problems. After that, we show the results for the classical approach by randomly varying the order of edge insertion in the planarization step and finally we show the results obtained with the hybrid approach using a multiobjective genetic algorithm (NSGA-II) and fuzzy decision making. These results are shown in the same table for comparison. Table 1 shows the results obtained with the classical approach, i.e., the topology-shape-metric (TSM) approach using the planarization heuristic suggested in [20] and described in section 2. It shows also the results obtained for the classical approach by randomly varying the order of edge insertion in the planarization step and also the results for the NSGA-II. In this table, V is the number of vertices in the graph, fX is the number of crossings obtained, fB is the number of bends, fL is the total sum of the edges length. In order to make a meaningful comparison, both the NSGAII and the random search have used the same number of evaluations. Since the NSGA-II returns a set of trade-off solutions, we employed the fuzzy decision making method to select a more harmonious solution in the set, which is the one used for comparison. It is important to emphasize that the methodology of multicriteria decision making in fuzzy environment returns the solution that shows balance in the satisfaction level of all the objective functions, reflecting the concept of harmonious solutions. This does not necessarily reflects the aesthetic degree of preferences of the user. Table 1 shows that the NSGA-II provides much better results on average than using the classical method. Moreover, The algorithm is able to find a trade-off set of good solutions in one single execution. Figure 2 shows on a logarithmic scale the computing time in seconds for the genetic algorithm according to the number of vertices. As we can see, the time spent for producing an optimized graph increases greatly with the size of the graph. This characteristic precludes any selection of preferences by the user in real time. One execution of the multiobjective approach is able to find a diverse set of trade-off alternatives, that can be visualized and chosen by the user in real time. Finally, we illustrate some graph drawings obtained with the NSGA-II. Figures 3 and 4 show results for (a) the classical approach and (b) the NSGA-II using fuzzy decision making for the cases with 50 and 100 vertices respectively.
(1)
Its use allows us to obtain a solution among the set of alternatives providing the maximum membership degree to the fuzzy set D: max µD (x) = max min µfi (x) x∈L i=1,...,m
(2)
reducing the decision making problem to the problem of finding x∗ = arg max min µfi (x)
(3)
i=1,...,m
In order to construct the membership functions µfi (x), i = 1, 2, . . . , m, reflecting the degree of minimization of the objective [19, 9, 10], we can employ the membership functions
µfi (x) =
max fi (x) − fi (x) x∈L
max fi (x) − min fi (x) x∈L
x∈L
λi
(4)
In (4), λi , i = 1, . . . , m are importance factors for the corresponding objective functions.
4.
RESULTS
The parameters used in our multiobjective genetic algorithm implementation are summarized here (crossover and mutation probabilities were set after some experiments): • Number of independent executions of the multiobjective genetic algorithm is 10. • As stop criterion, the genetic algorithm is executed until the best solution found is not improved for the last M generations. The value for M is arbitrarily chosen as a proportion of the number of vertices in the instance being solved. After some experiments, we have selected M = 10 for V ≤ 100 and M = 20 for 100 < V ≤ 500, where V is the number of vertices in the graph. • Crossover probability of 0.8 and individual mutation probability of 0.1.
929
Table 1: Results obtained by the Classical Approach (Topology-Shape-Metric) and the NSGA-II with fuzzy decision making. Test cases Stats Best Average StdDev 20 Best Average StdDev 30 Best Average StdDev 40 Best Average StdDev 50 Best Average StdDev 100 Best Average StdDev 150 Best Average StdDev 180 Best Average StdDev 200 Best Average StdDev 250 Best Average StdDev 500 Best Average StdDev V 10
Classical Approach fX fB fL 0 3 23 0 3 23 – – – 1 2 55 1 2 55 – – – 1 5 93 1 5 93 – – – 6 6 164 6 6 164 – – – 24 19 352 24 19 352 – – – 119 49 528 119 49 528 – – – 137 59 632 137 59 632 – – – 194 75 781 194 75 781 – – – 509 172 854 509 172 854 – – – 618 197 1144 618 197 1144 – – – 608 173 2748 608 173 2748 – – –
Random order fX fB fL 0 3 23 0 3 24 0.00 0.00 0.00 2 1 51 1 2 55 0.47 0.40 0.93 1 5 91 1 5 93 0.40 0.47 2.68 8 12 149 8 11 154 0.76 1.59 2.75 17 19 350 19 17 359 2.43 2.80 4.73 82 44 408 83 45 410 6.92 1.57 26.03 119 51 436 110 50 489 7.01 2.11 30.75 129 65 632 130 65 632 2.79 2.86 1.59 382 138 893 423 155 768 41.75 21.98 135.93 495 159 1175 497 170 1158 2.87 9.92 13.68 658 192 2148 609 201 2259 84.59 15.83 190.65
(a)
NSGAII with FDM fX fB fL 0 3 22 0 3 23 0.00 0.00 0.42 1 1 45 1 2 47 0.00 0.53 1.07 1 5 83 1 5 87 0.00 0.00 2.22 5 5 130 5 5 145 0.84 0.63 4.70 13 11 206 14 11 213 1.34 1.73 7.71 72 39 324 73 38 307 3.64 1.92 12.69 77 30 399 87 39 411 6.55 5.12 17.44 111 52 473 116 54 497 10.29 5.31 35.06 353 130 699 357 132 700 15.83 2.73 54.34 414 145 791 388 143 1049 44.19 9.58 134.55 317 102 1351 321 110 1359 3.71 7.86 7.06
(b)
Figure 3: Final drawings for the graph with V = 50: (a) drawing obtained with the classical approach, (b) drawing obtained with the multiobjective approach.
930
(a)
(b)
Figure 4: Final drawings for the graph with V = 100: (a) drawing obtained with the classical approach, (b) drawing obtained with the multiobjective approach.
(a)
(b)
Figure 5: Final drawings for the graph with V = 100: (a) drawing obtained with higher preference for the number of crossings (fx = 61, fB = 39 and fL = 313) (b) drawing obtained with higher preference for the number of bends (fx = 73, fB = 33 and fL = 283). Figure 5 (a and b) shows two different results considering different degrees of preferences in fuzzy decision making approach on the Pareto solutions set, using equation (4). In each case, we increased the degree of preference for one of the objectives, generating the different results shown in these figures. These results illustrate the benefits of the multiobjective approach, since it is possible to use the whole Pareto solution set as alternatives for graph visualization. For that, it is enough to use different preferences in the fuzzy decision making approach according to the user needs. The solution
set can be stored, becoming available in real time. As we can see, the NSGA-II algorithm was indeed capable of finding improved graph drawings with respect to the aesthetic criteria considered and it is able to provide a set of solutions allowing the users to select visualization preferences in real time.
5.
CONCLUSIONS
This paper presented results related to the application of the NSGA-II and multicriteria decision making in a fuzzy environment in automatic orthogonal graph drawing. This
931
hybrid methodology for automatic graph drawing is based on the topology-shape-metric methodology and multiobjective genetic algorithms. We formulated the problem of searching for improved planar embeddings to the next two steps in the process as a permutation-based combinatorial optimization problem, which is then solved using the multiobjective genetic algorithm. The computation of the goals uses the classical algorithms for the orthogonalization and compactions steps, leading to the values of the objectives, namely, the number of crossings, the number of bends and the total sum of the edges length. We applied the fuzzy decision making approach to choose the most harmonious individual in the final estimate of the Pareto front for each graph instance. The multiobjective genetic algorithm and fuzzy decision making approaches are able to select individuals which provide more harmonious solutions (in relation to the solutions obtained when applying the traditional topology-shape-metric approach) from the point of view of the aesthetic criteria that are usually adopted at the three steps of automatic graph drawing. The results illustrated the benefit of the proposed approach, especially for graphs with more than a few hundreds of vertices and edges. In these cases, the order of edge insertion in the planarization algorithm becomes even more relevant, and the multiobjective genetic algorithm (NSGA-II) is able to search for a trade-off set of solutions, evaluating the final quality of the drawing and therefore the impact of each step on the next one in the topology-shape-metric. Moreover, it is possible to say that a greater harmony of aesthetic criteria is indeed found in the final result. This is shown by the experimental results given in the paper. It is also important to emphasize that in this approach, the users will have a range of results in the Pareto front and that enables them to make their choices according to their preferences. Therefore, it is not necessary to run the whole process again to obtain new results such as in the weighted sum approach.
6.
[5]
[6]
[7]
[8]
[9]
[10]
[11]
[12]
[13]
[14]
ACKNOWLEDGMENTS
This work was supported by the following Brazilian agencies: National Council for Scientific and Technological Development (CNPq), and Research Foundation of the State of Minas Gerais (FAPEMIG, Brazil).
[15]
Bernadete M. M. Neta would like to thank Companhia Energ´etica de Minas Gerais (CEMIG), Brazilian power company headquartered in Belo Horizonte capital of Minas Gerais, for the flexibility of her working hours, allowing her the opportunity to dedicate to this Ph.D. research and to obtain the results of this work.
7.
[16]
[17]
REFERENCES
[1] A. M. S. Barreto and H. J. C. Barbosa. Graph layout using a genetic algorithm. In VI Brazilian Symposium on Neural Networks (SBRN), 2000. [2] C. Batini, E. Nardelli, and R. Tamassia. A layout algorithm for data flow diagrams. IEEE Transactions on Software Engineering, 12(4):538–546, 1986. [3] R. Bellman and L. Zadeh. Decision-making in a fuzzy environment. Management Science, 17(4):B141–B164, 1970. [4] K. Deb. Multi-Objective Optimization Using
[18]
[19]
[20]
932
Evolutionary Algorithms. John Wiley & Sons, Inc., New York, NY, USA, 2001. K. Deb, A. Pratap, S. Agarwal, and T. Meyarivan. A fast elitist multi-objective genetic algorithm: Nsga-ii. IEEE Transactions on Evolutionary Computation, 6:182–197, 2000. G. Di Battista, P. Eades, R. Tamassia, and I. Tollis. Annotated bibliography on graph drawing algorithms. Computational Geometry: Theory and Applications, 4(5):235–282, 1994. G. Di Battista, G. Liotta, and F. Vargiu. Spirality and optimal orthogonal drawings. SIAM Journal on Computing, 27(6):1764–1811, 1998. A. E. Eiben and J. E. Smith. Introduction to Evolutionary Computing. Natural Computing Series. Springer, 1st edition, 2003. P. Y. Ekel. Methods of decision making in fuzzy environment and their applications. Nonlinear Analysis: Theory, Methods and Applications, 47(5):979–990, 2001. P. Y. Ekel. Fuzzy sets and models of decisions making. Computer and Mathematics with Applications, 44(7):863–875, 2002. P. Y. Ekel and E. A. Galperin. Box-triangular multiobjective linear programs for resource allocation with application to load management and energy market problems. Mathematical and Computer Modelling, 37(1):1–17, 2003. P. Y. Ekel, M. Menezes, and f. Schuffner Neto. Decision making in fuzzy environment and its application to power engineering problems. Nonlinear Analysis: Hybrid Systems, 1(4):527–536, 2007. M. R. Garey and D. S. Johnson. Crossing number is NP-complete. SIAM Journal on Algebraic and Discrete Methods, 4(3):312–316, 1983. D. E. Goldberg and J. R. Lingle. Alleles, loci and the travelling salesman problem. In Proceedings of the First International Conference of Genetic Algorithms, pages 154–159. J.Grefenstette, 1985. P. Kuntz, B. Pinaud, and R. Lehn. Minimizing crossings in hierarchical digraphs with a hybridized genetic algorithm. Journal of Heuristics, 12:23–36, 2006. B. M. M. Neta, G. H. D. Ara´ ujo, F. G. Guimar˜ aes, and R. C. Mesquita. A hybrid genetic algorithm for automatic graph drawing based on the topology-shape-metric approach. In Proceedings of the Genetic and Evolutionary Computation Conference (GECCO 2010), pages 743–750. ACM Press, 2010. T. Nishizeki and S. Rahman. Planar Graph Drawing. Lecture Notes Series on Computing. World Scientific Publishing Company, 2004. M. Patrignani. On the complexity of orthogonal compaction. Computational Geometry, 19(1):47–67, 2001. W. Pedrycz, P. Ekel, and R. Parreiras. Fuzzy Multicriteria Decision-Making: Models, Methods, and Applications. John Wiley & Sons, 2010. I. G. Tollis, G. Di Battista, P. Eades, and R. Tamassia. Graph Drawing: Algorithms for the Visualization of Graphs. Prentice Hall, 1998.