Multiobjective Genetic Algorithm for a Graph Drawing Problem. Dana Vrajitoru. Indiana University South Bend. Computer and Information Sciences. South Bend ...
Multiobjective Genetic Algorithm for a Graph Drawing Problem Dana Vrajitoru Indiana University South Bend Computer and Information Sciences South Bend, IN 46617
Abstract In this paper we introduce an application of multiobjective optimization with genetic algorithms to the problem of graph drawing and explore the potential contribution of the genetic algorithm to solve this particular problem. Given a weighted graph, we want to find a geometric position of every vertex (layout) consistent with the weights in the graph. Among the possible solutions to this problem, we would also like to find one that follows a particular given shape or that has some geometric properties. Our paper shows that the genetic algorithms can help find an optimal solution both in terms of consistency and of shape.
Introduction The problem we focus on for this study is building consistent graph layouts for weighted graphs, in particular following a specified geometric shape. In this paper we explore the potential use of multiobjective genetic algorithms to this problem and various implementation aspects related to it. The graph theory represents an interesting challenge for the genetic algorithms (GAs) because many of the graph problems are NP-complete or generally hard to solve. The GAs can be a viable alternative to more traditional approaches, allowing the expression of a variety of constraints through the fitness function, especially when we want to improve on several criteria at the same time. Let us start from the assumption that a weighted graph represents a discretization of a geometrical object with a specific shape and topological properties. We would like to find a graph layout that is consistent with the weights in the graph and that also resembles the original shape of the represented object. Extensive work was accomplished on drawing unweighted graphs with emphasis on showing the structure of the graph in the geometrical representation. The bestknown heuristic for generating graph layouts is the spring algorithm (Di Battista et al. 1999), based on tension forces in the graph, which is essentially a hill-climbing method. Among the applications of these algorithms we can cite designing electronic circuits (Di Battista et al. 1999), designing web sites, and visualizing the content of the World Wide Web (Brandes et al. 2000).
Layouts presenting some aesthetic qualities are also a stated goal for this problem (Gajer and Kobourov 2002). Several authors have applied genetic and evolutionary algorithms to solve this problem (Tettamanzi 1998), (Branke, Bucher, and Schmeck 1997). The criteria used in these papers are equally aesthetic and can be translated into geometric constraints similar to those we are currently using in our research.
Force Based Algorithms The algorithms presented in this section are described in more detail in (Vrajitoru and El-Gamil 2006). A graph layout is an assignment of points to the vertices of the graph such that the edges are represented as line segments. The first aspect we try to address is finding a layout such that the length of each edge is equal to the weight of the edge. The second aspect we are interested in is, given that for many graphs, there is an infinity of possible solutions for the first criterion, is it possible can additional constraints help in finding the shape of the original graph layout? Problem. Let G = {(V, E), W } be an undirected, weighted graph where |V | = n, |E| = m, and W is the weight function. We must find a layout P : V → R3 such that ∀ u, v ∈ V, d (Pu , Pv ) = W (uv) (1) A layout with this property will be called a consistent layout for this graph. Some graphs have no solution, others that have a single solution (ignoring isometric transformations), and a large number of them have an infinity of non-isomorphic solutions. In the case of an infinity of solutions, we would like to find a particular one resembling a specified shape, as for example, a regular grid, an ellipsoid, or a torus.
Breadth-First Order Heuristic (BFH) Let u and v be two adjacent vertices in the graph. Suppose that they were assigned the geometric points Pu and Pv . Let us denote by erruv the error on the edge uv computed as the difference between the weight of the edge and the Euclidean distance between the two points erruv = W (uv) − d(Pu , Pv ). This error gives us an estimation of how much the points are misplaced with respect to each other if the weight of the edge represents the ideal distance
between them. We would like to find a layout that minimizes the total absolute error in the graph: X |erruv | (2) total error = ∀uv∈E
This algorithm follows the ideas from the the spring algorithm and most of the force-oriented methods. It starts with a random layout that is adjusted in a number of iterations to obtain one that is consistent. For every iteration, the algorithm repositions one vertex at a time to reduce the error on an incident edge. Let u and v be the two adjacent vertices and Pu and Pv the points assigned to them in the current layout. If the error on the edge uv is not equal to 0, we will adjust the position of the vertex v by assigning it a new point Pv′ determined in the following way: Pv′ = Pv + ε · unit(Pu~Pv ),
(3)
where ε is a constant, 0 < ε < 1. An iteration of the BFH modifies the position of all but one vertex in the graph according to (Equation 3). The algorithm starts with a randomly chosen vertex (origin), and it adjusts all the other vertices in the graph starting from this origin in a breadth-first order. The parameter ε allows us to control the amount of adjustment that is performed at each step and thus, decide on the convergence rate.
Tension Vector Heuristic (TVH) Let us suppose that we can construct a physical representation of the graph using interconnecting springs for the edges, as in the spring algorithm. Each spring corresponding to an edge has an initial length equal to the weight of the edge, and creates a contracting or extending force proportionate to the amount of deformation that was applied to it. TVH computes the total deformation forces in each point of the graph in the current configuration, and then moves all of the points in one step according to these forces. The operation is repeated for a number of iterations or until convergence. This will result in an equilibrium solution. We define the deformation force on the edge uv depends on the error on this edge, erruv . Then we can define the deformation force applied to the point Pv as F~uv = erruv unit(Pu~Pv ). The resulting force applied to the point A is then defined as: X ~u = R F~vu (4) ∀uv∈E
The point Pu is moved to a new location Pu′ defined as follows: PA′ = Pu + εR~u (5) where ε is a constant, 0 < ε ≤ 1. Both of these method have been shown to converged to consistent solutions, but were not successful in retrieving the original shape of the graph.
Repulsion Vector Heuristic (RVH) Many studies in graph drawing algorithms also propose to add repulsion forces to the tension vectors moving the vertices. Given two non-adjacent vertices in the graph, u and v, the repulsion force between them is given by Equation 6. The repulsion forces care also be scaled by ε. Rf (Pu , Pv ) =
Pu~Pv |Pu PV |d(Pu , Pv )p
(6)
In RVH, the repulsion forces are added to the tension forces defined for TVH. In all the results presented in this paper we used the value ε = 0.05, which was decided experimentally.
Genetic Representation and Multiobjective Fitness In this section we introduce the genetic representation of the consistent graph layout problem focusing on the precision of the solution.
Chromosome Representation and Genetic Operations Since a layout is composed of points with real coordinates, a real-encoded genetic representation is appropriate for this problem. Several real-encoded models for genetic algorithms have been proposed with more focus on the crossover operator (Ono and Kobayashi 1997), or the search space (Thutsui and Goldberg 2001). Our study focuses on a different aspect than these other approaches. To apply the GAs to our problem, we represent a graph layout as a chromosome. A layout is a string of Euclidean 3D points. The length of the string is equal to the number of vertices n. Each of the points is composed of three genes taking real values. The genes are initially generated randomly in a given boundary depending on the weights in the graph. We chose the uniform crossover with a swap probability established experimentally as the value 0.45. We have used a hybrid mutation for all of the results presented here. We call this mutation “hybrid” in reference to the fact that it is using a force based method combined to the classic genetic mutation. This tension vector mutation moves the 3 genes of a randomly selected point based on the tension vector resulting from all edges incident in that vertex as described in Equation 5, not taking the repulsion forces into consideration.
Multiobjective Optimization Goals and Fitness Experiments published in (Vrajitoru and El-Gamil 2006) have already proved that the GAs in combination with the force-based heuristics can yield to satisfying results in term of consistency of the solution with the weights in the graph. The focus of this paper, however, is on the geometric and aesthetic properties of the solution. Most graphs present an infinity of non-isomorphic solutions. It is a difficult task to select among these the ones with a particular geometric shapes, optimal from a visual point of
view. Preliminary experiments with the force-based heuristics show that even though the solutions are precise in terms of distances, the shapes are more or less random. Moreover, even though the repulsion vectors seem to improve the visual qualities of the solution, the shape is still not satisfactory while the precision of the solution decays when adding this component. Many of the known geometric shapes present geometric properties such as maximizing the enclosed surface or volume, as it is the case for spheres of any dimension. In this study we add such properties to the fitness function to see how they change the general shape of the solution. The first component of the fitness, FE , aims to minimize the total error in the graph and is computed the following way: 1 (7) Ferr = 1 + total error The following geometric constraints are added to improve the visual quality of the solution. Surface constraints consist in maximizing the surface occupied by the graph. The surface is computed by first selecting the essential cycles incident in each vertex using an algorithm presented in (Vrajitoru 2007), then by projecting and scan-converting each of them on a 2D matrix. The resulting measure, FS , is normalized with respect to the largest bounding box of the graph layouts in the current generation. Volume constraints are an approximation of the volume occupied by the graph layout by scan-converting all the edges in the tree dimensions and multiplying the results. More precise methods would be too time-consuming, but an improvement of this measure could be the object of future research. The resulting measure, FV , is also normalized in each generation. Angle constraints are also computed based on the essential cycles incident in each vertex. The measure aims to minimize the absolute difference between the angles in each cycle and the angles of a regular polygon with a number of edges equal to the cycle length. The total absolute difference DA is converted to a maximizing value in the interval 1 [0, 1], FA = 1+D . A Previous experiments using a simpler constraint of angle uniformity around a vertex, often cited as an aesthetic criterion, didn’t yield satisfactory results. For example, a vertex belonging to only two edges resulted in an angle of 180 degrees which is not suitable in many cases. The constraint we chose takes in consideration the local structure of the cycles incident in the vertex and performs generally better. Overlap constraints aim to minimize the overlap of the graph facets, also defined as the essential cycles incident in each vertex. The process of computing this value is similar to the surface measure. In this case, once the graph is projected and scan-converted to a 2D matrix, the algorithm will count the number of cells that have been hit more than once as a percentage of the total number. The total percentage of hits for one graph layout, totalhits is converted to a maximizing value in the interval [0, 1], FO = 1/(1 + totalhits ). This constraint is closely related to the popular criterion of minimizing the edge crossing. In the context where this
is computed by a scan-conversion and a discretization, the scan-conversion of the edges alone can miss some of the intersections because of discretization artifacts. The surfacebased overlap constraint also represents a refinement of the edge crossing, allowing us to distinguish cases of polygon overlap that would look the same in terms of border intersection.
Aggregate Function To combine two or more of these measures, first let us recap that all of them are converted to maximizing values normalized in the interval [0, 1]. The fitness is computed with the as a linear aggregate function (Jin, Okabe, and Sendhoff ) given by the formula F =
X
Ck Fk , k = E, S, V, A, O
(8)
where Ck are control coefficients or weights for each measure. We chose the coefficients for this study such that P Ck = 1. In the experiments presented in this paper, CE is always non-zero, so that all of our solutions aim to be consistent with the weights in the graph. In all of them, the coefficients are evenly distributed between the measures. For example, all the experiments involving the error and the surface measures have CE = 0.5 and CS = 0.5. If three measures are involved, all their coefficients will be 0.33. Different proportions of each measure could be the object of future research. In our experiments we built a number of generations of the GAs, extracted the best solution, and then applied to it an equal number of iterations of TVH. Technically, the aggregate fitness function leads to a reasonable solution according to all of the criteria for which the coefficients are not 0. TVH that follows it moves the solution further uphill on the consistency curve from that point. The result is a precise solution that is also visually better.
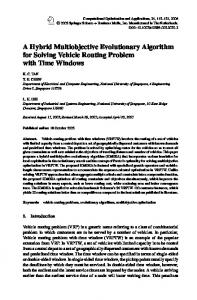
Test Problems We decided to focus our present research on easily recognizable shapes with regular structure. We have used the following sets of test problems: regular rectangular grids, regular polygons of variable number of vertices, the set of Platonic solids, and a particular 3D projection of the 4D hypercube or tesseract. The optimal solution for each of these problems is shown in Figures 1, 2, and 3.
Figure 1: Regular grids and polygons
Figure 2: Tetrahedron, cube, octahedron Figure 4: 4x4 grid, RVH left versus GA - surface and overlap right
Figure 3: Icosahedron, dodecahedron, hypercube
Experimental Results In this section we present some of the experimental results obtained with the force-based algorithms and with their combination with the GAs. First we discuss the optimal solution and how well the algorithms achieved it, and then some of the interesting suboptimal solutions.
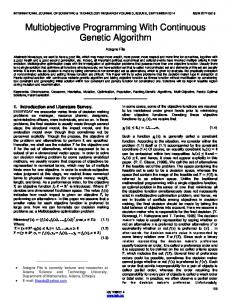
Figure 5: 10x10 grid, RVH left versus GA - surface and overlap right
Optimal Solution We have performed two sets of experiments, with and without the GAs. The first one consists in 2000 iterations of the force-based methods alone. The second set consists in 2000 iterations of the GAs with an aggregate fitness combining in equal measures one of the geometric constraints and the total error, followed by 2000 iterations of the tension vector algorithm. Even though the repulsion forces can improve the visual quality of the solutions, the tension vector method is the most efficient one in terms of consistency, which is the reason why we used it. This insures that the final layout is consistent with the weights in the graph. For some of the most difficult graphs we also ran some experiments combining two of the geometric constraints showing the best results and the total error. The population size was of 50 or 100, depending on the size of the graph. Figures 4 to 12 show a visual comparison of the best solution obtained by a force-based method alone with the one obtained by first applying the GAs. For the grids in Figures 4 and 5 we notice that while the solutions found by the force-based algorithms alone are arbitrary, the GAs were able to find an almost perfect solution for the 4x4 grid and a somewhat recognizable solution for the 10x10 grid. Larger grid structures, however, would require a different approach than simply increasing the number of iterations or the population size. The GAs were able to steer the solution towards a nearly optimal regular polygon for almost all of the polygons, as shown in Figures 6, and 7. Even the largest polygon with 20 vertices was found by the GAs in the form of an ellipse,
Figure 6: Decagon, RVH left versus GA - volume right
Figure 7: Icosagon, TVH left versus GA - surface right while the solutions derived by the force-based algorithms are again random. We have omitted the tetrahedron from these results because it is a graph with a unique solution and all the algorithms were able to find it. For the rest of the Platonic solids presented in Figures 8, 9, 10, and 11, the GAs were able to
Figure 8: Octahedron, RVH left versus GA - surface right
Figure 12: Hypercube, TVH left versus GA - surface and angles right Table 1: Total error for the decagon S GA
V
A
O
54.7978 3.5708 15.8573 10.5834
GA + TV 0.0013 0.0001 0.0001 BFH
TVH
0.0001
RVH
0.0000 0.0000 11.5308 Figure 9: Cube, TVH left versus GA - angles right to be more difficult than other shapes, but the solution derived by the GAs is recognizable, while that is hardly the case for the force-based heuristics alone.
Numerical Results
Figure 10: Icosahedron, BFH left versus GA - surface and overlap right
Figure 11: Dodecahedron, TVH (left) versus GA - surface (right) find an almost perfect layout for all of them except for the dodecahedron. Even for the latter, the best layout found by the GAs is still recognizable. The octahedron was found by both the force-based methods and by the GAs, but for the other graphs the force-based methods had a hard time isolating the optimal solution. Finally, the hypercube presented in Figure 12 turned out
In terms of consistency of the weights in the graphs with the distances between the vertices in the resulting layouts, the force-based heuristics without repulsion forces and the genetic algorithms combined with the tension vector method were able to produce solutions with less than 1% error. The RVH heuristic generally results in a solution that is visually better than the other force-based methods, but which is not as precise in terms of error. To exemplify this, Table 1 presents the total error in the solution first after applying only the GAs, then after the combination of GAs and the TVH, and then by applying only the force-based algorithms. From this table we can also notice that the surface constraint seems to be the most contradictory to the total error, and the opposite stands for the volume constraint. Even so, by improving the error in a solution that already has some surface maximization properties, we can obtain a layout that is optimal from both the point of view of the error and of the occupied surface. The quantity of numerical data for our simulations is limited by the fact that it is difficult to verify the quality of the solution other than visually. However, we summarize in this section the percentages of optimal and close to optimal solutions obtained by the GAs for each of our test problems. Tables 2 and 3 present a numerical interpretation of the quality of the solutions obtained by the various geometric constraints on the set of polygons and on the Platonic solids respectively. In each of these tables, the rows marked by Opt represent the percentages of optimal solutions, while those marked by Close, the percentage of solutions that are close
Table 2: Percentage of optimal and close to optimal solutions for the polygons Vertices
S V A O
5
Opt
10 0 20 20
5
Close 50 30 20 30
7
Opt
7
Close 80 50 30 20
10
Opt
10
Close 60 80 50 50
20
Opt
20
Close 40 40 40 30
10 0 20 20 0 20 0 10 0
0
0
Figure 13: Symmetric suboptimal solutions for the icosahedron (left) and for the heptagon (middle and right)
0
Table 3: Percentage of optimal and close to optimal solutions for the polygons Layout
S V A O
octahedron
Opt
octahedron
Close 0
0
cube
Opt
0 10 0
cube
Close 70 30 20 30
icosahedron
Opt
icosahedron
Close 50 10 10 10
dodecahedron Opt
70 40 10 20 0 0 0
0 0
0
0 0
0
0 0
dodecahedron Close 40 20 30 30 hypercube
Opt
0
0
0
0
hypercube
Close 30 10 20 10
to the optimal ones or at least recognizable. Such examples are Figures 11 and 12. The columns are denoted for the constraints related to the surface (S), the volume (V), the angles (A), and the overlap (O). Since this problem is largely based on a visual component, we can also inquire into other interesting shapes resulting as suboptimal solutions. The shapes generated by the GAs are in general more esthetically appealing than those found by the force-based heuristics alone, and they also highlight in some cases geometrical properties of the geometrical objects we aimed to reconstruct. These suboptimal solutions often show interesting properties of symmetry, as in the examples displayed in Figure 13 or some of esthetically interesting properties as shown in Figure 14.
Conclusions In this paper we presented a multiobjective optimization approach to the graph drawing problem using genetic algorithms. We aimed to design solutions that satisfy both the consistency of the weights with the distances in the graph
Figure 14: Suboptimal solutions for the icosagon layout and geometric constraints. In particular we were interested in extracting from the infinite set of solutions, those that resembled a given geometric object represented as the graph. We used a set of regular polygons and grids, the set of Platonic solids, and the hypercube as test cases for this study. The experimental results presented in Section clearly show that the GAs with the geometric constraints can significantly improve the visual quality of the derived solution. The geometric constraints that produce the best results vary from case to case. However, overall the best shapes are derived with a constraint maximizing the surface. Some of the more difficult problems, as for example the icosahedron, required the combination of two geometric constraints to find the optimal solution, maximizing the surface and minimizing the surface overlap. In terms of scalability, the GAs can also adapt better to larger problems than the force-based algorithms, as illustrated by the cases of regular polygons and grids. Future work will be conducted on even larger problems. In conclusion, in terms of simple consistency of the weight and the distances in the graph, the force-based algorithms are faster and more efficient because the problem is well-suited for gradient hill-climbing. However, to obtain particular geometric shapes that are visually pleasing or that present interesting geometric properties, the genetic algorithms are represent a better approach.
References Brandes, U.; K¨aa¨ b, V.; L¨oh, A.; and Wagner, D. 2000. Dynamic WWW structures in 3d. Journal of Graph Algo-
rithms and Applications 4(3):183–191. Branke, J.; Bucher, F.; and Schmeck, H. 1997. Using genetic algorithms for drawing undirected graphs. In Allen, J., ed., The Third Nordic Workshop on Genetic Algorithms and their Applications, 193–205. Gajer, P., and Kobourov, S. 2002. Grip: Graph drawing with intelligent placement. Journal of Graph Algorithms and Applications 6(3):203–224. Jin, Y.; Okabe, T.; and Sendhoff, B. Dynamic weighted aggregation for evolutionary multi-objective optimization: Why does it work and how? In Proceeding of the Genetic and Evolutionary Algorithms Conference (GECCO’2001), volume 2001, 1042–1049. San Francisco: Morgan Kaufmann Publishers. Di Battista, G.; Eades, P.; Tamassia, R.; and Tollis, I. 1999. Graph Drawing: Algorithms for the Visualization of Graphs. An Alan R. Apt Book. Upper Saddle River, NJ: Prentice Hall. Ono, I., and Kobayashi, S. 1997. A real-coded genetic algorithm for function optimization. In Proceedings of the 7th International Conference on Genetic Algorithms, 246– 253. Tettamanzi, A. 1998. Drawing graphs with evolutionary algorithms. In Proceedings of 1998 Conference on Adaptive Computing in Design and Manufacture, ACDM’98, 325– 338. Thutsui, S., and Goldberg, D. 2001. Search space boundary extension method in real-coded genetic algorithms. Information Sciences 133(3-4):229–247. Vrajitoru, D., and El-Gamil, B. 2006. Genetic algorithms for graph layouts with geometric constraints. In Proceedings of the IASTED Conference on Computational Intelligence (CI’06), 64–69. San Francisco, CA: IASTED. Vrajitoru, D. 2007. Facet detection and visualization of local structure in graphs. In Proceedings of the IASTED Conference on Graphics and Visualization in Engineerging (GVE’07), 89–94. Clearwater, FL: IASTED.