th
19 International Conference on Production Research
A MULTIPLE SINGLE-PASS HEURISTIC ALGORITHM FOR THE STOCHASTIC ASSEMBLY LINE RE-BALANCING PROBLEM * § R. Gamberini , A. Grassi, A. Regattieri
Dipartimento di Scienze e Metodi dell’Ingegneria, Facoltà di Ingegneria – Sede di Reggio Emilia, Università degli Studi di Modena e Reggio Emilia, Via Amendola 2 – Padiglione Morselli, Reggio Emilia, Italy §
Dipartimento di Ingegneria delle Costruzioni Meccaniche, Nucleari, Aeronautiche e di Metallurgia, Facoltà di Ingegneria, Università degli Studi di Bologna, Viale Risorgimento 2, Bologna, Italy
Abstract Assembly line re-balancing is a problem frequently tackled by companies, as continuous changes in product features and volume demand caused by the volatility of today’s markets produce assembly tasks redefinition and line cycle time fluctuations. Hence, managers have to adapt the balancing of their lines to accomplish with the new conditions, while trying to keep to a bare minimum increases in completion costs and in costs related to changes in tasks assignment. In particular, modifications in line balancing impact on operators training, equipment switching and moving, along with quality assurance. The stochastic assembly line re-balancing problem basically consists in a multi-objective problem where two objectives, total expected completion cost of the new line and similarity between the new and the existing line, have to be jointly optimized. In this paper, a multiple single-pass heuristic algorithm is consequently developed with the aim to find the most complete set of dominant solutions representing the Pareto front of the problem. Multiple single-pass procedures iterate the execution of single-pass algorithms, in order to generate a set of solutions, rather than to create a unique purpose. Given such a set, the best-performing solutions, in accordance with the multi-objective nature of the problem, are presented to the line designer, who selects the final assembly line balancing considering also additive factors that can be hardly inserted in a mathematical approach (i.e. simplicity of learning re-assigned tasks, time requested for the re-allocation of tools necessary for executing re-assigned tasks, experience requested for maintenance of tools necessary for executing re-assigned tasks). By means of a wide experimentation including comparisons with a multiobjective genetic algorithm, the behaviour of the proposed methodology is set and optimized. Keywords: Assembly line balancing problem, re-balancing, multi-objective. 1
INTRODUCTION Assembly line balancing optimization constitutes one of the most significant problems companies have to address, as most actual production systems present a final assembly phase where components are joined together to form the final product. Balancing procedures, widely proposed in literature, set assembly line behaviour, by defining stations workload so that both cycle time and technological precedence relationships constraints are satisfied, along with optimising some performance measures, such as line efficiency, the number of operators engaged on the line and the productivity rate. Nevertheless most of published papers disregard the problem of implementing frequent re-definitions of stations workload, in accordance with the necessity of following market requests regarding variations in products characteristics and/or productivity rate. Particularly, dynamic competitive environments induce the definition of agile assembly systems, able to efficiently respond to unpredictable events, since variations in customers requirements involve frequent line re-balancing, that is, changes in stations workload. When manual assembly lines are considered, redefinitions of stations workload are implemented by involving the re-assignment of tasks to operators engaged at each station. As a consequence, operators need training *
Corresponding author: R. Gamberini E-mail:
[email protected]
to perform the new requested tasks. Nevertheless, the learning process requires time and during the first phases involves errors. Hence, an increase in costs is produced, both in terms of training activities and equipment switching, along with quality assurance and line performances. As a matter of fact, these costs are directly related to the amount of tasks re-assignments. In this paper, a study concerning an innovative heuristic algorithm for solving the assembly line rebalancing problem is presented, with the aim of minimizing both assembly cost and tasks re-assignments produced by changes in product characteristics. 2
LITERATURE REVIEW The wide variety of ALBP solving procedures was reviewed by [1-8]. [5] highlight that the NP-hard nature of ALBP pushed most studies towards the definition of heuristic algorithms, classified in their paper in three categories. The first category consisted of single-pass procedures, where a prioritising list for task assignment was created according to a single attribute for each task. The second category consisted of multiple single-pass procedures, where different single-pass decision rules were adopted for generating a set of solutions. The bestperforming one was finally selected. The last category consisted of approaches improving an initial balancing,
including ameliorative heuristic procedures and evolutionary techniques (i.e. genetic algorithms (GAs)). Both multiple-single pass and evolutionary approaches aimed at exploring a wide variety of search directions in the solution space. Regarding the SMD ALBP, [9] compared single-pass, multiple single-pass and ameliorative algorithms along with optimum-seeking approaches with a time limit set to restrict the time allowed for each solution. The authors concluded that multiple single-pass and ameliorative algorithms outperformed single-pass procedures. Multiple single-pass heuristics for tackling the SMD ALBP were developed by [10-15], while [11] and [16] addressed the stochastic version of the problem, thus considering stochastic tasks performance times. GAs were proposed as ALBP solution procedures by [17-28], nevertheless only [21] solved the stochastic version of the problem. Despite the great attention paid to ALBP by scientists, only few published papers address the problem of re-balancing an existing line. This problem is particularly felt in present industrial contexts, as a consequence of the volatility and unpredictability of today’s markets which cause frequent changes in product features and volume demand, implying modifications in tasks, tasks performance times, and line cycle time. In particular, among works available in literature, only [29] pointed up the opportunity to consider tasks re-assignment as an objective function to minimize. The authors, focusing their attention onto single-model manual assembly lines, thus considering the stochastic version of the problem, emphasized how the re-balancing of an existing line is better modelled as a multi-objective optimisation problem where total expected completion costs are minimized and an index evaluating the similarity with the previous balancing is maximized. A multi-objective optimisation problem is generally not characterized by a unique optimal solution, that is, a solution which is better than the others with respect to every performance criteria considered. Frequently, a set of non-dominated solutions, each representing a local optima, is identified. Such a set is known as the Pareto front and each dominant solution belonging to it is characterized by the fact that no other better solution exists, regarding all the performance criteria. Hence, the assembly line rebalancing problem formulated as per [29] should be faced by finding the largest number of non-dominated solutions (i.e. line balancing), of good quality and widely distributed in the solution space, able to better represent the Pareto front. Such a solution approach is particularly interesting in real-life problems. Indeed, by providing to an analyst the most complete set of solutions representing the Pareto front allows him to make his final (unique) choice by selecting the particular solution which better interprets his feelings and, moreover, which accomplishes with some other practical constraints that, for complexity reasons, are not directly taken into account by the solution methodology. In this paper, a multiple single-pass heuristic algorithm is developed with the aim of solving the single model stochastic assembly line re-balancing problem. Since such an approach combines different heuristic rules during its run, a study is carried out to find the best rules combination with the aim of increasing the capability to find wide sets of solutions, well-representing the Pareto front. Moreover, a Multi Objective Genetic Algorithm (MOGA) to solve the same problem is also developed and compared with the aforesaid multiple single-pass heuristic, with the aim to obtain a strong representation of the actual capabilities of the proposed heuristic. In the following, a notation is reported. Section 4 summaries the model for evaluating the tasks re-
assignment. Sections 5 and 6 introduce the multiple singlepass and the GA algorithms for the assembly line rebalancing problem, respectively. Section 7 describes the experimentation carried out and the results obtained. Finally, in section 8 conclusions are reported. 3
NOTATION
μi
, ,N ; mean performance time of task i, for i = 1K cj constant positive weight, for j = 1, 2; cp crossover probability; C cycle time; EC expected completion cost; f(x) fitness value of the current solution; fmin (Ψ ) fitness value of the worst solution in the current population Ψ;
Fi * h I′i
set of direct and indirect successors of task i, with respect to M; parameter for controlling the local searches; incompletion cost of task i, for i = 1, K, N ;
Ii m mp M MSF N NE NP pi
total incompletion cost of task i, for i = 1, K, N ; number of stations; mutation probability; the precedence matrix; mean similarity factor of the line balancing considered; number of tasks; number of elite individuals to select from the elite set; number of individuals in each population; probability of not completing task i, for i = 1, K, N ;
P (x ) probability of choice in the selection procedure;
variable assuming values {−1, 1} according to the search direction (minimization or maximization) in the genetic algorithm; SFi similarity factor of task i, for i = 1, K, N ; TIBi set of tasks, other than i, assigned to the same station as task i in the initial balancing, for i = 1, K, N ; TNBi set of tasks, other than i, assigned to the same station as task i in the new balancing, for i = 1, K, N ; x, y solutions coded in chromosomes; wj random positive weight, for j = 1, 2. sj
4
THE MODEL FOR EVALUATING TASKS REASSIGNMENT As widely introduced by [29], the inputs of the single-model stochastic assembly line re-balancing problem are: • an initial balanced line assembling a product that needs a re-design or a substitution with a new item due to new requirements of the customers; • data characterizing tasks for obtaining the new item (number of tasks, precedence diagram describing relationships among tasks, mean performance tasks time, tasks time standard deviation, tasks incompletion cost); • cycle time requested for the new line. The proposed problem can be stated as follows. Given an initial line balance identifying the sets of tasks assigned to each station, re-balance the dedicated manual line, with respect to the new constraints, by minimizing two objectives: (i) the unit labour and the expected unit incompletion costs, and (ii) the tasks re-assignment. Particularly, since the main difficulty in practical cases is the precise estimation of costs related to all possible tasks movements, a weighted multiple objective function involving both completion and tasks movement related costs is not introduced. Rather, two separate objective functions, concerning expected completion costs and the degree of similarity between initial and new tasks assignments, are separately introduced. Two independent evaluations are addressed, leaving the interpretations of
th
19 International Conference on Production Research
the results to analysts, in accordance with their given guidelines. The first objective function, that is the expected assembly cost (EC), is evaluated as in equation (1), following considerations reported in [30, 31, 16]: N
EC = m ⋅ C + ∑ pi ⋅ Ii
(1)
i =1
where m is the number of stations in the new line configuration, C is the cycle time, pi is the probability of not completing task i in the assigned station, and I i = I i′ + ∑ I ′j is the total incompletion cost of task i [30], j ∈Fi *
which obviously considers the incompletion costs of both task i and its followers in the dependency diagram. The adopted formulation involves a little approximation in comparison to [31-33] models. Nevertheless, such an approximation is negligible for most assembly line operative conditions, i.e. when probability of an in-line N
completion is high. Moreover, the term
∑ pi ⋅ Ii
is simple
i =1
and speedy to evaluate, hence it is very useful in those algorithms where either large problems are solved or a set of potential solutions are proposed, as in the methodologies presented in this paper. To evaluate the second objective function (MSF), that is the degree of similarity between the initial and the new tasks assignment, the set of tasks, other than i, assigned to the same station as task i in the initial balancing (TIBi) and the set of tasks, other than i, assigned to the same station as task i in the new balancing (TNBi) are introduced. Hence, the Similarity Factor (SFi) of the generic task i is evaluated as in equation (2): Cardinalit y {{TIB i } ∩ {TNB i }} (2) SF i = Cardinalit y {TIB i } SFi is the ratio of number of tasks assigned to the same station as task i in the initial and in the new balancing to the number of tasks assigned to the same station in the initial balancing. The Mean Similarity Factor (MSF) between the new re-balanced line and the initial one is finally evaluated as in equation (3). N
MSF =
∑ SFi i =1
(3) N Particularly, higher MSF values address the choice of balances with less tasks movements. 5
A MULTIPLE SINGLE-PASS PROCEDURE FOR THE SINGLE-MODEL STOCHASTIC ASSEMBLY LINE RE-BALANCING PROBLEM As described in [4], a multiple single-pass procedure iterates the execution of a single-pass algorithm, with the aim of generating a set of solutions, among which the best-performing ones are finally selected. Particularly, the multi-objective nature of the stochastic assembly line re-balancing problem addresses the determination of the most complete set of non-dominated solutions wellrepresenting the Pareto front. The basis single-pass algorithm, after defining tasks belonging to the assignable tasks set, that is, those without unassigned predecessors and which mean performance time is not greater than the remaining station idle time, assigns tasks to station by means of a heuristic procedure probabilistically selected among those reported in the following (HP1, HP2, HP3, and HP4).
Heuristic procedure HP1 The heuristic procedure introduced by [29] is implemented. Particularly, assignable tasks are ranked in
accordance with the calculation of two attributes addressing the optimisation of the two aforementioned objective criteria. The first attribute evaluates the desirability in assignment with respect to the minimization of expected assembly cost. Hence three tasks groups are defined: • desirable tasks, are those tasks which anticipated labour savings in the specific considered position are greater than the expected incompletion costs. Hence, at each iteration, assigning an additional task i to the current station results in an expected cost saving of approximately μi on one hand, and an increase in expected incompletion cost of approximately pi ⋅ I i on the other. Consequently, desirable tasks are those which μi ≥ pi ⋅ Ii [16];
•
sure tasks, are those desirable tasks characterized by a likelihood of completion rate not less than 99.5%; • critical tasks, are those tasks that are not desirable. Hence (Attribute I )i , that is attribute I for task i, assumes the following values: • 3, if the task is critical; • 2, if the task is sure; • 1, if the task is desirable; in accordance with the necessity of firstly assigning critical tasks in empty stations, then sure tasks and finally those that are only desirable. The second attribute (Attribute II )i assumes the values of the similarity factor SFi (see equation (2)) computed with respect to the set of tasks already assigned in the current station. The aforementioned attributes are used as evaluation criteria in the TOPSIS technique, so as to identify the best assignment. If more than one operation assumes the highest rating, a selection procedure is implemented. The task with maximum number of immediate successors is chosen if they are all critical, the one with maximum incompletion cost, if they are all sure, the one with the minimum incompletion cost, if they are all desirable, the first in the list otherwise. Heuristic procedure HP2 Similarly to HP1, tasks belonging to the assignable tasks set are ranked in accordance with two attributes addressing the optimisation of the two aforementioned objective criteria. The first attribute evaluates the difference between expected cost saving and increment in expected incompletion cost if task i is assigned to the current station. The greater the difference, the more is preferable assigning tasks to a station by a costs minimisation standpoint. (Attribute I )i = μ i − pi ⋅ I i (4)
The second attribute (Attribute II )i assumes again the values of the similarity factor SFi, addressing the selection of operations with the highest value. Finally, TOPSIS evaluates the best assignment. Particularly, following considerations reported in Kottas and Lau approaches, no operation is selected if the current station is not empty and assignable tasks are all characterized by negative values of (Attribute I )i , since it is preferable creating a new station for minimizing EC.
Heuristic procedure HP3 Similarly to HP1 and HP2, two attributes are evaluated for each assignable task. Whilst the second attribute assumes the value of SFi, (Attribute I )i is defined in accordance with considerations reported in [16]:
•
tasks with consistent incompletion costs should be firstly executed, with the aim of reducing the incompletion probability pi; • tasks with low performance time should be firstly executed, since involve low increasing in the incompletion probability pi. Hence (Attribute I )i is evaluated as in equation (5):
(Attribute I )i
=
Ii
μi
(5)
The greater is (Attribute I )i the more is preferable assigning tasks in the early part of the station, otherwise the assignment is preferable in the latter part. Particularly, the early and the latter part of the station are defined considering that the idle time is greater or less than a given percentage of the cycle time.
Heuristic procedure HP4 The task for assignment is randomly selected among the assignable tasks. 6
A GENETIC ALGORITHM FOR THE SINGLE-MODEL STOCHASTIC ASSEMBLY LINE RE-BALANCING PROBLEM Analogously the proposed multiple single-pass approach, the genetic algorithm presented for solving the re-balancing problem was studied in such a way as to find a set of non-dominated solutions representing good compromises between the two considered objective functions. Specifically, the proposed algorithm is based on the approach developed by [34, 35], where a unique objective function with random weights is used to alter the influence of each objective belonging to it and to drive the search towards different zones in the solutions space, as shown in equation (6): Max f (x ) = s1 ⋅ c1 ⋅ w 1 ⋅ EC (x ) + s2 ⋅ c 2 ⋅ w 2 ⋅ MSF (x ) (6)
where x is the solution, sj can assume values {− 1, 1} according to the search direction (minimization or maximization), cj and wj are the constant and random (positive) weights respectively, EC and MSF are the total expected completion cost and the Mean Similarity Factor objectives, respectively. In our case, we will assign s1 = −1
and s2 = 1 since the EC has to be minimized while the MSF has to be maximized. As one can see, the weight of each objective is formed by two terms. The first represents a constant weight that, acting as a scale factor, is used to make comparable the variations of the objectives. The second is the random weight that is used to alter the relative importance of the different objectives during the iterations, then influencing the search direction. The weights wj have to be all positive and have to hold: (7) ∑ w j = 1. j
The behaviour of the different parts of the genetic algorithm is described in the following.
Solution coding In the specific case of ALBPs, each individual represents the sequence of the operations in the same order they are allocated to the stations in the line, even if it does not contain any information about the allocation itself. An assignment procedure is then introduced in the genetic algorithm to build, for each individual, the corresponding line. This step is required for the evaluation of the objective functions, since both the EC and the MSF are strictly dependent to the configuration of each station. In [18, 20, 23, 28], the line is built by adding tasks to each station until the sum of the performing times
exceeds the cycle time, accomplishing with the order they are reported in the chromosome. Even if [20] compared such an assignment procedure with other methods for allocating tasks to stations and demonstrated its outperforming in the deterministic ALBP, this approach can not be used in the stochastic ALBP because it would lead to huge values of the expected out-of-line completion costs. Hence, the proposed approach utilizes the marginal desirability concept developed by [30], which states that it is marginally desirable to assign an operation to the current station if the in-line completion cost is less than the expected out-of-line completion cost. Although this approach makes it possible to obtain good compromises between the two cost factors, it is too rigid to allow the genetic algorithm to search in the solution space as a whole. In fact, a strict adoption of the Kottas and Lau’s criterion forces the genetic algorithm to find solution spread around the Kottas and Lau’s EC optimum. To overcome this limitation, a partial random assignment procedure is adopted and described in the following. Consider a chromosome x. Specify a limit L ∈ [0, 99] . Open the first station. Step 1: For each task (gene) in x, and with respect to the sequence described by x, do the following: Step 1.a: if the task addition is desirable with respect to the Kottas and Lau’s criterion, add it to the current station and return to Step 1. Else go to Step 2.a. Step 2.a: Calculate the sum of the mean performance times of the tasks already assigned to the current station and of the task under consideration. If that sum exceeds the cycle time, open a new station, assign it the considered task and go to Step 1. Else go to Step 3.a. Step 3.a: Extract a random number in the range [0, 99]. If that number is less than L, assign the task to the current station. Else, open a new station, assign it the task and go to Step 1.
Step 0:
Selection procedure Selection is the procedure through which chromosomes are chosen for the generation of the new population, carried out by means of the genetic operators. The proposed genetic algorithm utilizes the wellknown Roulette Wheel Selection (RWS) as a selection method, which states that each chromosome has a probability of choice ( P (x ) ) related to its fitness function value, calculated as: f (x ) − fmin (Ψ ) (8) P (x ) = , ∑ (f (x ) − fmin (Ψ )) x∈Ψ
where fmin (Ψ ) is the fitness value of the worst solution in the current population Ψ.
Genetic operators Populations are generated by using the so-called genetic operators, that is, crossover and mutation. Crossover takes two individuals (parents) from the old population and produces a new one (offspring) by combining their genes with respect to a predefined criterion. Mutation is generally applied after the crossover and induces a change in chromosomes. Moreover, an execution probability is associated to each of the two operators, generally higher for the crossover and lower for the mutation. This behaviour allows the genetic algorithm to carry out searches spread over the solutions space as a whole without losing genetic information concerning good solutions found. Both of the aforementioned operators have to be able to produce new feasible individuals, that is, individuals accomplishing with problem configuration. In particular, in ALBPs each individual in the population has to satisfy precedence diagram constraints. Hence, in the proposed genetic algorithm the Two Point Crossover (TPC) and the
th
19 International Conference on Production Research
Scramble Mutation (SM) are used, being proved to be suitable by [18, 19, 25]. In TPC, the offspring takes the external parts of the first parent, cut in two random positions, and the remaining part is inherited by the second parent maintaining the same order. This operator implicitly guarantees the feasibility of the offspring, since the order of the operations is not swapped. In SM the offspring inherits the first part of the parent, defined by a random cut point, while the second part is generated one step at a time by randomly adding an operation among the feasible ones. Also this operator implicitly maintains the feasibility of the offspring.
Local search procedure As suggested by [35], a local search procedure is introduced to find neighbourhood solutions. This approach has been proved to be suitable for spreading the search over different directions, allowing the algorithm to find solutions better describing the Pareto front. In particular, the local search procedure is applied after the creation of the new population and carries out searches as a function of the random weights previously assigned. In the proposed algorithm the SM is used as the local search operator. The behaviour of the local search procedure is here reported [35]: Step 0: Step 1: Step 2:
Step 3:
Consider an initial solution x, set b = 0 . Apply the local search operator to find a neighbourhood solution y. If y is better than x with respect to the weights associated to x, replace x with y, set b = 0 , and return to Step 1. Set b = b + 1 . If b ≤ h return to Step 1, otherwise terminate this procedure and consider x as the final solution.
As one can see, parameter h controls the number of local searches the procedure carries out for each individual. The higher is h, the more accurate the neighbourhood search is, but the more time consuming the algorithm shall be.
The multi-objective genetic algorithm In addition to the classical form of genetic algorithms, a set of non-dominated (elite) solutions is introduced and continuously updated to keep trace of the best individuals. Moreover, at each iteration, a predefined number of elite individuals is chosen and directly transported in the population so as to make it possible a propagation of good solutions among the generations. Let NP represents the number of individuals in each population, NE the number of elite individuals to select from the elite set, cp and mp the crossover and mutation probabilities respectively, and h the parameter to control the local searches. The MOGA procedure can be described as follows: Step 0:
Step 1:
Step 2:
Specify the constant weights c1 and c2, and the search direction identifiers s1 and s2. Randomly generate an initial population of NP individuals. For each individual in the initial population, calculate the values of the EC and the MSF, and update the elite set, that is, find the non-dominated solutions. Define the initial populations as old population. Generate the new population. First, select NE individuals from the elite set and add them to the new population. Second, generate the remaining (NP − NE ) individuals by repeating the following sub-procedure as much as needed: i) according to cp, if a crossover is needed select two individuals from the old population and generate the new one by applying the TPC, otherwise select one individual from the old population; ii) according to mp, if a mutation is needed apply the SM to the new individual; iii) randomly specify the values for the weights w1 and w2 and assign them to the previously generated individual.
Step 3: Step 4: Step 5:
For each individual in the new population, apply the local search procedure as a function of parameter h and weights w1 and w2. For each individual in the new population, calculate the values of the EC and the MSF and update the elite set. If a prespecified stopping condition is satisfied (i.e. number of iterations), consider the elite set as the solution set for the problem and exit. Otherwise, define the new population as old population and return to Step 2.
The elite set will represent all the best individuals found in the search process, that is, those individuals that never have been dominated by others in the process as a whole. As one can see, the MOGA’s performance is influenced by some parameters, such as NP, NE, the number of iterations, the values of h, c1, and c2. In our study, we set those parameters according with that adopted in literature concerning the application of genetic algorithms to ALBPs and that suggested by [35] for the multi-objective search. 7
EXPERIMENTAL RESULTS To assess the performances of the proposed heuristics a number of computational experiments were carried out. In particular, a two-fold approach was adopted: firstly, an experimental campaign was used to identify the best combination of the proposed heuristic rules in the multiple single-pass procedure, with respect to different assembly problem configurations; secondly, the optimallytuned multiple-single pass procedure was compared with the MOGA to estimate its effectiveness in solving rebalancing problems. The first experimental campaign was structured as following (for a more detailed description of the parameters the reader can refer to [29]): 1.
Size of the problem in the initial balancing ( N 0 ): 100-task, 200-task and 400-task ALBPs are randomly generated.
2.
Mean performance time ( μ i0 ) of each operation in the initial balancing is an integer value randomly generated in the range [1, 30] .
3.
Performance task time standard deviation σ i0
of each
operation in the initial balancing is generated as 10% of μ i0 . 4.
Incompletion cost
Ii′0
of each operation in the initial
balancing is obtained by multiplying μ i0 and a value a randomly generated in the interval [1.1, 2] .
5.
6. 7.
The cycle time in the initial balancing ( C 0 ) is generated by multiplying a value b and the maximum mean performance time μ i0 . Specifically, b equal to 2 and 4 is chosen. In accordance with [9], the density of the precedence matrix in the initial balancing ( D 0 ) is set to 0.3 and 0.8. Among the changes introduced by a re-designed or a new item, the one involving mutations in precedence relationships of the tasks is the most critical and wide spread. Hence, precedence matrix M 0 is randomly modified [29] to obtain a new matrix M with respect to a percentage of mutations PM in the set {2, 8} .
{100, 200, 400} , each density D0 in {0.3, 0.8} , each value of b in {2, 4} , each mutations percentage in {2, 8} , 10 line balancing problems are generated, yielding to an
For each size N 0
in
amount of 240 problems solved. For each of them, different configurations of the multiple single-pass procedure were adopted to obtain the solutions: A: 100% HP1 rule. This configuration degenerates in the singlepass procedure proposed by [29]. B: 100% HP2 rule. C: 100% HP3 rule. D: 50% HP1 and 50% HP2 rules. E: 50% HP2 and 50% HP3 rules.
F: G: H: I: L: M: N:
50% HP2 and 50% HP4 rules. 70% HP1 and 30% HP2 rules. 30% HP1 and 70% HP2 rules. 80% HP1 and 20% HP2 rules. 20% HP1 and 80% HP2 rules. 90% HP1 and 10% HP2 rules. 10% HP1 and 90% HP2 rules. In all the different configurations and for each rebalancing problem, the multiple single-pass algorithm has been set to carry out 30 runs, each of them characterized by 31 searches. In each run, weights for the two objectives have been varied in the range [0, 100] , thus starting from an initial assignment
(0, 100) ,
the weights are varied until the final
assignment (100, 0) adopting a step depending on the number of searches executed.
To identify the best configuration for the multiple single-pass procedure different comparisons have been carried out, as reported in Tables 1, 2, 3, and 4. Since the output of the algorithms, in each different configuration, is a set of non-dominated solutions, the comparison is carried out by measuring, for each different pair of configurations, the number of solutions of the one which are not dominated by no one solution of the other. The parameter which measures that relative dominance is called OutPerformance Rate [36] and is defined as: n1 (9) , OPR1 = n1 + n2 where OPR1 is the relative dominance of the algorithm 1 over the algorithm 2, n1 is the number of solutions of the algorithm 1 which are not dominated by none solutions of the algorithm 2, and n2 is the opposite. Obviously, values of OPR1 range in the interval [0,1] , assuming value 0 when solutions provided by algorithm 1 are completely dominated by those obtained by algorithm 2, and value 1 in the opposite situation. In the Tables 1, 2, 3, and 4 values reported represent the relative dominance of the configuration of the column with respect to that of the row. In particular, values greater than 0.5, thus stating a better performance of the configuration reported in the column, are represented in bold italic font. In Table 1, the results of the comparisons of the configurations A, B, and C are presented. This comparison allows to identify which heuristic performs better when considered alone, that is, when the multiple single-pass procedure degenerates in a single-pass procedure. As one can see, the configuration B consistently outperforms the other two, while configuration C is the worst. In Table 2, the results of the comparisons of the configurations D, E, and F are shown. The configurations are characterized by the use of two heuristic with the same probability of selection. In particular, the best performing heuristic identified in the previous test is coupled with all the other three. As shown, the configuration F is consistently worst with respect to the others, stating that heuristic HP4, characterized by a random behaviour, involves a worsening in the capability of the algorithm to find good solutions. As a consequence, such a heuristic will not be considered in the next experiments. Moreover, the configuration D is consistently superior to configuration E, showing that best results can be obtained by combining heuristics HP1 and HP2. Tables 3 and 4 show the result of the comparison among the configurations A, G, H, I, L, M, and N in the cases of PM equal to 2 and 8 respectively. The use of a multiple single-pass heuristic allows consistent improvements in the capability of founding good quality solutions with respect to the single-pass case, as clearly shown by the values reported in the column representing the configuration A. The other comparisons point out the effects of different combination percentage of the two best performing heuristics, that is, HP1 and HP2. As shown, in the case of low modifications imposed (PM equal to 2), the
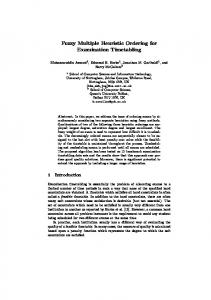
configuration M is the well-performing one, pointing out that best results can be obtained giving high selection probability to heuristic HP1 and low to heuristic HP2. This demonstrates that there is a consistent difference between single-pass and multiple single-pass procedure. Indeed, when the heuristic procedures were considered alone (single-pass equivalent case), HP2 resulted the better one, while when the heuristic procedures were considered in pair (multiple single-pass procedure with two heuristics) the best combination resulted in a huge use of HP1 and low use of HP2. In the case of consistent modifications imposed (PM equal to 8), configuration M maintains the best performance when the number of operations is high (400), while in small problems configurations G and I tends to become the best ones, addressing however to give more selection probability to heuristic HP1, but less than in previous cases. In Figure 1, comparisons between the configuration M of the multiple single-pass heuristic and the proposed MOGA are presented. In particular, the MOGA was set to carry out 500 generations, with NP of 20, NE of 3, crossover (cp) and mutation (mp) probability of 0.9 and 0.1 respectively, local searches control parameter (h) equal to 2, parameter L equal to 40, constant weight c1 always equal to 1, and constant weight c2 equal to 15000 for 200-task problems and to 150000 for 400-task problems. The multiple single-pass algorithm, configuration M, was set as in the previous experiments. In figure 1, solutions proposed by the MOGA are reported in white colour, while solutions obtained by the multiple single-pass algorithm are depicted in grey colour. As one can see, the MOGA is not able to reach a good degree of optimisation for what concerns the similarity objective, and its solutions are always consistently dominated by those proposed by the multiple single-pass heuristic. As similar as stated in [23], the aforementioned comparisons underline that hardconstrained problems are well-solved by genetic algorithms involving problem specific operators. 8
CONCLUSIONS This paper deals with assembly line re-balancing, a problem that nowadays afflicts the most part of companies working in competitive markets, thus forced to frequent changes in product features and subjected to variations in sales volumes. This implies continuous changes in the balancing of their assembly lines, involving stations workload re-definition and, as a consequence, reassignment of tasks to operators. Such tasks reassignments produce increases in some costs factors, such as quality assurance, equipment switching, and operators training, which are very difficult to estimate. Hence, their reduction can be addressed by lowering the number of re-assignments themselves. In this paper, a multiple single-pass heuristic algorithm is proposed with the aim to solve the stochastic assembly line re-balancing problem from a multi-objective standpoint, that is, able to minimize the total expected completion cost together with maximizing the similarity of the tasks assignments between the new and the original line. The aim of the algorithm is to find the most complete set of non-dominated solutions well-representing the Pareto front of the multi-objective re-balancing problem. Different types of heuristic procedures have been proposed for using in the multiple single-pass algorithm, while the best configuration of the algorithm has been obtained by means of a large scale experimentation. Particularly, the heuristic procedure HP1, derived from the model developed by [29], coupled with the new proposed heuristic HP2 showed the highest capability of finding good non-dominated solutions.
th
19 International Conference on Production Research
A 0
100
N 0 D
B
200
0.3
0.8
400
0.3
0.8
100
0.3
0.8
0.3
2
4
2
4
2
4
2
4
2
4
2
4
B
0.096
0.154
0.046
0.134
0.243
0.032
0.060
0.080
0.369
0.405
0.343
0.080
C
0.967
0.917
0.967
0.800
0.917
0.812
0.967
0.800
0.908
0.942
1.000
0.838
b
200 0.8
400
0.3
0.8
0.3
0.8
2
4
2
4
2
4
2
4
2
4
2
4
1.000
1.000
1.000
1.000
1.000
1.000
1.000
1.000
1.000
1.000
1.000
1.000
1.000
0.992
1.000
1.000
1.000
1.000
1.000
1.000
1.000
1.000
1.000
1.000
2
PM
8
PM B
0.024
0.145
0.058
0.062
0.127
C
0.838
0.617
0.900
0.675
0.917
0.176
0.043
0.103
0.135
0.210
0.144
0.051
0.867
0.950
0.817
0.792
0.925
0.950
0.842
Table 1. Results of comparison of configurations A, B, and C in terms of out-performance rate.
D 0
100
N 0 D
0.3 b
0.8
2
4
E
200 2
400
0.3 4
2
0.8 4
2
100
0.3 4
2
0.8 4
2
200
0.3 4
0.8
400
0.3
0.8
0.3
0.8
2
4
2
4
2
4
2
4
2
4
2
4
1.000
1.000
1.000
0.992
1.000
1.000
1.000
1.000
1.000
1.000
1.000
1.000
1.000
0.983
0.977
0.986
0.980
0.980
0.988
0.974
0.884
0.931
1.000
0.958
2
PM E
1.000
0.849
0.969
0.925
1.000
0.964
1.000
0.992
0.990
0.970
1.000
1.000
F
1.000
1.000
1.000
1.000
1.000
1.000
1.000
1.000
1.000
1.000
1.000
1.000 8
PM E
0.878
0.860
0.920
0.889
0.988
F
1.000
1.000
1.000
1.000
1.000
0.933
0.978
0.908
1.000
1.000
1.000
0.983
1.000
1.000
1.000
1.000
1.000
1.000
1.000
Table 2. Results of comparison of configurations D, E, and F in terms of out-performance rate.
A PM 0 D b 0 N G H I L M N
G
H
I
L
M
2 0.3 2
0.8 4
2
0.3 4
2
0.8 4
2
0.3 4
2
0.8 4
2
0.3 4
0.8
0.3
0.8
0.3
0.8
2
4
2
4
2
4
2
4
2
4
2
4
0.813 0.598 0.835
0.732 0.394 0.788
0.631 0.705 0.695
0.723 0.582 0.771
0.231 0.605
0.270 0.595
0.478 0.619
0.404 0.654
0.781
0.823
0.602
0.649
100 0.000 0.031 0.000 0.037 0.000 0.055
0.018 0.051 0.022 0.071 0.010 0.088
0.022 0.062 0.000 0.089 0.053 0.097
0.000 0.050 0.021 0.052 0.000 0.128
0.767 0.413 0.842 0.624 0.900
0.663 0.489 0.774 0.419 0.792
0.676 0.641 0.711 0.740 0.816
0.772 0.538 0.809 0.647 0.848
0.259 0.674 0.341 0.801
0.307 0.597 0.282 0.626
0.487 0.641 0.580 0.819
0.259 0.629 0.415 0.733
Table 3. Results of comparison of configurations A, G, H, I, L, M, and N in terms of out-performance rate, with PM set to 2.
0
200
N G
0.114
0.029
0.031
0.000
H
0.278
0.115
0.031
0.018
0.948
0.825
0.664
I
0.063
0.000
0.035
0.000
0.343
0.506
0.534
0.840 0.422
0.062
0.235
0.314
0.193
L
0.297
0.143
0.058
0.064
0.927
0.926
0.824
0.832
0.648
0.667
0.664
0.584
M
0.024
0.000
0.040
0.000
0.297
0.408
0.641
0.489
0.087
0.234
0.490
0.217
0.439
0.411
0.683
0.604
0.089
0.174
0.395
0.232
N
0.355
0.164
0.043
0.052
0.988
0.920
0.898
0.814
0.799
0.755
0.738
0.660
0.988
0.871
0.815
0.822
0.773
0.600
0.649
0.584
0
0.954
0.847
0.783
0.856 0.927
0.862
0.697
0.742
0.820
1.000
0.913
0.928
400
N G
0.054
0.078
0.010
H
0.185
0.287
0.062
0.026 0.103
0.842
0.923
0.852
0.840
I
0.025
0.086
0.031
0.014
0.343
0.294
0.444
0.393
0.157
0.071
0.113
L
0.187
0.260
0.077
0.110
0.929
0.971
0.924
0.962
0.571
0.558
0.734
0.591
0.858
0.983
0.896
0.943
M
0.000
0.023
0.017
0.008
0.167
0.208
0.447
0.393
0.143
0.013
0.182
0.212
0.333
0.312
0.434
0.394
0.142
0.000
0.135
0.131
N
0.208
0.366
0.117
0.216
0.887
0.989
0.901
0.923
0.678
0.731
0.738
0.768
0.858
0.972
0.918
0.950
0.630
0.718
0.625
0.674
0.111
Table 3. Results of comparison of configurations A, G, H, I, L, M, and N in terms of out-performance rate, with PM set to 2 (continue). A PM 0 D b 0 N G H I L M N 0 N G H I L M N 0 N G H I L M N
G
H
I
L
M
8 0.3 2
0.8 4
2
0.3 4
2
0.8 4
2
0.3 4
2
0.8 4
2
0.3 4
2
0.8
0.3
0.8
0.3
0.8
4
2
4
2
4
2
4
2
4
2
4
100 0.017 0.000 0.000 0.000 0.000 0.000
0.020 0.030 0.025 0.066 0.054 0.071
0.033 0.048 0.030 0.043 0.047 0.067
0.000 0.020 0.017 0.043 0.050 0.073
0.450 0.404 0.467 0.711 0.588
0.724 0.498 0.727 0.658 0.825
0.535 0.467 0.551 0.714 0.599
0.460 0.645 0.499 0.779 0.572
0.599 0.507 0.707 0.640
0.313 0.687 0.501 0.830
0.456 0.598 0.591 0.649
0.600 0.508 0.443 0.700 0.701 0.646 0.447 200
0.789 0.679 0.777
0.609 0.747 0.651
0.394 0.680 0.502
0.673 0.600
0.304 0.598
0.570 0.577
0.719 0.666
0.437
0.692
0.439
0.373
0.011 0.017 0.000 0.025 0.090 0.052
0.039 0.099 0.000 0.180 0.204 0.182
0.000 0.000 0.000 0.000 0.017 0.010
0.000 0.028 0.000 0.031 0.013 0.015
0.764 0.425 0.857 0.451 0.866
0.897 0.388 0.934 0.309 0.902
0.636 0.492 0.677 0.713 0.714
0.667 0.499 0.662 0.594 0.725
0.288 0.525 0.332 0.695
0.077 0.585 0.115 0.534
0.419 0.482 0.566 0.659
0.284 0.471 0.806 0.413 0.495 0.647 0.832 400
0.883 0.428 0.911
0.642 0.725 0.657
0.679 0.643 0.789
0.226 0.598
0.088 0.438
0.504 0.677
0.407 0.645
0.796
0.880
0.484
0.623
0.000 0.056 0.010 0.138 0.131 0.145
0.000 0.010 0.000 0.042 0.107 0.077
0.000 0.024 0.000 0.031 0.176 0.080
0.009 0.037 0.000 0.073 0.132 0.102
0.684 0.406 0.774 0.464 0.824
0.831 0.299 0.934 0.275 0.903
0.774 0.492 0.818 0.601 0.871
0.814 0.345 0.771 0.350 0.852
0.263 0.709 0.345 0.682
0.085 0.707 0.125 0.721
0.273 0.554 0.419 0.678
0.158 0.517 0.281 0.687
0.908 0.471 0.955
0.786 0.640 0.798
0.828 0.476 0.897
0.273 0.542
0.065 0.531
0.347 0.674
0.257 0.665
0.826
0.882
0.746
0.799
0.773 0.508 0.802
Table 4. Results of comparison of configurations A, G, H, I, L, M, and N in terms of out-performance rate, with PM set to 8.
th
19 International Conference on Production Research
a) N0 200, D0 0.3, b 4, PM 2
b) N0 200, D0 0.3, b 4, PM 8
c) N0 400, D0 0.8, b 4, PM 2
d) N0 400, D0 0.8, b 4, PM 8
Figure 1: Comparisons between the MOGA and the multiple single-pass heuristic. Moreover, a Multi-Objective Genetic Algorithm (MOGA) has been developed to solve the stochastic assembly line re-balancing problem, in accordance with some of the best-performing genetic operators proposed in the literature, and it has been compared with the optimally tuned multiple single-pass heuristic algorithm. Some experiments show how the MOGA is not able to obtain consistent results in terms of similarity optimisation whatever the problem complexity is, resulting in a definitive domination by the multiple single-pass heuristic introduced, that, consequently, results a robust and efficient technique for obtaining a wide set of nondominated solutions for the stochastic assembly line rebalancing problem. In accordance with [23], further researches are addressed to define problem specific operators, improving genetic algorithms behaviour for solving the re-balancing problem. 9
REFERENCES
[1] Baybars, I., A survey of exact algorithms for the simple assembly line balancing problem, Management Science, 1986, 32, 909 -932. [2] Ghosh, S., and Gagnon, R.J., A comprehensive literature review and analysis of the design, balancing and scheduling of assembly systems, International Journal of Production Research, 1989, 27, 637 -670. [3] Scholl, A., Balancing and sequencing of assembly lines, 1995 (Physica-Verlag, Heildelberg). [4] Erel, E., and Sarin, S.C., A survey of the assembly line balancing procedures, Production Planning & Control, 1998, 9, 414 –434. [5] Amen, M., Heuristic methods for cost-oriented assembly line balancing: A survey, International Journal of Production Economics, 2000, 68, 1-14. [6] Amen, M., Heuristic methods for cost-oriented assembly line balancing: A comparison on solution quality and computing time, International Journal of Production Economics, 2001, 69, 255-264. [7] Pierreval, H., Caux C., Paris, J.L., and Viguier, F., Evolutionary approaches to the design and organization of manufacturing systems, Computers & Industrial Engineering, 2003, 44, 339-364. [8] Boysen, N., Fliedner, M., and Scholl, A., A classification of assembly line balancing problems, European Journal of Operational Research, in press. [9] Talbot, F.B., Patterson, J.H., and Gehrlein, W.V., A comparative evaluation of heuristic line balancing techniques, Management Science, 1986, 32, 430 –454. [10] Tonge, F.M., Assembly line balancing using probabilistic combinations of heuristics, Management Science, 1965, 11, 727-735. [11] Arcus, A.L., COMSOAL: A computer method of sequencing operations for assembly lines, International Journal of Production Research, 1966, 4, 259-277. [12] Buxey, G., Incompletion costs versus labour efficiency on the fixeditem moving belt flowline, International Journal of Production Research, 1978, 4, 233-247. [13] Pinto, P.A., Dannenbring, D.G., and Khumawala, B.M., A heuristic network procedure for the assembly line balancing problem, Naval Research Logistics Review, 1978, 25, 299-307. [14] Schofield, N.A., Assembly line balancing and the application of computer techniques, Computers and Industrial Engineering, 1979, 3, 5359. [15] Akagi, F., Osaki, H., and Kikichi, S., A method for assembly line balancing with more than one worker in each station, International Journal of Production Research, 1983, 21, 755-770.
[16] Kottas, J.F., and Lau, H.S., A Stochastic line balancing procedure, International Journal of Production Research, 1981, 19, 177 -193. [17] Anderson, E.J., and Ferris, M.C., Genetic algorithms for combinatorial optimisation problems: the assembly line balancing problems, ORSA Journal on Computing, 1994, 6, 161-173. [18] Leu, Y.Y., Matheson, L.A., and Rees, L.P., Assembly line balancing using genetic algorithms with heuristic-generated initial populations and multiple evaluation criteria, Decision Sciences, 1994, 25, 581-606. [19] Rubinovitz, J., and Levitin, G., Genetic algorithm for assembly line balancing, International Journal of Production Economics, 1995, 41, 343354. [20] Kim, Y.K., Kim, Y.J., and Kim, Y., Genetic algorithms for assembly line balancing with various objectives, Computers and Industrial Engineering, 1996, 30, 397-409. [21] Suresh, G., Vinod, V.V., and Sahu, S., A genetic algorithm for assembly line balancing, Production Planning & Control, 1996, 7, 38-46. [22] Ajenblit, D.A. and R.L. Wainwright, Applying Genetic Algorithms to the U-Shaped Line Balancing Problem, Evolutionary Computation Proceedings. IEEE World Congress on Computational Intelligence, 1998 (May 4-9), 96 -101. [23] Kim, Y.J., Kim, Y.K., and Cho, Y., A heuristic-based genetic algorithm for workload smoothing in assembly lines, Computers and Operations Research, 1998, 25, 99-111. [24] Ponnambalam, S.G., Aravindan, P., and Mogileeswar Naidu, G., A multi-objective genetic algorithm for solving assembly line balancing problem, International Journal of Advanced Manufacturing Technology, 2000, 16, 341-352. [25] Sabuncuoglu, I., Erel, E., and Tanyer, M., Assembly line balancing using genetic algorithms, Journal of Intelligent Manufacturing, 2000, 11, 295-310. [26] Rekiek, B., De Lit, P., Pellichero, F., L’Eglise, T., Fouda, P., Falkenauer, E., and Delchambre, A., A multiple objective grouping genetic algorithm for assembly line design, Journal of Intelligent Manufacturing, 2001, 12, 467-485. [27] Rekiek, B., De Lit, P., and Delchambre, A., Hybrid assembly line design and user’s preferences, International Journal of Production Research, 2002, 40, 1095-1111. [28] Gonçalves, J.F., and Almeida, J.R., A hybrid genetic algorithm for assembly line balancing, Journal of Heuristics, 2002, 8, 629-642. [29] Gamberini, R., Grassi, A., and Rimini, B., A new multi-objective heuristic algorithm for solving the stochastic assembly line re-balancing problem, International Journal of Production Economics, 102, 226-243. [30] Kottas, J.F., and Lau, H.S., A cost oriented approach to stochastic line balancing, AIIE Transactions, 1973, 5, 164 -171. [31] Kottas, J.F., and Lau, H.S., A total operating cost model for paced lines with stochastic task times, AIIE Transactions, 1976, 8, 234-240. [32] Sarin, S.C., and Erel, E., Development of cost model for the singlemodel stochastic assembly line balancing problem, International Journal of Production Research, 1990, 7, 1305-1316. [33] Sarin, S.C., Erel, E., and Dar-El, E.M., A methodology for solving single-model, stochastic assembly line balancing problem, OMEGA - The International Journal of Management Science, 1999, 27, 525-535. [34] Murata, T., Ishibuchi, H., and Tanaka, H., Multi-objective genetic algorithm and its applications to flowshop scheduling, Computers and Industrial Engineering, 1996, 30, 957-968. [35] Ishibuchi, H., and Murata, T., A multi-objective genetic local search algorithm and its application to flowshop scheduling, IEEE Transactions on Systems, Man, and Cybernetics – Part C: applications and reviews, 1998, 28, 392-403. [36] Zhao, Y., Brizuela, C.A., and Sannomiya, N., Application of the partial enumeration selection method in genetic algorithms to solving a multi-objective flowshop problem, Proceedings of the 2001 IEEE International Conference on Systems, Man, and Cybernetics, 2001, 4, 2365-2370.