Indispensable conditions for the evolution of an organism would be to increase ..... lb), which correspond to unicellular organisms with sexual- ity, such as yeast.
Proc. Natl. Acad. Sci. USA Vol. 90, pp. 11934-11938, December 1993 Evolution
A neo-Darwinian algorithm: Asymmetrical mutations due to semiconservative DNA-type replication promote evolution KEN-NOSUKE WADA*t, HIROFUMI DOI*:, SHIN-ICHI TANAKAt, YOSHIKO WADA§, AND MITSURu FURUSAWA*¶II *Furisawa MorphoGene Project, ERATO, Research Development Corporation of Japan (JRDC), 2-5-2 Nagata-cho, Chiyoda-ku, Tokyo 100, Japan; tSchool of Computer and Cognitive Sciences, Chukyo University, 101 Tokodate, Kaizu-cho, Toyota 407-03, Japan; tBiological Informatics Section, IIAS, Fujitsu Laboratories, Ltd., 9-3 Nakase 1-chome, Mihama-ku, Chiba 261, Japan; §School of Medicine, Niigata University, 1-757 Asahi-cho St., Niigata 951, Japan; and lMolecular Biology Research Laboratory, Daiichi Pharmaceutical Co., Ltd., 16-13 Kitakasai 1-chome, Edogawa-ku, Tokyo 134, Japan Communicated by Manfred Eigen, September 13, 1993
ABSTRACT Evolution is, in a sense, to resolve optimizaffon problems. Our neo-Darwinian algorithm based on the mechanics of inheritance and natural selection uses doublestranded DNA-type genetic information to resolve the "knapsack problem." The algorithm with asymmetrical mutations due to semiconservative DNA-type replication most effectively resolved the problem. Our results strongly suggest that disparity in mutations caused by the asymmetric machinery of DNA replication promotes evolution, in particular of diploid organisms with a high mutation rate, in a small population, and under strong selection pressure.
genetic algorithms, however, use a linear single-stranded genome (i.e., RNA-type), and mutations are inserted randomly during genome reproduction without semiconservative replication (4). We propose here another genetic algorithm (neo-Darwinian algorithm) to describe a disparity and a parity model of replication fidelity for dsDNA-type genome. We report the abilities of the algorithm to resolve a representative optimization problem in terms of model adaptability, competition between the two models, and extermination of models. Our neo-Darwinian algorithm mimics the semiconservative replication manner of dsDNA and its point mutations, which are inserted by base misreading when the genome replicates. In the present study, the so-called "knapsack problem" (4), which is rather simple but reflects the phenomenon of adaptation or the survival of the fittest organisms was selected to examine which model (disparity or parity) would obtain a better fitness score. Moreover, the effects of mutation rate, ploidy, population size, sexuality, and crossover were investigated with our neo-Darwinian algorithm. The results clearly indicated that the disparity model produced an overall higher fitness score than the parity model. Moreover, the disparity model was found to avoid extermination, even under extreme conditions. These observations suggest that in nature the presence of a difference in the fidelity between the leading and lagging DNA strands might contribute to the promotion of evolution. In other words, a driving force for the promotion of evolution might be inherent in the enzyme complexes that catalyze semiconservative replication of dsDNA.
Indispensable conditions for the evolution of an organism would be to increase adaptability, to win in competition, and to avoid species extermination. A major factor contributing to evolution seems to be spontaneous misreading of bases during DNA synthesis. Semiconservative replication of double-stranded DNA (dsDNA) is an asymmetric process-i.e., there is a leading and a lagging strand (1). This situation provides two possibilities for the occurrence of mutations: (i) a difference in frequency of strand-specific base misreading between the leading and lagging DNA strands (disparity model) and (ii) no statistical difference in the frequency of base misreading between strands (parity model), which is the generally accepted view. Recently, we reported that a difference in error frequency caused a disproportionate accumulation of mutations in the descendants, on the basis of computer analyses of a simple genome model (2). The disparity model guarantees the wild type (with zero or few mutations), as well as individuals with more accumulated mutations than in the parity model, with adequate error differences between strands. When the population is limited, as in a real species, and circumstances are constant, the wild-type population does not decrease with generations because the well-adapted wild type is selected to survive. Mutants, most of which are deleterious, are probably exterminated. When circumstances change, the original wild type cannot survive, and selected mutants might adapt under new circumstances. The new wild type thus adapted become a new wild type under the new circumstances. In contrast, in the parity model with high mutation rates, the original unmutated wild type does not exist even in the first generation. Thus, the disparity model would be more advantageous toward evolution in comparison with the parity model (2). The fact that organisms evolve is, in a sense, that they resolve optimization problems. From this point of view, genetic algorithms based on the mechanics of inheritance and natural selection have been proposed as a powerful tool for resolving optimization problems (3, 4). The conventional
NEO-DARVVINIAN APPROACH TO THE KNAPSACK OPTIMIZATION PROBLEM To examine the fitness of the disparity or parity model, the neo-Darwinian algorithm was used to resolve the knapsack optimization problem within a context of genetic variables (Fig. 1). In the knapsack problem there are 100 kinds of objects with weights (20-100) and values (20-100) determined at random but within specified limits. The objective is to maximize the total value of objects placed in a knapsack, subject to a loading-weight limitation, and taking a plural number of the same object is not allowed. In a genetic context, an initial population size was chosen to be 500 parent men with randomly determined genetic information. The chromosomal information consists of 1 and 0 on a double-stranded string with a length of 100 "bases" that replicates like dsDNA and contains a single origin of replication at one end. The paring rule of the double-stranded string is 1:1 and 0:0, and a "1" at the mth position in the string means that the man takes the mth object and "0" means he
The publication costs of this article were defrayed in part by page charge payment. This article must therefore be hereby marked "advertisement" in accordance with 18 U.S.C. §1734 solely to indicate this fact.
Abbreviation: dsDNA, double-stranded DNA. I"To whom reprint requests should be addressed.
11934
Evolution: Wada et al. a
Proc. Natl. Acad. Sci. USA 90 (1993)
11935
9
L I
Placing objects in a knapsack ---T-~~~~~~~~ Iv
Evaluation of total values of placed objects Selection
by the Monte Carlo method survived parent
I
000 Meiosis
±
_
0
Insemination
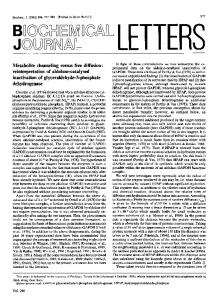
FIG. 1. (a) Asexual haploid or diploid men composing the neo-Darwinian world of the knapsack problem. If a parent were selected m times by the Monte Carlo method, the parent divides into two offsprings with accompanying mutations, and each offspring multiplies into m men. (b) Sexual diploid men composing the neo-Darwinian world of the knapsack problem. Meiosis is in some cases accompanied with crossover. If a parent were selected m times by the Monte Carlo method, the parent produces a set of four gametes, which is then multiplied by m, and two gametes of each set each mate with a gamete of other selected parents.
does not take it. The men have either a haploid or a diploid genome, and the next generation offspring arise either by sexual or asexual reproduction. In the diploid men, 1 values dominated 0 values, but similar results were obtained with a reverse situation. In asexual reproduction, the man divides himself into two (Fig. la), whereas sexual reproduction results in four gametes from meiosis, two of which unite with others (i.e.,
isogamy) (Fig. lb). Consequently for the initial 500 men, 1000 offspring result from asexual reproduction, and 500 offspring result from sexual reproduction. During division or meiosis, genetic information changes stochastically, according to given mutation rates. In the paritymodel individual, the mutation rates ofthe leading and lagging DNA strands are the same at (n/2) bases per chromosome. In the disparity model, the mutation rate of the leading strand is 0.001 bases per chromosome and that of the lagging strand is n bases per chromosome, where n ' 0.1. In a specific case, the rate of the leading strand is 0.0001 bases per chromosome and n = 0.05. In our previous study, a disparity of 102-103 in the mutation rates between replicating strands guaranteed a disproportionate accumulation of mutations in the descendants (2). For simplicity, the mutation rates described in the following sections refer to the total mutation rates of both strands (n bases per both strands), ignoring that of the leading strand in the disparity-model individual. Thus, under these defined rules, the 1000 men or 500 men in the next generation try to place objects into their knapsack. Five hundred new parents are selected stochastically to produce the next generation in proportion to the total value of placed objects using the Monte Carlo method (4). Those men whose loading weight are over the limitations or whose total values are zero are not selected. The resultant offspring perform the same trial, and the trials were continued up to the 4000th or 10,000th generation, or until extermination. Usually a single class of men was analyzed (e.g., parity, haploid, and asexual) and in the case of competition studies, two classes of men having two opposing properties (parity and
disparity) were studied. In some cases, duced stochastically during meiosis.
crossover was
in-
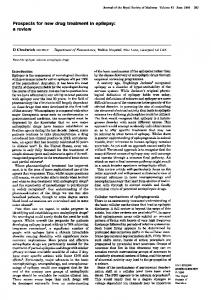
RESULTS Haploid and Asexual World. We simulated the neoDarwinian world of the knapsack problem (loading-weight limits of 1000), initially composed of 500 haploid and asexual men, under conditions of parity or disparity and high or low mutation rates (n = 8.0 or 0.1). Fig. 2A shows the results of the simulations. Among the tested models, the disparitymodel men with a high mutation rate adapted fastest and increased fitness score step by step up to about the 1500th generation. After that, the parity and the disparity men with a low mutation rate attained higher scores. In particular, the disparity model with a low mutation rate got the highest scores up to the 4000th generation. The parity-model men with an n = 8.0 mutation rate could not increase their scores after about the 100th generation and did not obtain higher scores than -1200. Diploid and Asexual World. In the diploid and asexual world within the same weight limits (initial population 500), the disparity men with a high mutation rate (n = 8.0) adapted faster at the beginning than the low-mutation-rate disparity men (n = 0.1). This difference eventually decreased, so that low-mutation-rate disparity group eventually obtained higher scores, similar to that observed in the haploid and asexual world (Fig. 2B; compare with Fig. 2A). Surprisingly, the parity men with a mutation rate of n = 2.0 disappeared after only 250 generations. We observed that the higher the mutation rate was in this group (n - 2.0), the faster they disappeared (data not shown). The reason for their abrupt extermination is that genetic information is frequently changed into a strategy of loading objects that exceeds the weight limits due to a high rate of mutations in both leading and lagging strands. Their variations then decrease to zero by the Monte Carlo method. In contrast, survival of the disparity men is guaranteed by the high-fidelity replication of the
11936
Evolution: Wada et al.
Proc. Natl. Acad. Sci. USA 90 (1993) 2000.
B
8co
01
o
1 000
e)
U)
U)
-
:C
Disparity_3A .I Disparity
-
El 0
1000
2000
3000
4000
Generation
0
2A
8.0
Parity_a 0.o1 Pat_Y_2A_20
I
1000
2000
3000
4000
Generation
FIG. 2. (A) Results of the neo-Darwinian simulation up to the 4000th generation in the haploid and asexual world (the notation 1A in this and other figures means haploid and asexual). Blue, disparity and mutation rate n = 0.1; cyan, disparity and n = 8.0; red, parity and n = 0.1; magenta, parity and n = 8.0. The fitness score of an individual is defined by ;vx, where v is the value of the ith object and x = 0 or 1, according to the genetic information on loading the ith object. Fitness score in this and other figures is the mean value in the population. (B) Results of simulation in the world of asexual diploid men up to the 4000th generation (the notation 2A in the figures means diploid and asexual). Blue, disparity and mutation rate n = 0.1; cyan, disparity and n = 8.0; red, parity and n = 0.1; magenta, parity and n = 2.0.
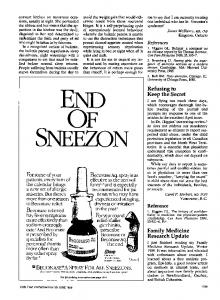
leading strand. The low-mutation-rate parity men (n = 0.1) did not die out but could not get higher fitness scores than the disparity group with the same low mutation rate through the generations (Fig. 2B). Competition Between Parity and Disparity Men. In the haploid and asexual world, when n = 8.0, the disparity-model men clearly. had much higher fitness scores than the parity group (Fig. 2A). As expected from this, in the mixed world of haploid-asexual men with a high mutation rate n = 8.0 (1000 weight limits and 250 individuals in each group), the disparity men got a sweeping victory in the competition, and the parity group disappeared soon by the 15th generation (Fig. 3A, solid lines). Even if the disparity men were initially only 2 in 500 men, they exterminated the parity men (Fig. 3A, dotted lines). In a mixed haploid world of 250 parity and 250 disparity men with a low mutation rate of n = 0.1, the disparity men exterminated the parity (Fig. 3B, blue line and red line). However, when n = 0.05, the parity men completely exterminated the disparity group (Fig. 3B, magenta line and cyan line). In a mixed diploid world, at both mutation rates of n = 0.1 and 0.05 the disparity men won the competition (Fig. 3B, dotted lines). These results suggest that the parity men survive under haploid conditions and low mutation rates. In contrast, the disparity in mutation-rate fidelity is advantageous to diploid organisms with a high mutation rate. Effect of Ploidy. When the mutation rate was low (n = 0.1), diploid men, both of either the parity or disparity models, adapted faster than haploid ones (Fig. 2). However, when n = 8.0, the haploid-disparity men adapted faster and better than their diploid counterparts. As already mentioned, diploid-parity men with high mutation rates could not survive long (Fig. 2B). Fig. 3B also shows the effect of ploidy on competition between the parity and the disparity models. When the mixed world is composed of asexual men with a mutation rate of n = 0.1, the disparity men exterminated the parity group in both haploid and diploid worlds. In contrast, when n = 0.05, the parity-haploid men exterminated the disparity-haploid men, but the parity-diploid men were exterminated by the disparity-diploid men. A diploid genome is thus disadvantageous to the parity model. Effect of Population Size. The initial population in the diploid world of Fig. 2B was 500, and the parity men with mutation rate n = 2.0 disappeared after the 250th generation. The extermination timing of the parity-diploid men depended on the population size. The smaller the initial population size was, the faster the parity men became extinct (data not
shown). In contrast, when the initial population was 10,000 and the mutation rate was fairly high, they did not become extinct, even up to the 10,000th generation (Fig. 3C). Hence, a survival condition for the diploid and parity men is a large initial population. This condition was not a requirement for the disparity men because even if they had a high mutation rate (n = 8.0) and the population size were small (30 individuals), they did not die out (Fig. 3C). These results suggest that a large population and a low mutation rate are necessary for the parity group to survive in a diploid world. In contrast, the disparity group can survive with even a small population and a high mutation rate. In a haploid world, the effect of population on the parity model was similar but was not as severe in comparison to that in the diploid world (data not shown). Weight Limits and Selection Pressure. When the weight limit was 1000, in the diploid and asexual world, the parity group died out after the 250th generation at the mutation rate of n = 2.0 but did not become extinct when the rate was n = 1.6 (data not shown). In the case of a weight limit of 500, the disparity group with a high mutation rate of n = 8.0 did not become extinct, even if the population was extremely small (50 individuals) (Fig. 3D). In contrast, the parity group with a mutation rate of n = 1.6 died out by about the 200th generation (population size = 2000) or at about the 2200th generation (population size = 3000) (Fig. 3D). These results suggest that the parity model is disadvantageous to organisms under high pressures. Diploid and Sexual World. Most living diploid organisms reproduce sexually, in that their germ cells perform meiosis to make gametes, with accompanying crossover in some cases, after numerous asexual mitoses; and gametes unite. We examined the effects of meiosis, insemination, and crossover in the world of diploid and sexual men (illustrated in Fig. lb), which correspond to unicellular organisms with sexuality, such as yeast. We first focus on the effect of sexuality in the disparitydiploid world. When the mutation rate was low (n = 0.1), the sexual men adapted faster than the asexual men, regardless of crossover (Fig. 4A). The sexual men without crossover achieved high scores faster than those with crossover (frequency = 0.2 or 2.0 per chromosome) up to about the 800th generation. After that, the sexual men with crossover got higher scores (Fig. 4A). In contrast, when the mutation rate was high (n = 8.0), the sexual men without crossover had lower scores over almost all the generations relative to the asexual men (Fig. 4B) and actually had the lowest scores up to about the 1400th generation. Crossover (frequency = 0.2
Proc. Natl. Acad. Sci. USA 90 (1993)
Evolution: Wada et al. 500
500.
X
A
400
11937
'I
300
i i
I/
-- - 250_D _A8.0 _ A_8.0
A 300
- 25_
I\
- - 498 P_1A_8.0
c1
I
200
100
\-/ 0
I ~
BI
I
400
I
\
I,
BD 1A 0.1 -P_1A 0.1 -
EF2A70.1
200
-P 2A 0.1 DI1A O.05 - P1A 0.05
100
D_2A_005
P_2A_0.05
\ -
10
-----
20
U
40
30
;
v
I
w
.
w
-
-----
--
_.
...
-
100 ...
. 5.
Generation
Generation
_
0o
20U-.
C
-4)
8g co
U. o, 00
-Dispadty_2A 8..030P - Padty_2A2.0_1 uuuuP
11 0
2000 4000 6000
8000
10000
Generation
0
100
2000
3000
4000
Generation
Fio. 3. (A) Competition in the mixed world of haploid and asexual men with parity or disparity in mutations (mutation rate n = 8.0 and total initial population is 500). Cyan and magenta lines show the change in numbers of the disparity and the parity individuals whose initial population size was 250 each. Blue and red dotted lines show the competition in the world where initially 498 parity men (red) and 2 disparity men (blue) lived. (B) Results of competition in the mixed asexual world ofparity and disparity men with low mutation rates n = 0.1 or 0.05. At the beginning of the competition there were the same number of parity (250) and disparity (250) men. Blue and red solid lines show the competition between the disparity and the parity men (n = 0.1) with a haploid genome, and blue and red dotted lines show that of a diploid genome. Cyan and magenta solid lines show the competition between the haploid disparity and parity men (n = 0.05), and cyan and magenta dotted lines give these values for the diploid groups. (C) Results of the simulation of diploid asexual men under specific conditions up to the 10,000th generation. The red line shows the fitness score of the parity-model men, whose population size was 10,000 and mutation rate was 2.0. The blue line shows that of the disparity men, whose population size was 30 and mutation rate was 8.0. (D) Simulations of the diploid and asexual worlds of parity and disparity models up to the 4000th generation within the weight limits of 500. Red, disparity, n = 8.0, and initial population = 50; blue, parity, n = 1.6, and initial population = 2000; and cyan, parity, n = 1.6, and initial population = 3000. per chromosome) rescued them from this disadvantage, and the sexual men with the same crossover frequency obtained the highest scores among the tested models (Fig. 4B). However, the sexual men with a high crossover frequency could not get a score >='1200. As to the parity men in the diploid world, when the mutation rate was low (n = 0.1), the sexual men with crossover obtained higher scores than those without crossover and than the asexual men, as in the disparity men (Fig. 4C). When n = 2.0, the parity, diploid, and asexual men died
out (Fig. 2B), but sexuality rescued them from this disadvantage (Fig. 4D). When the mutation rate was higher (n = 2.32) and there was no crossover, the parity group died out;
but crossover (frequency = 2.0 per chromosome) reversed this extermination. When the mutation rate was slightly higher (n = 2.4), however, the effect of crossover at the same frequency could not change the extermination. For survival, then, the parity group, must have low mutation rates in a diploid-sexual world. In a mixed sexual world, when n = 0.1, the disparity men exterminated the parity ones, regardless of crossover rates, the same as in the diploid-asexual world (data not shown).
DISCUSSION The idea of genetic algorithms originally came from an understanding of genome reproduction and mutation, and optimization problems have been resolved by these methods
(3, 4). Some optimization problems, such as the knapsack problem, closely resemble the phenomenon of adaptation or evolution of living organisms. Using the current neoDarwinian algorithm we examined the effects of parity and disparity in mutation accumulations, mutation rate, population size, sexuality, ploidy, and crossover, and our observations are summarized in Table 1. We obtained the general result that the scores of the disparity model overcame those of the parity model, particularly with a diploid genome, during increased adaptability. The result of the competition study (mutation rate n = 8.0) shown in Fig. 3A was the most striking, in that the parity and the disparity models showed similar fitness curves independently at the beginning (Fig. 2A), but the parity group was quickly exterminated. Generally, we can say that the disparity model overwhelmed the parity model in a survival race when the population was smaller and the mutation rate was higher. In the haploid and asexual world, when mutation rate was extremely low (n = 0.005), the parity group finally produced higher scores than the disparity group (data not shown). This result suggests that the disparity men with a high mutation rate at the beginning can evolve into a parity with low mutation rate at the final stages in order to gain higher fitness. Escherichia coli has a low mutation rate (0.0001 bp per genome per replication) (5) and probably a very small difference in fidelity between leading and lagging strands and might be an example organism at the end of evolution or might have mechanisms causing mutations other than DNA-replication
11938
Evolution: Wada et al.
Proc. Natl. Acad. Sci. USA 90 (1993)
uuw,
2000
B
-4)
2
§ 1000
1000.
ci
-Disparity_2S_0. _CR0.O Disparity__.0._CfRO.2
L.V
-
Disparity 2S
2000
3000
8.07CR2.0
vI... -Dispanty_.2A8.O
n
____
1000
-Disparity_2S_8.o_CR0.0 Dlsparity2S 8.0 CR0.2
U-
Disparity_2S_O. 1_CR2.0 - Disparty_2A_O.1 -
FIG. 4. Results of the simulation in the diploid and sexual world under various conditions. (A) Disparity men with a low mutation rate, n = 0.1. Green, no crossover; blue, crossover frequency = 0.2 per chromosome; red, crossover frequency = 2.0 per chromosome; and black, asexual and disparity men. (B) Disparity men with a high mutation rate, n = 8.0. Green, no crossover; blue, crossover frequency = 0.2 per chromosome; red, crossover frequency = 2.0 per chromosome; and black, asexual and disparity men. (C) Parity men with a low mutation rate, n = 0.1. Green, no crossover; blue, crossover frequency = 0.2 per chromosome; red, crossover frequency = 2.0 per chromosome; and black, asex-
4000
0
1000
2000
3000
)OO
Generation
Generation 2000
0
8
ual and disparity 1000
Os C
--
LL
-
ui 0
1000
_CR0.0 Parity_2S 0.1 0.1 CRO.2 Parity_2S0O.1 CR2.0 Parity2A_O. t
Parity-2S 2000
3000
4000
men.
(D) Parity
with various mutation rates. Black, n = 2.0 without crossover; magenta, n = 2.32 and no crossover; cyan, n = 2.32 and crossover frequency is 2.0 per chromosome; red, n = 2.4 and no crossover; and blue, n = 2.4 and men
II=
0
1000
Generation errors (6). In a diploid world, our results suggest that living unicellular organisms with sexuality, a high mutation rate, and low frequency crossover will effectively win a survival
race.
In the disparity model, if an effective strategy for resolving problem is established, this is kept forever, even after repeated replications by the high-fidelity leading strand. If a better strategy is acquired by mutation in some individuals, the better one propagates and will eventually drive out the weaker strategies from the population. Thus, a fitness score obtained by this model does not decrease but will always increase step by step with time. The present results strongly suggest that living organisms have a natural driving force for evolution inherent in the machinery of semiconservative DNA replication due to the disparity in fidelity between leading and lagging strands. In other words, during the long history of evolution, organisms obtained a great advantage promoting evolution, once they had acquired an asymmetric replication machinery with a distinct difference in fidelity between the DNA strands. Although there are contradictory results on the presence of the fidelity differences and all the results were derived from more or less artificial systems and indirect experiments (7-13), the present simulation strongly suggests that the disparity model would be more advantageous toward evolution in comparison with the parity model. Consequently, it seems likely that if we can obtain a mutant in which the fidelity of the lagging strand is extremely low while that of the leading strand remains intact, we can establish an interesting experimental system that presumably can accelerate evolua
Table 1. Summary of simulations by the neo-Darwinian algorithm Survival conditions for parity Advantage for disparity Small population Large population Weak selection pressure Strong selection pressure Low mutation rate High mutation rate Asexuality and haploid Sexuality and diploid Noncompetitive world Competitive world
2000
3000
Generation
)00
crossover
frequency is 2.0
per
chromosome.
tion at will and establish an evolutionary history without extermination of the population. Finally, increasing the fitness step by step is the general characteristic of the disparity model using our neo-Darwinian algorithm. The conventional genetic algorithm, which does not reproduce its genome semiconservativeiy, does not necessarily guarantee the fitness scores once acquired. Therefore, our neo-Darwinian algorithm may be an effective approach to solve optimization questions, and broad applications of this idea to different fields of computer simulation look promising. Note Added in Proof. A higher mutation rate in the lagging strand was recently reported by Veaute and Fuchs (14).
K.W. and H.D. should be considered as equal first authors. We thank Drs. K. Abe, M. S. H. Ko, T. Iino, Y. Saeki, and Y. Kikuchi for discussions, and Dr. D. Sterns-Kurosawa for critical reading of the manuscript and for useful suggestions. 1. Kunkel, T. A. (1992) BioEssay 14, 303-308. 2. Furusawa, M. & Doi, H. (1992) J. Theor. Biol. 157, 127-133. 3. Holland, J. H. (1975) Adaptation in Natural and Artificial Systems (Univ. Michigan Press, Ann Arbor, MI). 4. Goldberg, D. E. (1989) Genetic Algorithms in Search, Optimization and Machine Learning (Addison-Wesley, Reading, MA). 5. Drake, J. W. (1969) Nature (London) 221, 1132. 6. Cairns, J., Overbaugh, J. & Miller, S. (1988) Nature (London) 335, 142-145. 7. Kunkel, T. A. (1985) J. Biol. Chem. 260, 12866-12874. 8. Kunkel, T. A., Sabatino, R. D. & Bambara, R. A. (1987) Proc. Natl. Acad. Sci. USA 84, 4865-4869. 9. Roberts, J. D. & Kunkel, T. A. (1988) Proc. Natl. Acad. Sci. USA 85, 7064-7068. 10. Roberts, J. D., Thomas, D. C. & Kunkel, T. A. (1991) Proc. Natl. Acad. Sci. USA 88, 3465-3469. 11. Thomas, D. C., Roberts, J. D., Fitzgerald, M. P. & Kunkel, T. A. (1990) Basic Life Sci. 52, 289-297. 12. Wu, C. I. & Maeda, N. (1987) Nature (London) 327, 169-170. 13. Bulmer, M. (1991) J. Mol. Biol. 33, 305-310. 14. Veaute, X. & Fuchs, R. P. P. (1993) Science 261, 598-600.