Computing and Informatics, Vol. 29, 2010, 1013–1024
A NEURAL NETWORK APPROACH TO FLOOD MAPPING USING SATELLITE IMAGERY Sergii Skakun Space Research Institute NASU-NSAU, Glushkov Ave 40 03680 Kyiv, Ukraine e-mail:
[email protected]
Manuscript received 3 November 2008 Communicated by Viet Dinh Tran
Abstract. This paper presents a new approach to flood mapping using satellite synthetic-aperture radar (SAR) images that is based on intelligent techniques. In particular, we apply artificial neural networks, self-organizing Kohonen’s maps (SOMs), for SAR image segmentation and classification. Our approach was used to process data from different satellite SAR instruments (ERS-2/SAR, ENVISAT/ASAR, RADARSAT-1) for different flood events: the Tisza river, Ukraine and Hungary, 2001; the Huaihe river, China, 2007; the Mekong river, Thailand and Laos, 2008; and the Koshi river, India and Nepal, 2008. Keywords: Flood mapping, neural networks, self-organising Kohonen maps, synthetic aperture radar
1 INTRODUCTION In recent decades the number of hydrological natural disasters has increased considerably. According to [1], in recent years we have witnessed a strengthening of the upward trend, with an average annual growth rate of 8.4 % in the 2000 to 2007 period. Hydrological disasters, such as floods, wet mass movements, represent 55 % of the overall disasters reported in 2007, having a tremendously high human impact (177 million victims) and causing high economic damages (24.5 billion USD) [1]. Earth observation (EO) data from space can provide valuable and timely information when one has to respond to and mitigate such emergencies as floods.
1014
S. Skakun
Satellite observations enable acquisition of data for large and hard-to-reach territories, as well as providing continuous measurements. Using satellite data, we can determine flood areas, since it is impractical to provide such information through field observations. The flood extent is very important for calibration and validation of hydraulic models [2]. The flood extent can be also used for damage assessment and risk management, and can benefit to rescuers during flooding [3]. The use of optical imagery for flood mapping is limited by severe weather conditions, in particular by the presence of clouds. In turn, synthetic aperture radar (SAR) measurements from space are independent of daytime and weather conditions and can provide valuable information for monitoring of flood events. This is mainly due to the fact that smooth water surface provides no return to antenna in microwave spectrum and appears black in SAR imagery [4]. In contrast, a windruffled surface can give backscatter larger than that of the surrounding land. This, in turn, considerably complicates the detection of water surfaces on SAR images for flood applications. Though such surfaces are not present in our data sets, we plan to investigate the influence of the wind on water detection from SAR imagery in the future works. Flood mapping procedure from SAR imagery consists, as a rule, of the following steps. The first step consists in re-constructing a satellite imagery taking into account the calibration, the terrain distortion using digital elevation model (DEM) and providing exact geographical coordinates. The second step is image segmentation, and the third step consists in the classification to determine the flood extent. This paper presents a neural network approach to flood mapping from satellite SAR imagery that is based on the application of self-organizing Kohonen’s maps (SOMs) [5, 6]. The advantage of using SOMs is that they provide effective software tool for the visualization of high-dimensional data, automatically discover statistically salient features of pattern vectors in data set, and can find clusters in training data pattern space which can be used to classify new patterns [5]. We applied our approach to the processing of data acquired from different satellite SAR instruments (ERS-2/SAR, ENVISAT/ASAR, RADARSAT-1) for different flood events: Tisza river, Ukraine and Hungary, 2001; Huaihe river, China, 2007; Mekong river, Thailand and Laos, 2008; and Koshi river, India and Nepal, 2008. 2 RELATED WORKS To this end, different methods were proposed to flood mapping using satellite imagery. European Space Agency (ESA) uses a multi-temporal technique to the flood extent extraction from SAR images [7]. This technique uses SAR images of the same area taken on different dates (one image is acquired during flooding and the second one in “normal” conditions). The resulting multi-temporal image clearly reveals change in the Earth’s surface by the presence of colour in the image. Cunjian et al. [8] applied a threshold segmentation algorithm to flood extent extraction from RADARSAT-1 imagery with the support of digital topographic
A Neural Network Approach to Flood Mapping Using Satellite Imagery
1015
data. Flood extent was extracted from RADARSAT SAR imagery using threshold segmentation. Then, simulated SAR imagery was created from DEM and registered to RADARSAT SAR imagery. Shade from the simulated SAR image was used to mask the mislabeled flood extent from RADARSAT SAR due to its shadow influence. The drawback of this approach is that threshold value should be chosen manually, and will be specific for different SAR instruments and images. Csornai et al. [9] used ESA’s ERS-2 SAR images and optical data (Landsat TM, IRS WIFS/LISS, NOAA AVHRR) for flood monitoring in Hungary in 2001. To derive flood extent from SAR imagery, change detection technique is applied. This technique uses two images made before and during the flood event, and some “index” that reveals changes in two images and, thus, the presence of water due to the flooding (Wang 2002). Though these methods are rather simple and fast (in computational terms), they possess some disadvantages: they need manual threshold selection and image segmentation, require expertise in visual interpretation of SAR images and require the use of complex models for speckle reduction; spatial connections between pixels are not concerned. More sophisticated approaches have been proposed to segment SAR imagery for flood and coastal applications. Horrit [10] has developed a statistical active contour model for segmenting synthetic aperture radar (SAR) images into regions of homogeneous speckle statistics. The technique measures both the local tone and texture along the contour so that no smoothing across segment boundaries occurs. A smooth contour is favoured by the inclusion of a curvature constraint, whose weight is determined analytically by considering the model energy balance. The algorithm spawns smaller snakes to represent multiply connected regions. The algorithm was tested to segment SAR imagery from ESA’s ERS-1 satellite. The proposed approach was capable of segmenting noisy SAR imagery whilst accurately depicting (to within 1 pixel) segment boundaries. However, application of active contour algorithm, in general, is subject to certain difficulties such as getting stuck in local minima, poor modelling of long concavities, and producing inaccurate results when the initial contour is chosen simple or far from the object boundary [11]. For statistical active contour models, one should also have a priori knowledge of image statistical properties. In a case of real SAR imagery, statistics may be badly represented by a modelled distribution. Moreover, spatial correlation and regions of smoothly varying statistics may also occur [10]. Dellepiane et al. [12] have proposed an innovative algorithm being able to discriminate water and land areas in order to extract semi-automatically the coastline by means of remote sensed SAR images. This approach is based on fuzzy connectivity concepts and takes into account the coherence measure extracted from an InSAR (Interferometric Synthetic Aperture Radar) couple. The method combines uniformity features and the averaged image that represents a simple way of facing textural characteristics. One major disadvantage of this method is that we should have two precisely co-registered SAR images in order to estimate InSAR coherence measure.
1016
S. Skakun
In an approach proposed by Niedermeier et al. [13], an edge-detection method is first applied to SAR images to detect all edges above a certain threshold. A blocktracing algorithm then determines the boundary area between land and water. The error is estimated by comparing the results achieved with a model based on visual inspection: the mean offset between the final edge and the model solution is estimated to be 2.5 pixels [13]. However, the number of the parameters and threshold values affecting processing robustness is considerable in this approach. Martinez and Le Toan [14] used a time series of 21 SAR images from L-band PALSAR instrument onboard JERS-1 satellite to map the flood temporal dynamics and the spatial distribution of vegetation over a large Amazonian floodplain. The mapping method is based on decision rules over two decision variables: 1. the mean backscatter coefficient computed over the whole time series; 2. the total change computed using an “Absolute Change” estimator. The classifier is first applied to the whole time series to map the maximum and minimum flood extent by defining 3 flood conditions: never flooded (NF); occasionally flooded (OF); permanently flooded (PF). Then, the classifier is run iteratively on the OF pixels to monitor flood stages during which the occasionally flooded areas get submerged. The mapping accuracy is assessed on one intermediate flood stage, showing a precision in excess of 90 %. However, to achieve this precision the proposed classifier should be built on more than 8 images [14]. In this paper, we propose a neural network approach to flood mapping from satellite SAR imagery. Our approach is based on segmentation of a single SAR image using self-organizing Kohonen maps (SOMs) and further image classification using auxiliary information on water bodies that could be derived, for example, from Landsat-7/ETM+ images and Corine Land Cover (for European countries). 3 DATA SETS DESCRIPTION We applied our approach to the processing of remote-sensing data acquired from different satellite SAR instruments (ERS-2/SAR, ENVISAT/ASAR, RADARSAT-1) for different flood events: 1. Tisza river, Ukraine and Hungary, 2001; 2. Huaihe river, China, 2007; 3. Mekong river, Thailand and Laos, 2008 (see Figure 1); and 4. Koshi river, India and Nepal, 2008 (see Figure 2). Data from European satellites (ERS-2 and ENVISAT) were provided from ESA Category-1 project “Wide Area Grid Testbed for Flood Monitoring using Spaceborne SAR and Optical Data” (4181). Data from RADARSAT-1 satellite were provided from the Center of Earth Observation and Digital Earth (China).
A Neural Network Approach to Flood Mapping Using Satellite Imagery
1017
Pixel size and ground resolution of ERS-2 imagery (in ENVISAT format, SLC – Single Look Complex) were 4 m and 8 m, respectively; for ENVISAT imagery they were 75 m and 150 m; and for RADARSAT-1 imagery they were 12.5 m and 25 m. We used the following set of auxiliary data to derive information on water bodies: Landsat-7/ETM+, European Corine Land Cover (CLC 2000) and SRTM DEM (version 3). Neural network is built for each SAR instrument separately. In order to train and test neural networks, we manually selected the ground-truth pixels with the use of auxiliary data sets that correspond to both territories with the presence of water (we denote them as belonging to class “Water”) and without water (class “No water”). The number of the ground-truth pixels for each of the image is presented in Table 1. For ENVISAT/ASAR instrument, data from Chinese flood event was used to construct and calibrate the neural network. This neural network, then, was used to produce flood maps for India and Nepal, and Thailand and Laos events.
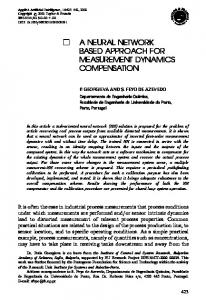
Fig. 1. SAR image acquired from ENVISAT satellite (date of acquisition 16.08.2007) durc ESA 2008) ing the flooding on the river Mekong, Thailand and Laos (
For each image from Table 1, these data was randomly divided into the training set (which constituted 75 % of total amount) and the testing set (25 %). Data from the training set were used to train the neural networks, and data from the testing set were used to verify the generalization ability of the neural networks, i.e. the ability to operate on independent, previously unseen data sets [6].
1018
S. Skakun Satellite image/Region ERS-2/Ukraine ENVISAT/China RADARSAT-1/China
Number of ground-truth pixels for images “No water” “Water” Total 148 182 153 096 301 278 60 575 34 493 95 068 135 263 130 244 265 507
Table 1. Distribution of the ground-truth pixels for ERS-2, ENVISAT and RADARSAT-1 images
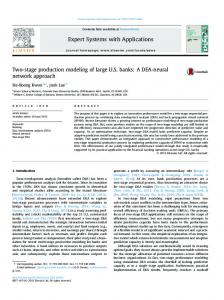
Fig. 2. SAR image acquired from ENVISAT satellite (20. 08. 2007) during the flooding on c ESA 2008) the river Koshi, India and Nepal (
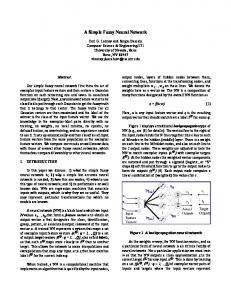
4 METHODOLOGY DESCRIPTION Our flood mapping procedure from SAR imagery consists of the following steps: 1. data pre-processing (calibration, geocoding, i.e. providing exact geographical coordinates, and orthorectification), and 2. segmentation and classification on two classes using SOMs. SOM is a type of artificial neural network that is trained using unsupervised learning to produce a low-dimensional (typically two dimensional), discretised representation of the input space of the training samples, called a map [5, 6]. The map seeks to preserve the topological properties of the input space. SOM is formed of the neurons located on a regular, usually 1- or 2-dimensional grid (see Figure 3). Neurons compete with each other in order to pass to the excited state. The output
A Neural Network Approach to Flood Mapping Using Satellite Imagery
1019
of the map is a so called neuron-winner or best-matching unit (BMU) whose weight vector has the greatest similarity with the input sample x. The network is trained in the following way: weight vectors wj from the topological neighbourhood of BMU vector i are updated according to [5, 6] i(x) = arg min kx − wj k , j=1,L
wj (n + 1) = wj (n) + η(n)hj,i(x)(n)(x − wj (n)), j = 1, L,
(1)
where η is learning rate (see Equation (3)), hj,i(x) (n) is a neighbourhood kernel around the winner unit i, x is an input vector, k•k means Euclidean metrics, L is the number of neurons in the output grid, n denotes the number of iteration in the learning phase. Inputs
2-D grid of neurons (3-by-4)
Fig. 3. An example of SOM architecture
The neighbourhood kernel function hj,i(x) (n) is taken to be the Gaussian
hj,i(x) (n) = exp −
rj
− ri(x)
2σ 2 (n)
(2)
where rj , ri(x) are the vectorial locations in the display grid of the SOM, σ(n) corresponds to the width of the neighborhood function, which is decreasing monotonically with the regression steps. For learning rate we used the following expression: n
η(n) = η0 · e− τ , η0 = 0.1,
(3)
where τ is a constant. The initial value of 0.1 for learning rate was found experimentally. Kohonen’s maps are widely applied to the image processing, in particular image segmentation and classification [5, 6]. Prior neural network training, we need to select image features that will be given to the input of neural network. For this
1020
S. Skakun
purpose, one can choose original pixel values, various filters, Fourier transformation, etc. In our approach we used a moving window with backscatter coefficient values for ERS-2 and ENVISAT images and digital numbers (DNs) for RADARSAT-1 image as inputs to neural network. The output of neural network, i.e. neuron-winner, corresponds to the central pixel of moving window. In order to choose appropriate size of the moving window for each satellite sensor, we ran experiments for the following windows size: 3-by-3, 5-by-5, 7-by-7, 9-by-9 and 11-by-11. We, first, used SOM to segment each SAR image where each pixel of the output image was assigned a number of the neuron in the map. Then, we used pixels from the training set to assign each neuron one of two classes (“Water” or “No water”) using the following rule. For each neuron, we calculated a number of pixels from the training set that activated this neuron. If maximum number of these pixels belonged to class “Water”, then this neuron was assigned the “Water” class. If maximum number of these pixels belonged to class “No water”, then this neuron was assigned the “No water” class. If neuron was activated by neither of the training pixels, then it was assigned the “No data” class. 5 RESULTS OF IMAGE PROCESSING In order to choose the best neural network architecture, we ran experiments for each image varying the following parameters: 1. size of the moving window for images that define the number of neurons in the input layer of the neural network; 2. the number of neurons in the output layer, i.e. the sizes of 2-dimensional output grid. Other parameters that were used during the image processing are as follows: • neighbourhood topology is hexagonal; • neighbourhood kernel around the winner unit is the Gaussian function (see Equation (2)); • initial learning rate is set to 0.1; • number of the training epochs is equal to 20. The initial values for the weight vectors are selected as a regular array of vectorial values that lie in the subspace spanned by the eigenvectors corresponding to the two largest principal components of the input data [5]. The results of experiments for the images are presented in Table 2. For the images with higher spatial resolution (i.e. ERS-2 and RADARSAT-1), the best results were achieved for larger moving window (7-by-7). In turn, for the ENVISAT/ASAR WSM image, we used the moving window of smaller size (3-by-3). The use of higher dimension of input window for the ENVISAT image led to the coarser resolution of the resulting flood extent image and reduced classification rate.
A Neural Network Approach to Flood Mapping Using Satellite Imagery
Input dimension Output grid of neurons Classification “No water” “Water” rate for training Total set Classification “No water” “Water” rate for testing Total set
ERS-2 7-by-7 10-by-10 79.40 % 90.99 % 85.29 % 79.57 % 91.06 % 85.40 %
1021
Satellite image ENVISAT RADARSAT-1 3-by-3 7-by-7 7-by-5 5-by-5 100.0 % 99.99 % 95.64 % 91.93 % 98.41 % 96.04 % 100.0 % 99.99 % 95.90 % 91.89 % 98.52 % 95.99 %
Table 2. Results of SAR images classification using SOMs
The examples of resulting flood extent maps derived from ENVISAT data acquired for the Mekong river, Thailand and Laos (see Figure 1) and Koshi river, India and Nepal (see Figure 2) are shown in Figures 4 and 5.
Fig. 4. The resulting flood extent shown with black colour for the Mekong river, Thailand c and Laos ( ESA 2008)
1022
S. Skakun
Fig. 5. The resulting flood extent shown with black colour for the Koshi river, India and c Nepal ( ESA 2008)
6 CONCLUSIONS In this paper we proposed a neural network approach to flood mapping using satellite SAR imagery. To segment and classify SAR image, we applied self-organizing Kohonen’s maps (SOMs) that possess such useful properties as ability to automatically discover statistically salient features of pattern vectors in data set, and to find clusters in training data pattern space which can be used to classify new patterns. As inputs to neuron network, we used a moving window of image pixels intensities. We ran experiments to choose the best neuron network architecture for different satellite sensors: for ERS-2 and RADARSAT-1 the size of input was 7-by-7 and for ENVISAT/ASAR the moving window was 3-by-3. Our approach has the following advantages as comparing to the existing ones: 1. we apply a moving window to process the image and thus take into account spatial connection between the pixels of the image; 2. neural network’s weights are adjusted automatically using ground-truth training data; 3. to determine flood areas, we need to process a single SAR image. This enables implementation of our approach in automatic services for flood monitoring. Considering the selection of ground-truth pixels to calibrate the neuron
A Neural Network Approach to Flood Mapping Using Satellite Imagery
1023
network, i.e. to assign each neuron one of the classes (“Water” and “No water”), this process can be also automated using geo-referenced information on water bodies for the given region. We applied our approach to determine flood areas from SAR images acquired by three different sensors: ERS-2/SAR, ENVISAT/ASAR and RADARSAT-1. Classification rates for these sensors using independent testing data sets were 85.40 %, 98.52 % and 95.99 %, respectively. These results demonstrate the efficiency of our approach. Acknowledgments This work is supported by joint project of INTAS, the Centre National d’Etudes Spatiales (CNES) and the National Space Agency of Ukraine (NSAU), “Data Fusion Grid Infrastructure” (Ref. No. 06-1000024-9154), ESA CAT-1 project “Wide Area Grid Testbed for Flood Monitoring using Spaceborne SAR and Optical Data” (No. 4181), and by joint project of the Science and Technology Center in Ukraine (STCU) and the National Academy of Sciences of Ukraine (NASU), “Grid Technologies for Multi-Source Data Integration” (No. 4928).
REFERENCES [1] Scheuren, J.-M.—le Polain de Waroux, O.—Below, R.—Guha-Sapir, D.—Ponserre, S.: Annual Disaster Statistical Review – The Number and Trends 2007. Center for Research of the Epidemiology of Disasters (CRED), Jacoffsaet Printers, Melin, Belgium 2008. [2] Horritt, M. S.: A Methodology for the Validation of Uncertain Flood Inundation Models. Journal of Hydrology 326, 2006, pp. 153–165. [3] Corbley, K. P.: Radar Imagery Proves Valuable in Managing and Analyzing Floods; Red River flood demonstrates operational capabilities. Earth Observation Magazine, Vol. 8, 1999, No. 10. [4] Rees, W. G.: Physical Principles of Remote Sensing. Cambridge University Press 2001. [5] Kohonen, T.: Self-Organizing Maps. Series in Information Sciences, Vol. 30, Springer, Heidelberg 1995. [6] Haykin, S.: Neural Networks: A Comprehensive Foundation. Upper Saddle River, New Jersey: Prentice Hall 1999. [7] ESA Earth Watch, http://earth.esa.int/ew/floods. [8] Cunjian, Y.—Yiming, W.—Siyuan, W.—Zengxiang, Z.—Shifeng, H.: Extracting the Flood Extent from Satellite SAR Image With the Support of Topographic Data. In: Proc of Int. Conf on Inf. Tech. and Inf. Networks (ICII 2001), Vol. 1, pp. 87–92. ´ ´dor, G.—La ´szlo ´ , I.—Cseko ¨ , A.—Wirn[9] Csornai, G.—Suba, Zs.—Na ´sz, L.—Martinovich, L.: Evaluation of a Remote Sensing hardt, Cs.—Tika
1024
[10] [11] [12]
[13]
[14]
S. Skakun
Based Regional Flood/Waterlog and Drought Monitoring Model Utilising MultiSource Satellite Data Set Including ENVISAT Data. In: Proc. of the 2004 ENVISAT & ERS Symposium, Salzburg, Austria, September 6–10, 2004. Horritt, M. S.: A Statistical Active Contour Model for SAR Image Segmentation. Image and Vision Computing 17, 1999, pp. 213–224. Shah-Hosseini, H.—Safabakhsh, R. A.: TASOM-Based Algorithm for Active Contour Modelling. Pattern Recognition Letters, Vol. 24, 2003, pp. 1361–1373. Dellepiane, S.—de Laurentiis, R.—Giordano, F.: Coastline Extraction from SAR Images and a Method for the Evaluation of the Coastline Precision. Pattern Recognition Letters, Vol. 25, 2004, pp. 1461–1470. Niedermeier, A.—Romaneeßen, E.—Lenher, S.: Detection of Coastline in SAR Images Using Wavelet Methods. IEEE Transactions Geoscience and Remote Sensing, Vol. 38, 2000, No. 5, pp. 2270–2281. Martinez, J. M.—le Toan, T.: Mapping of Flood Dynamics and Spatial Distribution of Vegetation in the Amazon Floodplain Using Multitemporal SAR Data. Remote Sensing of Environment, Vol. 108, 2007, pp. 209–223.
Sergii Skakun is a Senior Scientist at the Space Research Institute of NASU-NSAU, Associate Professor at the National Technical University of Ukraine “Kiev Polytechnic Institute”. He received Ph. D. degree in system analysis and theory of optimal solutions from the Space Research Institute of NASU-NSAU in 2005, M. Sc. degree with honour in applied mathematics from the Physics and Technology Institute of the National Technical University of Ukraine “Kiev Polytechnic Institute” in 2004. He is a member of the CEOS Working Group on Information Systems and Services (WGISS). He current research interests include sensor web, Earth observation, Grid, satellite data processing. He is an author of more than 110 journal and conference papers and 1 book in these areas.