Zhang et al. BMC Proceedings 2013, 7(Suppl 7):S10 http://www.biomedcentral.com/1753-6561/7/S7/S10
PROCEEDINGS
Open Access
A neural network approach to multi-biomarker panel discovery by high-throughput plasma proteomics profiling of breast cancer Fan Zhang1,2*, Jake Chen3,4,5,7, Mu Wang5,6, Renee Drabier1* From Great Lakes Bioinformatics Conference 2013 Pittsburgh, PA, USA. 14-16 May 2013
Abstract Background: In the past several years, there has been increasing interest and enthusiasm in molecular biomarkers as tools for early detection of cancer. Liquid chromatography tandem mass spectrometry (LC/MS/MS) based plasma proteomics profiling technique is a promising technology platform to study candidate protein biomarkers for early detection of cancer. Factors such as inherent variability, protein detectability limitation, and peptide discovery biases among LC/MS/MS platforms have made the classification and prediction of proteomics profiles challenging. Developing proteomics data analysis methods to identify multi-protein biomarker panels for breast cancer diagnosis based on neural networks provides hope for improving both the sensitivity and the specificity of candidate cancer biomarkers for early detection. Results: In our previous method, we developed a Feed Forward Neural Network-based method to build the classifier for plasma samples of breast cancer and then applied the classifier to predict blind dataset of breast cancer. However, the optimal combination C* in our previous method was actually determined by applying the trained FFNN on the testing set with the combination. Therefore, in this paper, we applied a three way data split to the Feed Forward Neural Network for training, validation and testing based. We found that the prediction performance of the FFNN model based on the three way data split outperforms our previous method and the prediction performance is improved from (AUC = 0.8706, precision = 82.5%, accuracy = 82.5%, sensitivity = 82.5%, specificity = 82.5% for the testing set) to (AUC = 0.895, precision = 86.84%, accuracy = 85%, sensitivity = 82.5%, specificity = 87.5% for the testing set). Conclusions: Further pathway analysis showed that the top three five-marker panels are associated with complement and coagulation cascades, signaling, activation, and hemostasis, which are consistent with previous findings. We believe the new approach is a better solution for multi-biomarker panel discovery and it can be applied to other clinical proteomics.
Introduction Breast cancer is the most common cancer among American women, except for skin cancers. About 1 in 8 (12%) women in the US will develop invasive breast cancer during their lifetime. In 2012, an estimated 226, 870 new cases of invasive breast cancer were expected to be diagnosed in women * Correspondence:
[email protected];
[email protected] 1 Department of Academic and Institutional Resources and Technology, University of North Texas Health Science Center, Fort Worth, USA Full list of author information is available at the end of the article
in the U.S., along with 63,300 new cases of non-invasive (in situ) breast cancer [1]. In recent years, functional genomics studies using DNA Microarrays have been shown effective in differentiating between breast cancer tissues and normal tissues by measuring thousands of differentially expressed genes simultaneously [2-4]. However, early detection and treatment of breast cancer is still challenging. One reason is that obtaining tissue samples for microarray analysis can still be difficult. Another reason is that genes are not directly
© 2013 Zhang et al.; licensee BioMed Central Ltd. This is an Open Access article distributed under the terms of the Creative Commons Attribution License (http://creativecommons.org/licenses/by/2.0), which permits unrestricted use, distribution, and reproduction in any medium, provided the original work is properly cited. The Creative Commons Public Domain Dedication waiver (http:// creativecommons.org/publicdomain/zero/1.0/) applies to the data made available in this article, unless otherwise stated.
Zhang et al. BMC Proceedings 2013, 7(Suppl 7):S10 http://www.biomedcentral.com/1753-6561/7/S7/S10
involved in any physical functions. On the contrary, the proteome are the real functional molecules and the keys to understanding the development of cancer. Moreover, the fact that breast cancer is a complex disease where disease genes exhibit an increased tendency for their protein products to interact with one another [5,6], makes the disease difficult to detect in early stages by singlemarker approach. A chance of success with a multibiomarker panel is higher than the simpler conventional single-marker approach [6]. Recent advances in clinical proteomics technology, particularly liquid chromatography coupled tandem mass spectrometry (LC-MS/MS) have enabled biomedical researchers to characterize thousands of proteins in parallel in biological samples. Using LC-MS/MS, it has become possible to detect complex mixtures of proteins, peptides, carbohydrates, DNA, drugs, and many other biologically relevant molecules unique to disease processes [7]. A modern mass spectrometry (MS) instrument consists of three essential modules: an ion source module that can transform molecules to be detected in a sample into ionized fragments, a mass analyzer module that can sort ions by their masses, charges, or shapes by applying electric and magnetic fields, and a detector module that can measure the intensity or abundance of each ion fragment separated earlier. Tandem mass spectrometry (MS/MS) has additional analytical modules for bombarding peptide ions into fragment peptide ions by pipelining two MS modules together, therefore providing peptide sequencing potentials for selected peptide ions in real time. LC-MS/ MS proteomics has been used to identify candidate molecular biomarkers in a diverse range of samples, including cells, tissues, serum/plasma, and other types of body fluids. Due to the inherent high variability of both clinical samples and MS/MS instruments, it is still challenging to classify and predict proteomics profiles without an advanced computational method. Developing a proteomics data analysis method to identify multi-protein biomarker panels for breast cancer diagnosis based on neural networks, therefore, provides hope for improving both the sensitivity and the specificity of candidate disease biomarkers. Neural Networks have several unique advantages and characteristics as research tools for cancer prediction problems [8-12]. A very important feature of these networks is their adaptive nature, where “learning by example” replaces conventional “programming by different cases” in solving problems [13]. The classification problem of breast cancer can be restricted to consideration of the two-class problem without loss of generality (breast cancer and normal). In the early case study [13], we developed a Feed Forward Neural Network-based method to build the classifier for plasma samples of breast cancer and then applied the classifier to predict blind dataset of breast cancer.
Page 2 of 8
However, the optimal combination C* was actually determined by applying the trained Feed Forward Neural Network (FFNN) on the testing set with the combination, which maximizes the AUC. Therefore, in this paper, we applied a three way data split to the FFNN for training, validation and testing based. Our results show the prediction performance of the FFNN model based on the three way data split outperforms our previous method in the earlier study [13]. We present the multi-marker panel development solution for early detection of breast cancer using the FFNN model based on three way data split, and show how to use it to model the classification and prediction problem of early detection of breast cancer in plasma proteomics.
Materials and methods Human plasma samples
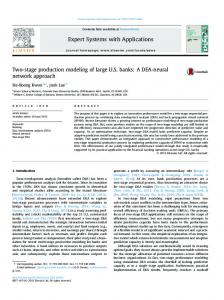
Three batches of plasma samples were collected by the Hoosier Oncology Group (HOG) (Indianapolis, IN, USA), which we call Study A, Study B, and Study C. Study A and Study B each contain 40 plasma samples from women with breast cancer and 40 plasma samples from healthy age-matched volunteer women as control. Study C collects 40 plasma samples with 20 samples from women diagnosed with breast cancer and 20 from healthy volunteer woman. All samples in the three studies were collected with the same standard operating procedure and stored in a central repository in Indianapolis, IN, USA. Study A, B and C were processed in the same laboratory but at different times. Each sample was analyzed in a single batch by mass spectrometry. The demography and clinical distribution of breast cancer stages for study A and B and C are comparable (Table 1), although the total sample number of Study C is somewhat smaller than Study A and B. For example, all patients involved in the three studies were diagnosed with a stage II or earlier breast cancer. Figure 1 indicates the degree of overlap among the proteins identified from three data sets: Study A, B and C. LC/MS/MS plasma proteomics analysis
Tryptic peptides were analyzed using Thermo-Fisher Scientific linear ion-trap mass spectrometer (LTQ) Table 1 Comparison of clinical distribution for study A and B and C Cancer type
Study A
Study B
Study C
30 INV
23 INV
15 INV
10 DCIS
8 DCIS
5 DCIS
9 unknown ER+/PR+
29
23
12
ER- PR- HER2+
11
17
8
ER-/PR-/HER2-
Zhang et al. BMC Proceedings 2013, 7(Suppl 7):S10 http://www.biomedcentral.com/1753-6561/7/S7/S10
Figure 1 Venn diagram of LC-MS/MS results.
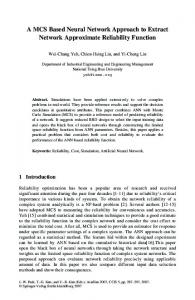
coupled with a Surveyor HPLC system (Thermo-Fisher Scientific) to identify proteins. Peptides were first eluted with a gradient from 5 to 45% Acetonitrile developed over 120 minutes at a flow rate of 50 μL/min. Data were collected in the triple-play mode (for example a) primary MS scan, b) zoom scan, and c) MS/MS scan in Figure 2) [14]. Lastly, the raw peak list data were generated by XCalibur (version 2.0) using default parameters and
Page 3 of 8
further analyzed by a label-free identification and quantitative algorithm using default parameters described by Higgs et al [15]. We performed the MS database search against the International Protein Index (IPI, version 3.6, Figure 2d) [16]. Protein quantification was carried out using the same algorithm mentioned before [15]. Briefly, first all extracted ion chromatograms (XIC) were aligned by retention time. Each aligned peak was matched by parent ion, charge state, daughter ions (MS/MS data) and retention time within a one-minute window. Then, the areaunder-the-curve (AUC) for each individually aligned peak was measured, normalized, and compared for their relative abundance using methods described in [14,15]. Linear mixed model
After transformation to a log2 scale and quantile normalization [17], the protein intensity is the final quantity that is fit by a separate analysis of variance (ANOVA) statistical model for each protein as yijk using the following: yijk = μ + Tj + Sk + Ii + εijk ,
Figure 2 Triple play mode (a) primary mass spectrum; b) zoom scan mass spectrum; c) MS/MS mass spectrum and d) protein identification from MS/MS).
Zhang et al. BMC Proceedings 2013, 7(Suppl 7):S10 http://www.biomedcentral.com/1753-6561/7/S7/S10
where Ii ∼ N(0, σ12 ), Sk ∼ N(0, σ22 ), εjk ∼ N(0, σ 2 ) Here, μ is the mean intensity value, Tj is the fixed group effect (caused by the experimental conditions or treatments being evaluated), Sk is the random sample effect (random effects from either individual biological samples or sample preparations), Ii is the random replicate effect (random effects from replicate injections of the same sample), and εijk is the within-groups errors. All of the injections were in random order and the instrument was operated by the same operator. All random effects are assumed independent of each other and independent of the within-group errors εijk. Feed forward neural network
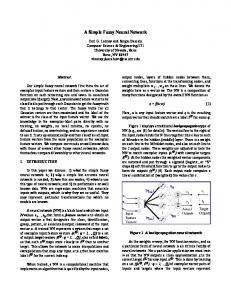
A generalized Feed Forward Neural Network (FFNN) has three layers: input layer, hidden layer, and output layer and is trained using a back propagation supervised training algorithm. The input is used as activation for the input layer and is propagated to the output layer. The received output is then compared to the desired output and an error value is calculated for each node in the output layer. The weights on edges going into the output layer are adjusted by a small amount relative to the error value. This error is propagated backwards through the network to correct edge weights at all levels. For example, Figure 3 described a feed
Figure 3 Feed forward neural network for five-biomarker panel.
Page 4 of 8
forward neural network with an input layer of 5 nodes (corresponding to a five-marker panel), a hidden layer of 3 nodes, and an output layer of two-variable encoding scheme [healthy = (0,1), cancer = (1,0)]. We used empirically-derived rules-of-thumb, the most commonly relied on, which is ‘the optimal size of the hidden layer is usually between the size of the input and size of the output layers’ [18] to determinate the size of hidden layer. The classification problem of breast cancer can be restricted to consideration of the two-class problem without loss of generality (breast cancer and normal). An FFNN-based method [13] was used to develop the classifier for plasma samples of breast cancer and then applied the classifier to predict blind dataset of breast cancer. Based on the FFNN-based method, however, we apply in the paper a three way data split for training, validation and testing, instead of directly using Study A as a training set and Study B as a testing set in the [13]. Briefly, Study A is used as the training set for learning to fit the parameters of the classifier, Study C as the validation set to tune the parameters of the classifier, and Study B as the testing set only to assess the performance of the fullytrained classifier. The enumeration method based on FFNN was built to identify optimal biomarkers panel by us [13]. Similarly,
Zhang et al. BMC Proceedings 2013, 7(Suppl 7):S10 http://www.biomedcentral.com/1753-6561/7/S7/S10
we designed an enumeration method based on the three way data split and the FFNN to find the optimal classifier, which measures the area under the curve (AUC) for Receiver Operating Characteristics (ROC). Each combination of N (N = 5 for five-marker panel) out of all the 32 genes differentially expressed in the training set is chosen as inputs to the FFNN. We select N = 5 because 1) Li estimated that five or six genes rather than 37 or 738 would be sufficient for the early detection of breast cancer, based on colon cancer, leukemia, and breast cancer [19], 2) we expect to achieve high prediction accuracy for breast cancer with as few genes as possible, and 3) we applied N = 5 to the prediction of breast cancer in our previous study and achieved satisfied prediction performance [13]. In this scheme, we first train the FFNN for each combination in the training set with 5-fold cross-validation. Then, we measure the AUC for each combination in the validation set. Lastly, the optimal combination C* was determined by C∗ = argmaxC AUC(NETC , V),
where AUC is the area under the ROC curve of the FFNN, C is combination of picking five out of the 32 genes, and V is the validation set. Pathway analysis
Pathway analysis is performed using the following databases: Integrated Pathway Analysis Database (IPAD) http://bioinfo.hsc.unt.edu/ipad/[20].
Results and discussions The plasma proteome sets from Study A, B, and C contains 1423, 1389, and 1249 proteins, respectively. 246 proteins are in common between the three datasets. After ANOVA analysis of the 246 proteins in the Study A, we obtained 32 candidate markers in the training set with pvalue < 0.01. No data from the testing set were utilized in 1) identification of breast cancer markers or 2) development of the FFNN model. The validation set was used to tune the parameters of the FFNN model. Based on an FFNN model that was built on all 60 markers differentially expressed in Study A and Study B, a high performance (AUC = 0.8713, precision = 86.8%, accuracy = 85%, sensitivity = 82.5%, specificity = 87.5% for the training set; AUC = 0.8706, precision = 82.5%, accuracy = 82.5%, sensitivity = 82.5%, specificity = 82.5% for the testing set) was obtained [13]. However, the optimal combination C* was actually determined by applying the trained FFNN on the testing set with the combination, which maximizes the AUC. This step obtained an objective optimization with training set and testing set. Therefore, in this paper, we applied the three way data split for training, validation and testing and constructed an FFNN
Page 5 of 8
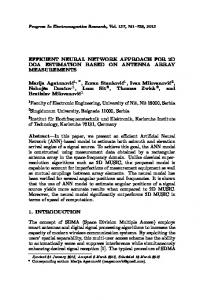
for each combination of five out of the 32 markers and trained with plasma samples derived from 40 women diagnosed with breast cancer and 40 control women in the training set. The optimal combinations were obtained by our optimization model based on the training set and validation set instead of the training set and testing set we used in [13]. Training of the FFNN was performed using back propagation algorithm for two-variable encoding scheme, because we had verified that the two-variable encoding scheme performed better than single-variable encoding scheme [13]. Five performance measurements: (1) Sensitivity; (2) Specificity; (3) Precision; (4) Accuracy; and (5) Area Under the Curve were computed in order to evaluate the prediction performance of the FFNN. In order to validate our prediction method, we compared the ROCs for the best five 5-marker panel predictions determined by our method with the ROCs for five randomly chosen 5-marker panels from 32 candidate biomarkers (Figure 4). As shown in the Figure 4, the top five best predictions determined by our method (solid lines) has better sensitivity-specificity-tradeoff performance than those chosen randomly from 32 candidate biomarkers. Table 2 shows the best three five-marker panels identified using the FFNN and the three way data split. Gene C4BPA is in common between the best three fivemarker panels and gene SRCRB4D shows up twice. Pathway analysis shows the pathways linked with the best three five-marker panels are complement and coagulation cascades, signaling, activation, and hemostasis (Table 3), which are consistent with previous results we found [6]. The confusion matrix and common performance metrics for the training set, testing set, and validation set for the best five-marker panel is shown in the Table 4. Although the final sensitivity is 82.5%, the same as previous result in [13], the other performance measures are improved. For example, the final accuracy increases from 82.5% to 85% and the final specificity from 82.5% to 87.5% (Table 4). In addition, the AUC, a comprehensive measurement of sensitivity and specificity, is improved from 0.8706 to 0.895 (Figure 4). The prediction performance of the FFNN model based on three way data split (Study A as training set, Study B as testing set, and Study C as validation set ) actually outperforms our previous method in [13]. For example, the specificities are both 87.5% for the training sets. But after using the validation set to tune the parameter of the model, the final specificity for the testing set is improved from 82.5% to 87.5%. We also compared the three way data split with other combination such as mixing three datasets. When mixing three datasets together, the best marker panel has the same performance in the training mode (precision = 87.5%, accuracy = 87.5%, sensitivity = 87.5%, specificity = 87.5%), and a little higher performance in the testing
Zhang et al. BMC Proceedings 2013, 7(Suppl 7):S10 http://www.biomedcentral.com/1753-6561/7/S7/S10
Page 6 of 8
Figure 4 A comparison of best five 5-marker panel ROCs (solid lines) and randomly chosen five (out of 32 candidates) 5-marker ROCs (dotted lines).
Table 2 Best three five-marker panels identified Panel
SSE1
Accuracy Training Set
Testing Set
Validation Set
C4BPA; HP; ORM1; SAMD9; SRCRB4D
3.3E-2
0.875
0.85
0.85
C4BPA; STBD1; DDX24; GRASP; CFI
5.6E-2
0.875
0.8375
0.85
C4BPA; CNO; FGG; SERPING1; SRCRB4D
1.9E-2
0.8625
0.85
0.85
Table 3 Pathway analysis for the best three five-marker panels. PathwayID
PathwayName
Molecule
hsa04610
Complement and coagulation cascades
FGG;SERPING1;C4BPA;CFI
h_intrinsicPathway
Intrinsic Prothrombin Activation Pathway
FGG;SERPING1
140877
Formation of Fibrin Clot (Clotting Cascade)
FGG;SERPING1
114608 76005
Platelet degranulation Response to elevated platelet cytosolic Ca2+
SERPING1;FGG SERPING1;FGG
hsa05133
Pertussis
SERPING1;C4BPA
hsa05150
Staphylococcus aureus infection
FGG;CFI
354194
GRB2:SOS provides linkage to MAPK signaling for Intergrins
FGG
140875
Common Pathway
FGG
76002
Platelet activation, signaling and aggregation
FGG;SERPING1
372708
p130Cas linkage to MAPK signaling for integrins
FGG
h_extrinsicPathway h_fibrinolysisPathway
Extrinsic Prothrombin Activation Pathway Fibrinolysis Pathway
FGG FGG
140837
Intrinsic Pathway
SERPING1
h_amiPathway
Acute Myocardial Infarction
FGG
200138
Beta2 integrin cell surface interactions
FGG
200204
Ephrin B reverse signalling
FGG
200037
CD40/CD40L signalling
C4BPA
354192
Integrin alphaIIb beta3 signaling
FGG
Zhang et al. BMC Proceedings 2013, 7(Suppl 7):S10 http://www.biomedcentral.com/1753-6561/7/S7/S10
Page 7 of 8
Table 3 Pathway analysis for the best three five-marker panels. (Continued) 76009
Platelet Aggregation (Plug Formation)
FGG
200043
Beta3 integrin cell surface interactions
FGG
200061
Regulation of RhoA activity
HP
200139 200146
Urokinase-type plasminogen activator (uPA) and uPAR-mediated signalling IL6-mediated signaling events
FGG FGG HP
hsa05143
African trypanosomiasis
432722
Golgi Associated Vesicle Biogenesis
CNO
109582
Hemostasis
FGG;SERPING1
199992
trans-Golgi Network Vesicle Budding
CNO
421837
Clathrin derived vesicle budding
CNO
200016
Beta1 integrin cell surface interactions
FGG
Table 4 Prediction result for the best 5-marker panel Predicted
Training Set
Testing Set
Cancer
Normal
Validation Set Cancer
Normal
Cancer
Normal
Cancer
35
5
33
5
17
3
Normal
5
35
7
35
3
17
Precision Accuracy
87.5% 87.5%
86.84% 85%
85% 85%
Sensitivity
87.5%
82.5%
85%
Specificity
87.5%
87.5%
85%
mode (Study B as testing set, precision = 87.18%, accuracy = 86.25%, sensitivity = 85%, specificity = 87.5%). The reason why the performance is higher in the testing mode is because the mixture of three datasets already contains the testing set and the testing set is not independent of the training set. The three way data split method is more close to real applications where testing data are blind or unknown. The prediction performance of the testing set in a three-way data split can better reflect the outcome in a real application than other combination such as the mixture of three datasets. We believe the new approach is a better solution for multi-biomarker panel discovery and it can be applied to other clinical proteomics.
Conclusions We developed a Feed Forward Neural Network approach that addressed a challenging multi-panel biomarker development problem in the early detection of breast cancer. The approach that we used combined the three way data split with an optimization model of FFNN. We found that the prediction performance of the FFNN model combined with the three way data split outperforms our previous method. Further pathway analysis showed that the top three five-marker panels are associated with complement and coagulation cascades, signaling, activation, and hemostasis, which are consistent with previous findings. We believe the new method is a better solution for multi-biomarker panel discovery and can
provide general guidance for future molecular medicine multi-marker panel discovery applications in other diseases. In the future, we will follow up with biological experiments to validate these biomarkers with our collaborators.
Competing interests The authors declare that they have no competing interests. Authors’ contributions RD and FZ conceived the initial work and designed the method. FZ and RD developed the prediction method, and performed the computational analyses. MW and JC provided experimental data. All authors are involved in the drafting and revisions of the manuscript. Acknowledgements We thank Hoosier Oncology Group for collecting breast cancer plasma samples. The proteomics study for biomarker discovery was supported by the National Cancer Institute Clinical Proteomics Technology Assessment for Cancer program (U24 CA126480). We also thank the support of Bioinformatics Program at University of North Texas Health Science Center. Declarations Publication of this work was supported by the Bioinformatics Program at University of North Texas Health Science Center. This article has been published as part of BMC Proceedings Volume 7 Supplement 7, 2013: Proceedings of the Great Lakes Bioinformatics Conference 2013. The full contents of the supplement are available online at http://www.biomedcentral.com/bmcproc/supplements/7/S7. Authors’ details 1 Department of Academic and Institutional Resources and Technology, University of North Texas Health Science Center, Fort Worth, USA. 2 Department of Forensic and Investigative Genetics, University of North
Zhang et al. BMC Proceedings 2013, 7(Suppl 7):S10 http://www.biomedcentral.com/1753-6561/7/S7/S10
Texas Health Science Center, Fort Worth, USA. 3School of Informatics, Indiana University, Indianapolis, IN 46202, USA. 4Department of Computer and Information Science, School of Science, Purdue University, Indianapolis, IN 46202, USA. 5Indiana Center for Systems Biology and Personalized Medicine, Indianapolis, IN 46202, USA. 6Department of Biochemistry and Molecular Biology, Indiana University School of Medicine, USA. 7Institute of Biopharmaceutical Informatics and Technology, Wenzhou Medical College, Wenzhou, Zhejiang, China.
Page 8 of 8
doi:10.1186/1753-6561-7-S7-S10 Cite this article as: Zhang et al.: A neural network approach to multi-biomarker panel discovery by high-throughput plasma proteomics profiling of breast cancer. BMC Proceedings 2013 7(Suppl 7):S10.
Published: 20 December 2013 References 1. What are the key statistics about breast cancer?. [http://www.cancer.org/ Cancer/BreastCancer/DetailedGuide/breast-cancer-key-statistics]. 2. Hu X, Zhang Y, Zhang A, Li Y, Zhu Z, Shao Z, Zeng R, Xu LX: Comparative serum proteome analysis of human lymph node negative/positive invasive ductal carcinoma of the breast and benign breast disease controls via label-free semiquantitative shotgun technology. OMICS 2009, 13(4):291-300. 3. Zeidan BA, Cutress RI, Murray N, Coulton GR, Hastie C, Packham G, Townsend PA: Proteomic analysis of archival breast cancer serum. Cancer Genomics Proteomics 2009, 6(3):141-147. 4. Lebrecht A, Boehm D, Schmidt M, Koelbl H, Schwirz RL, Grus FH: Diagnosis of breast cancer by tear proteomic pattern. Cancer Genomics Proteomics 2009, 6(3):177-182. 5. Polyak K: Breast cancer: origins and evolution. J Clin Invest 2007, 117(11):3155-3163. 6. Zhang F, Chen JY: Discovery of pathway biomarkers from coupled proteomics and systems biology methods. BMC genomics 2010, 11(Suppl 2):S12. 7. Klampfl CW: Review coupling of capillary electrochromatography to mass spectrometry. J Chromatogr A 2004, 1044(1-2):131-144. 8. Lai KC, Chiang HC, Chen WC, Tsai FJ, Jeng LB: Artificial neural networkbased study can predict gastric cancer staging. Hepatogastroenterology 2008, 55(86-87):1859-1863. 9. Amiri Z, Mohammad K, Mahmoudi M, Zeraati H, Fotouhi A: Assessment of gastric cancer survival: using an artificial hierarchical neural network. Pak J Biol Sci 2008, 11(8):1076-1084. 10. Chi CL, Street WN, Wolberg WH: Application of artificial neural networkbased survival analysis on two breast cancer datasets. AMIA Annu Symp Proc 2007, 130-134. 11. Anagnostopoulos I, Maglogiannis I: Neural network-based diagnostic and prognostic estimations in breast cancer microscopic instances. Med Biol Eng Comput 2006, 44(9):773-784. 12. Wang HQ, Wong HS, Zhu H, Yip TT: A neural network-based biomarker association information extraction approach for cancer classification. J Biomed Inform 2009. 13. Fan Z, Chen JY: A neural network approach to multi-biomarker panel development based on LC/MS/MS proteomics profiles: A case study in breast cancer. Computer-Based Medical Systems, 2009 CBMS 2009 22nd IEEE International Symposium on: 2-5 Aug. 2009 2009, 1-6. 14. Wang M, You J, Bemis KG, Tegeler TJ, Brown DP: Label-free mass spectrometry-based protein quantification technologies in proteomic analysis. Brief Funct Genomic Proteomic 2008, 7(5):329-339. 15. Higgs RE, Knierman MD, Gelfanova V, Butler JP, Hale JE: Comprehensive label-free method for the relative quantification of proteins from biological samples. Journal of proteome research 2005, 4(4):1442-1450. 16. Kersey PJ, Duarte J, Williams A, Karavidopoulou Y, Birney E, Apweiler R: The International Protein Index: an integrated database for proteomics experiments. Proteomics 2004, 4(7):1985-1988. 17. Bolstad BM, Irizarry RA, Astrand M, Speed TP: A comparison of normalization methods for high density oligonucleotide array data based on variance and bias. Bioinformatics 2003, 19(2):185-193. 18. Heaton J: Introduction to Neural Networks for Java. Heaton Research, Inc.;, 2 2008. 19. Li W: How many genes are needed for early detection of breast cancer, based on gene expression patterns in peripheral blood cells? Breast cancer research : BCR 2005, 7(5):E5. 20. Zhang F, Drabier R: IPAD: the Integrated Pathway Analysis Database for Systematic Enrichment Analysis. BMC Bioinformatics 2012, 13(14).
Submit your next manuscript to BioMed Central and take full advantage of: • Convenient online submission • Thorough peer review • No space constraints or color figure charges • Immediate publication on acceptance • Inclusion in PubMed, CAS, Scopus and Google Scholar • Research which is freely available for redistribution Submit your manuscript at www.biomedcentral.com/submit