TRA (Traffic Rate Analysis) to analyze the characteristics of network traffic for. DDoS attacks. Experimental results show that the proposed model is a highly.
A New DDoS Detection Model Using Multiple SVMs and TRA* Jungtaek Seo1, Cheolho Lee1, Taeshik Shon2, Kyu-Hyung Cho2, and Jongsub Moon2 1
National Security Research Institute, 62-1 Hwaam-dong, Yuseong-gu, Daejeon 305-348, Republic of Korea {seojt, chlee}@etri.re.kr 2 CIST, Korea University, 1-Ga, Anam-dong, Sungbuk-Gu, Seoul, Republic of Korea {743zh2k, mathbank, jsmoon}@korea.ac.kr
Abstract. Recently, many attack detection methods adopts machine learning algorithm to improve attack detection accuracy and automatically react to the attacks. However, the previous mechanisms based on machine learning have some disadvantages such as high false positive rate and computing overhead. In this paper, we propose a new DDoS detection model based on multiple SVMs (Support Vector Machine) in order to reduce the false positive rate. We employ TRA (Traffic Rate Analysis) to analyze the characteristics of network traffic for DDoS attacks. Experimental results show that the proposed model is a highly useful classifier for detecting DDoS attacks.
1 Introduction As we can see in the incidents of Distributed Denial of Service (DDoS) attacks against commercial web sites such as Yahoo, e-Bay, and E*Trade, computing resources connected to the Internet are vulnerable to DDoS attacks [1], [2], [3]. DDoS attacks can temporarily disable the network services or damage systems by flooding a huge number of network packets for several minutes or longer. Since these DDoS attacks are harmful to almost all networked systems which have limited computing resources (e.g. network bandwidth, memory, CPU, etc), these attacks are regarded as a serious problem, and thus much research is in progress to detect and prevent them [4] ,[5], [6]. In our earlier research, we presented Traffic Rate Analysis (TRA) to analyze the characteristics of network traffic for the DDoS attacks [7], [8], [9]. TRA is a network traffic analyzing method which examines the occurrence rate of a specific type of packet within the stream of monitored network traffic and is composed of a TCP flag rate and a Protocol rate. The result of analyzing network traffic using TRA showed us that there are distinct and predictable differences between normal traffic and DDoS * This work was supported by the Ministry of Information Communication, Korea, under the
Information Technology Research Center Support Program supervised by the IITA. T. Enokido et al. (Eds.): EUC Workshops 2005, LNCS 3823, pp. 976 – 985, 2005. © IFIP International Federation for Information Processing 2005
A New DDoS Detection Model Using Multiple SVMs and TRA
977
attack traffic. We were able to generate DDoS detection rules by compiling the experimental results with a SVM [10]. However, the false positive rate of the model using single SVM is too high. In order to reduce the false positive rate and to increase the detection rate, we propose the model based on multiple SVMs instead of single one. The experimental results show the proposed detection method has high degree of performance, and detects various DDoS attacks successfully with low false positive rate. We introduce related research in section 2, and explain TRA in section 3. The background knowledge of SVM is discussed in section 4. In section 5, the experimental environment is introduced and the detection performance of SVM and other machine learning algorithms are tested and compared. Lastly, we mention the conclusion of this research and the direction of future work in section 6.
2 Related Work Detecting the DDoS attacks is an essential step to defend DDoS attacks. Thus, there have been many researches to detect the DDoS attacks [4], [5], [6]. When DDoS attacks occur, there is a big mismatch between the packet flows “to-rate” toward the victim and “from-rate” from the victim. Gil and Poletto propose the method that examines the disproportion between “to-rate” and “from-rate” in order to detect DDoS attacks [4]. Kulkarni et al [5] presents DDoS detection methods based on randomness of IP spoofing. Almost DDoS attackers use IP spoofing to hide their real IP addresses and locations. Since spoofed IP addresses are generated randomly, this characteristic of randomness may be used to reveal the occurrence of DDoS attacks. Kulkarni’s method uses Komogorov complexity metrics to measure the randomness of source IP addresses in network packet headers [11]. Wang et al. proposed the method that detects DDoS attack based on the protocol behavior of SYN-FIN(RST) pairs [6]. In the normal situation, the ratio of SYN and FIN is balanced because of the characteristic of the TCP 3-Way handshake. However, the ratio of SYN packet increases drastically during the SYN flooding attack. By monitoring sudden change of the ratio of SYN and FIN, the method detects SYN flooding attacks. However, these approaches are based on the specific characteristics of the attacks such as mismatch of “to-rate” and “from-rate”, effect of IP spoofing, and unbalance of the ratio of SYN and FIN packet. Thus, these may not properly detect the attack that use undefined characteristic. For example, Gil’s method is not applicable to detect attacks using IP spoofing since the method cannot discriminate legitimated packet and spoofed packet, and Wang’s method is only applicable to SYN flooding attacks. On the other hand, the proposed detection model automatically generates detection rules using TRA and multiple SVM.
3 Traffic Rate Analysis 3.1 Definition of Traffic Rate Analysis Traffic rate analysis was defined as measuring packet traffic in a network [7]. It examines the occurrence rate of a specific type of packets within the stream of moni-
978
J. Seo et al.
tored network traffic, and is composed of TCP flag rate and Protocol rate. TCP flag rate is defined in the following equation.
R td [ F i | o ] =
∑ flag ( F ) in ∑ TCP
a TCP header (1) packets
TCP flag rate means the ratio of the number of a specific TCP flag to the total number of TCP packets. In the equation (1), a TCP flag ’F’ can be one of SYN, FIN, RST, ACK, PSH, URG, and NULL, and ’td’ is the time interval used to calculate the value. The direction of network traffic is expressed as ’i’ (inbound) and ’o’ (outbound). For example, R1[Si] means the occurrence rate of SYN flags within TCP packets when measuring inbound network traffic (toward the monitored network) during interval 1.
R td [ [TCP | UDP| ICMP] i | o] =
∑ [TCP| UDP| ICMP] packets ∑ IP packets
(2)
Protocol rate is defined in equation (2). It means the ratio of specific TransportLayer protocol (e.g. TCP, UDP, and ICMP) packets to total Network-Layer (IP) protocol packets. For instance, R1[TCPi] means the occurrence rate of TCP packets within IP packets when measuring outbound network traffic (from the monitored network) during interval 1. 3.2 Network Traffic Changes Under DDoS Attacks
To analyze the change of network traffic from normal web traffic to DDoS attack traffic or vice versa, it is necessary to make a network environment truly identical with the real Internet environment. Our experimental target is web traffic, and web traffic is composed of HTTP requests and replies based on TCP sessions. For example, when a user clicks a certain web site address on his or her web browser, the web browser establishes TCP connections to the relevant web server. After that, the web browser sends HTTP requests to the web server, and the web server sends HTTP replies to the web browser.
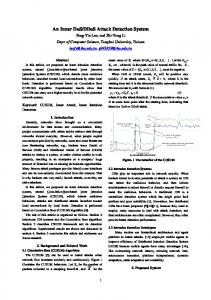
Fig. 1. Network traffic under SYN flooding attack
A New DDoS Detection Model Using Multiple SVMs and TRA
979
Since web service is based on TCP connection, the number of HTTP requests in a TCP session (R/C: Requests per connection) and the number of TCP sessions simultaneously established (SC: Simultaneous Connection) are the key features of web traffic in terms of network traffic analysis. In other words, we can simulate various web traffic environments by adjusting these two features (R/C and SC). R/C values include 1, 2, 5, and 10, and SC can take on values of 5, 10, 50, 100, 150, and 200. Thus we have twenty-four different network environments. With these various web traffic settings, we compared normal web traffic with DDoS attack traffic. Fig. 1 shows us that R1[Si] and R1[Ui] drastically change (go up to almost 1.0) and the other flags decrease (almost 0.0) relatively under SYN flooding attack. When web traffic flows from the 9th second to the 83rd second, a SYN flooding attack occurs between the 26th and 67th second. This phenomenon is caused by the burst of SYN and URG packets, which are generated by SYN flooding attack. Furthermore, we can also see big changes of network traffic during other types of DDoS attacks such as ICMP flooding attacks or UDP flooding attacks [7], [8], [9].
4 Support Vector Machine 4.1 Background
Support Vector Machine (SVM) is a learning machine that plots the training vectors in high-dimensional feature space, and labels each vector by its class. SVM views the classification problem as a quadratic optimization problem. It combines generalization control with a technique to avoid the “curse of dimensionality” by placing an upper bound on a margin between the different classes, making it a practical tool for large and dynamic data sets. SVM classifies data by determining a set of support vectors, which are members of the set of training inputs that outline a hyper plane in feature space. The SVM is based on the idea of structural risk minimization, which minimizes the generalization error, i.e. true error on unseen examples. The number of free parameters used in the SVM depends on the margin that separates the data points to classes but not on the number of input features. Thus SVM does not require a reduction in the number of features in order to avoid over fitting. SVM provides a generic mechanism to fit the data within a surface of a hyper-plane of a class through the use of a kernel function. The user may provide a kernel function, such as a linear, polynomial, or sigmoid curve, to the SVM during the training process, which selects support vectors along the surface of the function. This capability allows classifying a broader range of problems [12], [13]. 4.2 SVM for Categorization
In this section we review some basic ideas of SVM. Given the training data set {(x i , d i )}iN= 1 with input data x i ∈ R N and corresponding binary class labels d i ∈ {− 1 ,1} , the SVM classifier formulation starts from the following assumption. The classes represented by the subset d i = 1 and d i = − 1 are linearly separable, where ∃w ∈ R N , b ∈ R such that
980
J. Seo et al. ⎧⎪wT x + b > 0 for di = +1⎫⎪ ∃w, b s.t ⎨ T i ⎬ ⎪⎩w xi + b < 0 for di = −1⎪⎭
(3)
The goal of SVM is to find an optimal hyper plane for which the margin of separation, ρ , is maximized. ρ is defined by the separation between the separating hyperplane and the closest data point. If the optimal hyperplane is defined by (w 0T ⋅ x )+ b 0 = 0 , then the function g ( x ) = w 0T ⋅ x + b 0 gives a measure of the distance from x to the optimal hyperplane. Support Vectors are defined by data points x (s ) that lie the closest to the decision surface. For a support vector x ( s ) and the canonical optimal hyperplane g , we have r=
g ( x s ) ⎧⎪+1 w0 =⎨ w0 ⎪⎩−1 w0
for d (s ) = +1⎫⎪ ⎬ for d (s) = −1⎪⎭ ρ
(4)
1
∝
w Since, the margin of separation is . w 0 should be minimal to achieve the maximal separation margin. Mathematical formulation for finding the canonical optimal separation hyperplane, given the training data set {( x , d )} , solves the following quadratic problem 0
i
l ⎧ ⎫ 1 2 minτ (ω,ξ ) = w + C ζ i ⎪ ⎪ 2 ⎨ ⎬ i=1 ⎪ ⎪ T ⎩s.t di (w xi + b) ≥ 1 − ζ i for ζ i ≥ 0, i = 1,K, l ⎭
∑
i
N i=1
(5)
Note that the global minimum of above problem must exist, because 1 w is convex in w and the constrains are linear in w and b. This 2 constrained optimization problem is dealt with by introducing Lagrange multipliers ai ≥ 0 and a Lagrangian function given by Φ ( w ) =
2
0
L(w, b, ζ , a, v) = τ (w, ζ ) −
∑a [d (w x + b) −1+ ζ ]− ∑v ζ l
l
i
T i i
i
k
i
i =1
(6)
i
i=1
which leads to ∂L = 0 ⇔ w− ∂w
l
l
∑a d x
= 0 (∴ w =
i i i
i=1
∂L =0 ⇔ ∂b
∑a d x )
(7)
i i i
i=1
l
∑a d
i i
=0
(8)
i=1
The solution vector thus has an expansion in terms of a subset of the training patterns, namely those patterns whose a i is non-zero, called Support Vectors. By the Karush-Kuhn-Tucker complementarity conditions, we have,
[(
) ]
ai di wT xi + b − 1 = 0
for i = 1,K, N
by substituting (7),(8) and (9) into equation (6), find multipliers
(9) a
i
for which
A New DDoS Detection Model Using Multiple SVMs and TRA l
maxΘ(a) =
l
l
∑a − 2 ∑∑a a d d 1
i
xi ⋅ x j
i j i i
i=1
981
(10)
i=1 i=1
l
∑a y = 0
s.t. 0 ≤ ai ≤ c, i = 1,K, l and
i i
(11)
i =1
The hyperplane decision function can thus be written as ⎛ f ( x) = sgn⎜ ⎜ ⎝
⎞
∑ y a ⋅ (x ⋅ x ) + b⎟⎟ i i
i
⎠
(12)
where b is computed using (9). To construct the SVM, the optimal hyperplane algorithm has to be augmented by a method for computing dot products in feature spaces nonlinearly related to input spac e. The basic idea is to map the data into some other dot product space (called the featu re space) F via a nonlinear map Φ , and to perform the above linear algorithm in F, i.e N nonseparable data {( x i , d i )}i = 1 , where x i ∈ R N , d i ∈ {+ 1 , − 1 } , preprocess the dat a with, Φ : R N → Θ( x) where N